. 2016 Oct 10:7:12948.
doi: 10.1038/ncomms12948.

Nicotinamide riboside is uniquely and orally bioavailable in mice and humans

Affiliations

Nicotinamide riboside is uniquely and orally bioavailable in mice and humans

Samuel A J Trammell et al. Nat Commun. .

Abstract

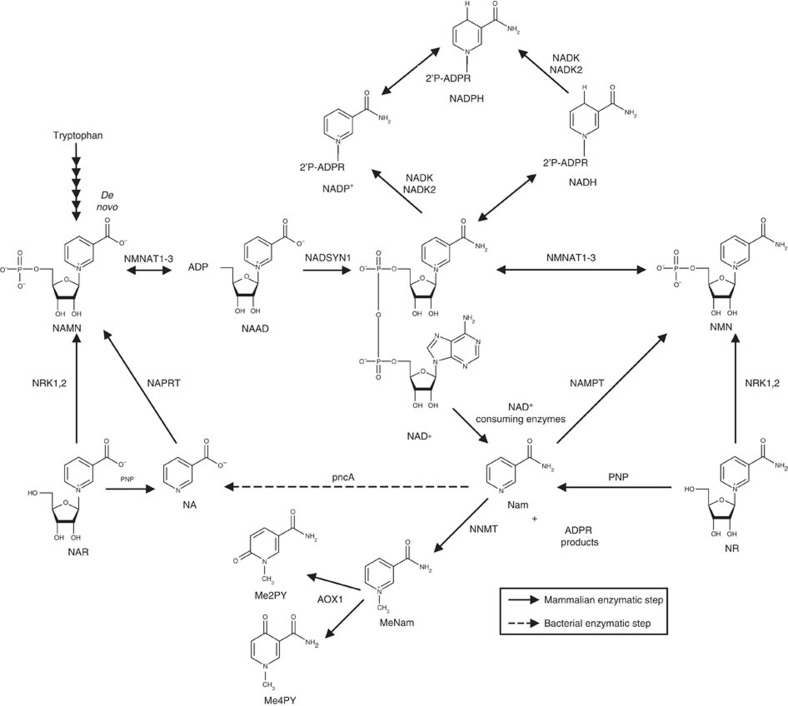
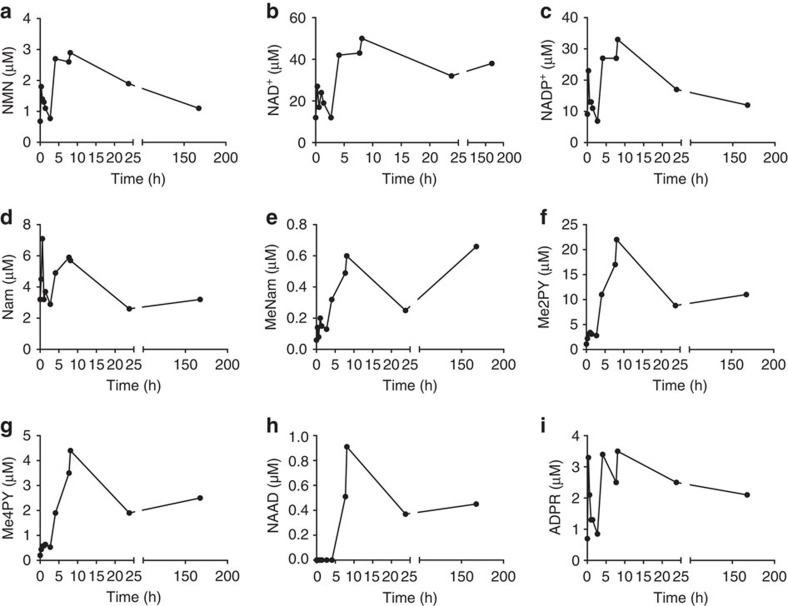
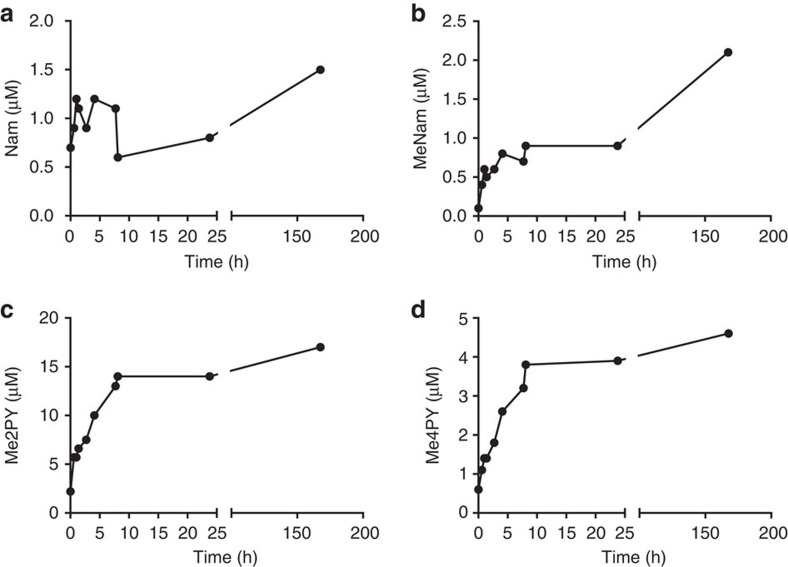
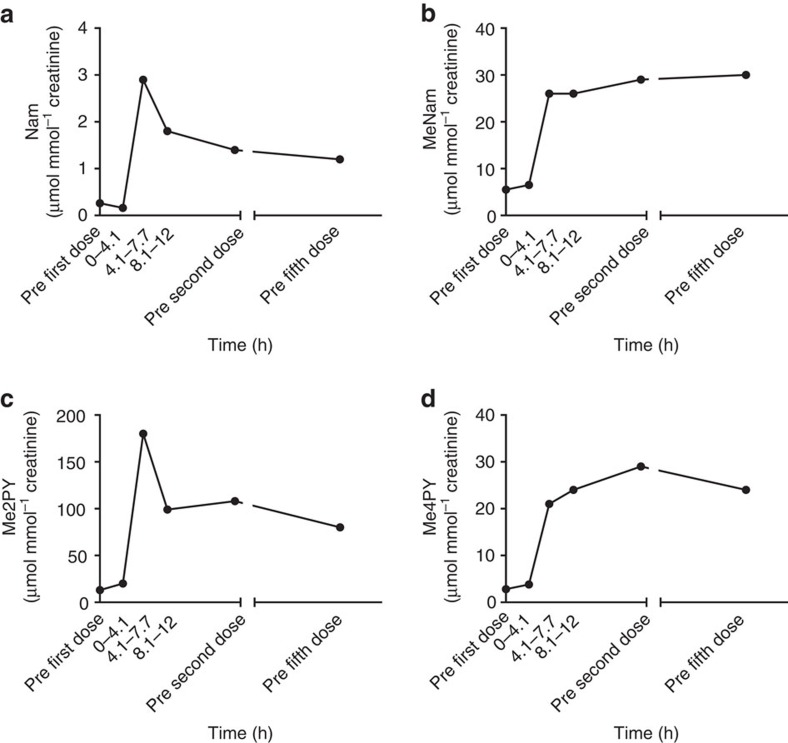
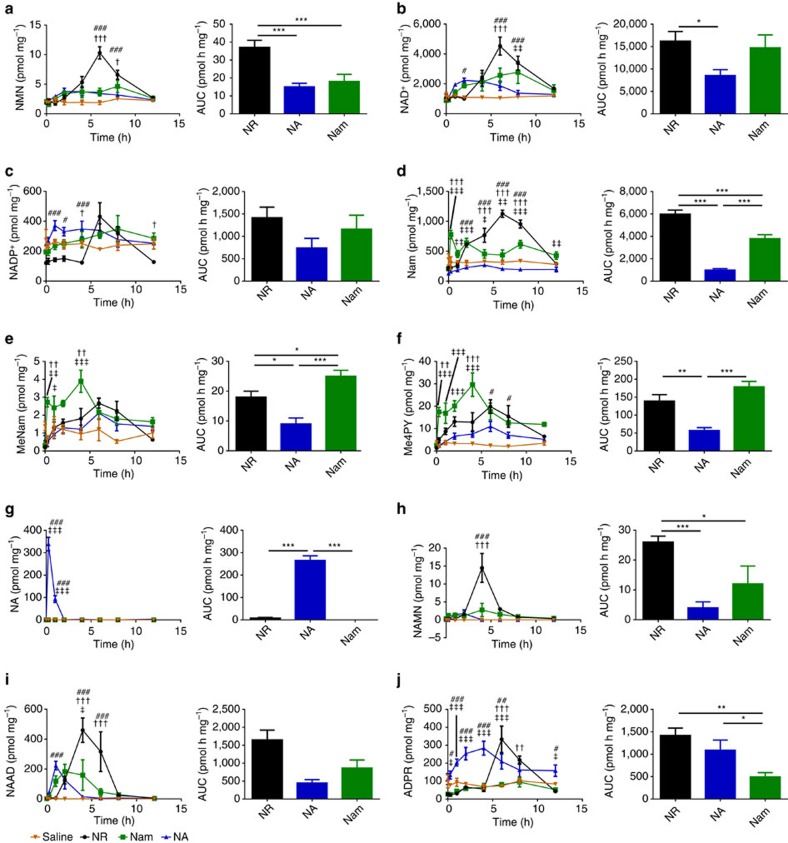
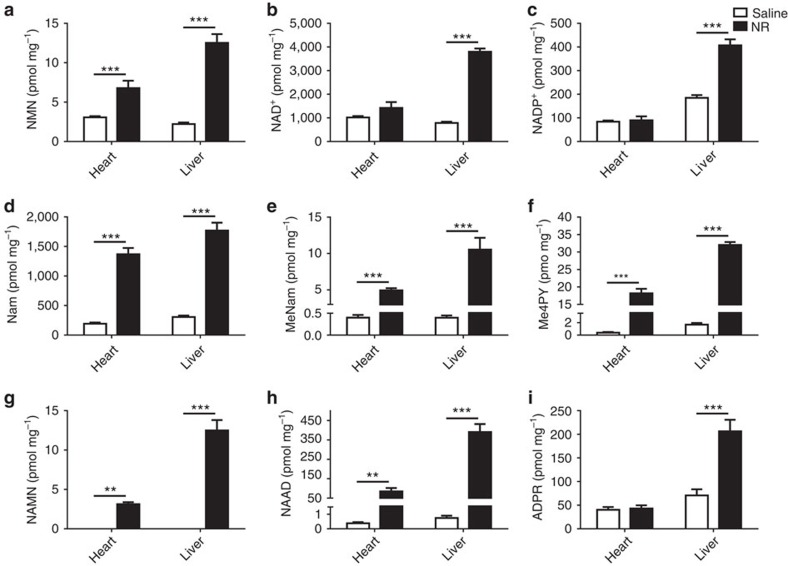
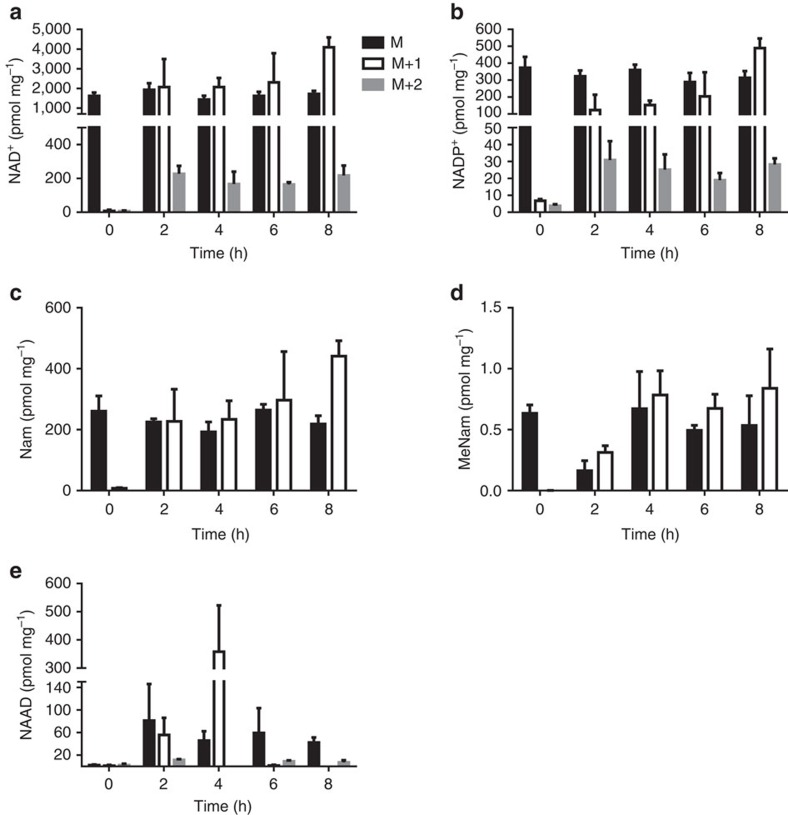
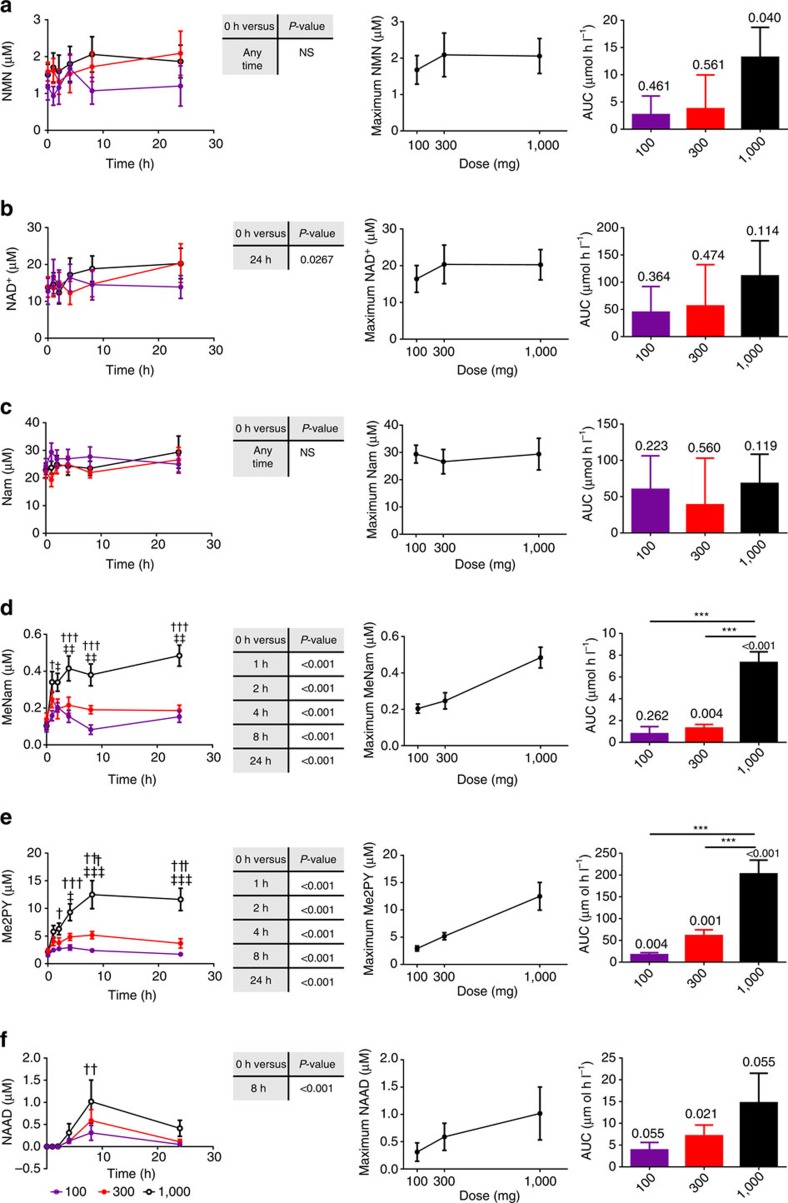
Nicotinamide riboside (NR) is in wide use as an NAD+ precursor vitamin. Here we determine the time and dose-dependent effects of NR on blood NAD+ metabolism in humans. We report that human blood NAD+ can rise as much as 2.7-fold with a single oral dose of NR in a pilot study of one individual, and that oral NR elevates mouse hepatic NAD+ with distinct and superior pharmacokinetics to those of nicotinic acid and nicotinamide. We further show that single doses of 100, 300 and 1,000 mg of NR produce dose-dependent increases in the blood NAD+ metabolome in the first clinical trial of NR pharmacokinetics in humans. We also report that nicotinic acid adenine dinucleotide (NAAD), which was not thought to be en route for the conversion of NR to NAD+, is formed from NR and discover that the rise in NAAD is a highly sensitive biomarker of effective NAD+ repletion.


Conflict of interest statement

F.J., R.W.D. and C.B. own stock in ChromaDex, the supplier of NR and sponsor of the clinical study. F.J. and R.W.D. are employees of ChromaDex. M.E.M. has received research grants and serves as a consultant for ChromaDex. C.B. has received a research grant and serves on the scientific advisory board of ChromaDex. S.A.J.T. and C.B. have an intellectual property interest in detecting NAAD as a biomarker of elevated NAD metabolism. C.B. is the chief scientific adviser of ProHealthspan, which sells NR supplements. The remaining authors declare no competing financial interests.

Figures

Figure 1
Figure 1. The NAD+ metabolome.
NAD+ is synthesized by salvage of the vitamin precursors, NA, Nam and NR, or from tryptophan in the de novo pathway. NAD+ can be reduced to NADH, phosphorylated to NADP+ or consumed to Nam. Nam can also be methylated and oxidized to waste products. NAAD was not thought to be a precursor of NAD+ from NR.
Figure 2
Figure 2. Elevation of the PBMC NAD+ metabolome by oral NR in a 52 year-old male.
A healthy 52-year-old male ingested 1,000 mg NC Cl daily for 1 week. PBMCs were prepared from blood collected before the first dose (0 h), at seven time points after the first dose (0.6, 1, 1.4, 2.7, 4.1, 7.7 and 8.1 h), before second dose (23.8 h) and 24 h after the seventh dose (167.6 h). Concentrations (a, NMN; b, NAD+; c, NADP+; d, Nam; e, MeNam; f, Me2PY; g, Me4PY; h, NAAD; i, ADPR) are with respect to whole blood volumes. The data indicate that the NAD+ metabolome—with the exception of Nam and NAAD—is elevated by the 4.1 time point post ingestion. Whereas PBMC Nam was never elevated by NR, NAAD was elevated by the next time point. NAD+ and NAAD remained elevated 24 h after the last dose.
Figure 3
Figure 3. Elevation of the plasma NAD+ metabolome by oral NR in a 52-year-old male.
A healthy 52-year-old male ingested 1,000 mg NC Cl daily for 1 week. Plasma samples were prepared from blood collected before the first dose (0 h), at seven time points after the first dose (0.6, 1, 1.4, 2.7, 4.1, 7.7 and 8.1 h), before second dose (23.8 h) and 24 h after the seventh dose (167.6 h). Concentrations (a, Nam; b, MeNam; c, Me2PY; d, Me4PY) are with respect to whole blood volumes. The data indicate that plasma MeNam, Me4PY and Me2PY are strongly elevated by oral NR. No phosphorylated species were found in plasma.
Figure 4
Figure 4. Elevation of the urinary NAD+ metabolome by oral NR in a 52-year-old male.
A healthy 52-year-old male ingested 1,000 mg NC Cl daily for 1 week. Urine was collected before the first dose, in three collection fractions in the first 12 h and before the second and fifth daily dose. Concentrations (a, Nam; b, MeNam; c, Me2PY; d, Me4PY) are normalized to urinary creatinine. The data indicate that urinary MeNam, Me4PY and Me2PY are the dominant metabolites elevated by oral NR. No phosphorylated species were found in urine.
Figure 5
Figure 5. NR elevates hepatic NAD+ metabolism distinctly with respect to other vitamins.
Either saline (orange, n=3 per time point) or equivalent moles of NR (black, n=3 per time point), NA (blue, n=4 per time point) and Nam (green, n=4 per time point) were administered to male C57Bl6/J mice by gavage. To control for circadian effects, gavage was performed at indicated times before a common ∼2 pm tissue collection. In the left panels, the hepatic concentrations (pmol per mg of wet tissue weight) of each metabolite (a, NMN; b, NAD+; c, NADP+; d, Nam; e, MeNam; f, Me4PY; g, NA; h, NAMN; i, NAAD; and j, ADPR) are shown as a function of the four gavages. The excursion of each metabolite as a function of saline gavage is shown in orange; as a function of NR in black; as function of Nam in green; and NA in blue. In the right panels, the baseline-subtracted 12-hour AUCs are shown. (left) P value<0.05; ‡‡P value<0.01; ‡‡‡P value <0.001 Nam versus NA; P value<0.05; ††P value<0.01; †††P value<0.001 Nam versus NR; #P value<0.05; ##P value<0.01; ###P value<0.05 NA versus NR; (right) *P value<0.05; **P value<0.01; ***P value <0.001. The data indicate that NR produces greater increases in NAD+ metabolism than Nam or NA with distinctive kinetics, that Nam is disadvantaged in stimulation of NAD+-consuming activities, and that NAAD is surprisingly produced after oral NR administration.
Figure 6
Figure 6. Rising NAAD is a more sensitive biomarker of elevated tissue NAD+ metabolism than is NAD+.
Male C57Bl6/J mice were intraperitoneally injected either saline (n=8) or NR Cl (500 mg kg−1 body weight) (n=6) for 6 days. Livers and hearts were freeze-clamped and prepared for metabolomic analysis. Concentrations of NAD+ metabolites (a, NMN; b, NAD+; c, NADP+; d, Nam; e, MeNam; f, Me4PY; g, NAMN; h, NAAD; i, ADPR) in heart and liver are presented in pmol mg−1 of wet tissue weight. Data were analysed using a two-way analysis of variance followed by a Holm–Sidak multiple comparisons test. *P value<0.05, **P value<0.01, ***P value<0.001. NR strikingly increased NAAD even in the heart, a tissue in which NAD+ metabolism was increased without an increase in steady-state NAD+ concentration.
Figure 7
Figure 7. NR contributes directly to hepatic NAAD.
Double-labelled NR was orally administered to mice. At indicated times after gavage, mice (n=3) were euthanized and livers freeze-clamped for isotopic enrichment analysis. Data are plotted as pmol mg−1 of wet tissue weight. At the 2 h time point, hepatic NAD+ (a) shows 54% incorporation of M+1 and M+2 species, indicating that more than half of the NAD+ is turned over before there is a rise in steady-state NAD+. At 2 h, hepatic NADP+ (b) shows 32% incorporation of label(s) from ingested NR. At all time points, half or more of hepatic Nam (c) and MeNam (d) carries an NR-derived label, indicating that NR has driven rapid NAD+ synthesis and consumption. At 2 h after gavage, 45% of hepatic NAAD (e) incorporates NR-derived label(s). At 2 h, hepatic NAD+ (a), NADP+ (b) and NAAD (e) pools incorporate 5, 6 and 8% of double-labelled NR indicating that NR is a direct precursor of all three metabolites and excluding the possibility that the NR-driven increase in NAAD is due to inhibition of de novo synthesis.
Figure 8
Figure 8. Dose-dependent effects of NR on the NAD+ metabolome of human subjects.
Time-dependent PBMC NAD+ metabolomes from n=12 healthy human subjects were quantified after three different oral doses of NR. In each left panel, the blood concentration of a metabolite as a function of dose and time is displayed (a, NMN; b, NAD+; c, Nam; d, MeNam; e, Me2PY; f, NAAD). #P value<0.05; ##P value<0.01 100 mg versus. 300 mg; ††P value<0.01; †††P value<0.001 100 versus. 1,000; P value<0.05; ‡‡P value<0.01 300 versus. 1,000. A Dunnett's test was performed comparing the average concentration of each metabolite at each time point to the concentration of that metabolite at time zero. Significant elevations of NAD+, MeNam, Me2PY and NAAD are indicated. In each middle panel, the averaged maximum metabolite concentration per dose is plotted. In each right panel, the background-subtracted metabolite AUCs are displayed with a one sample t-test comparing the AUC to background above each bar. In addition, asterisks indicate dose-dependent increases in metabolite AUC (*P value<0.05; **P value<0.01; ***P value<0.001). The data indicate that all doses of NR elevated 8 h NAAD and 24 h NAD+, and that additional NAD+ metabolites were elevated dose dependently with statistical significance by multiple comparisons.

References

    1. Belenky P., Bogan K. L. & Brenner C. NAD(+) metabolism in health and disease. Trends. Biochem. Sci. 32, 12–19 (2007). - PubMed
    1. Bogan K. L. & Brenner C. Nicotinic acid, nicotinamide and nicotinamide riboside: a molecular evaluation of NAD+ precursor vitamins in human nutrition. Annu. Rev. Nutr. 28, 115–130 (2008). - PubMed
    1. Bouchard V. J., Rouleau M. & Poirier G. G. PARP-1, a determinant of cell survival in response to DNA damage. Exp. Hematol. 31, 446–454 (2003). - PubMed
    1. Finkel T., Deng C. X. & Mostoslavsky R. Recent progress in the biology and physiology of sirtuins. Nature 460, 587–591 (2009). - PMC - PubMed
    1. Okamoto H., Takawasa S. & Sugawara A. The CD38-cyclic ADP-ribose system in mammals: historical background, pathophysiology and perspective. Messenger 3, 27–24 (2014).

Publication types

LinkOut - more resources