

Fluid-Structure Simulations of a Ruptured Intracranial Aneurysm: Constant versus Patient-Specific Wall Thickness
- PMID: 27721898
- PMCID: PMC5045998
- DOI: 10.1155/2016/9854539
Fluid-Structure Simulations of a Ruptured Intracranial Aneurysm: Constant versus Patient-Specific Wall Thickness
Abstract
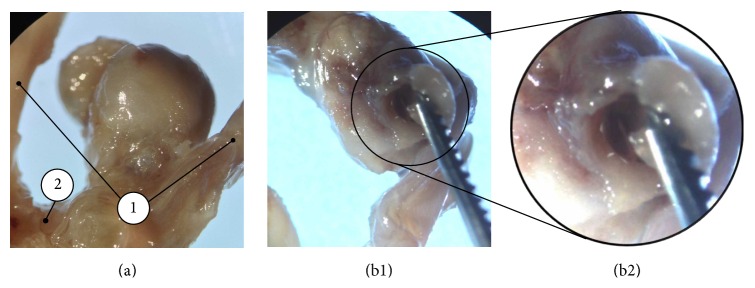
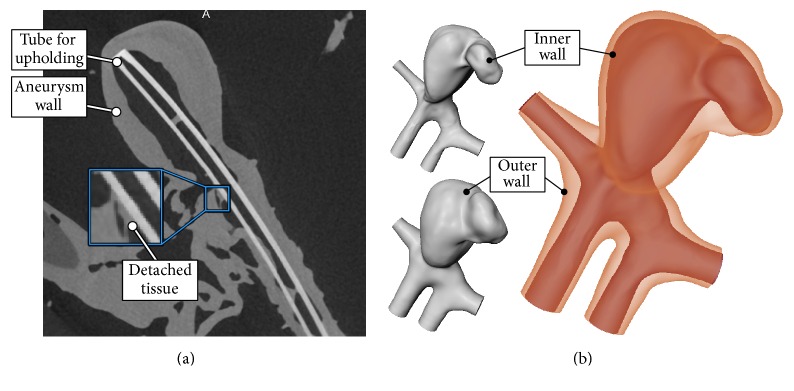
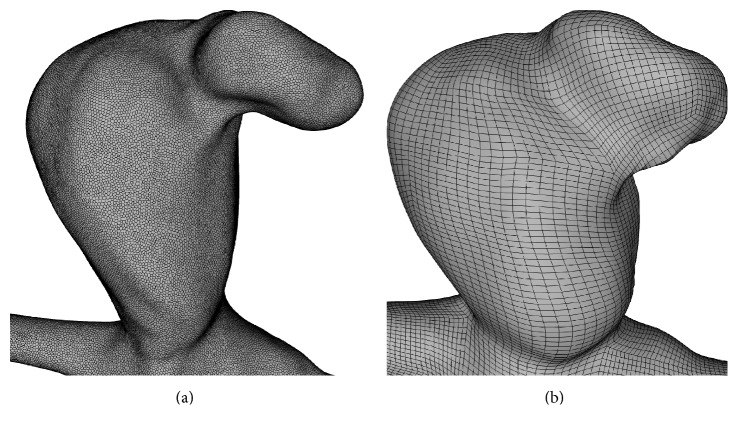
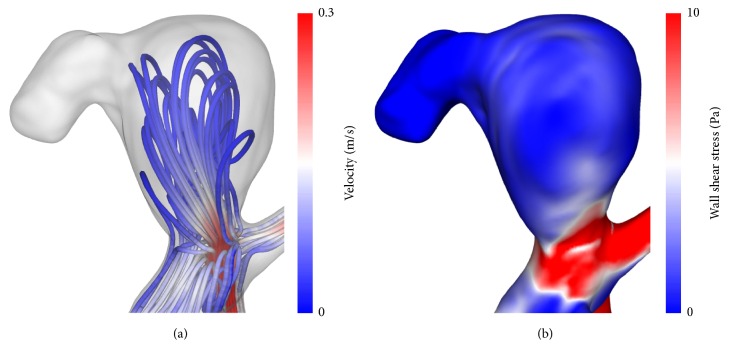
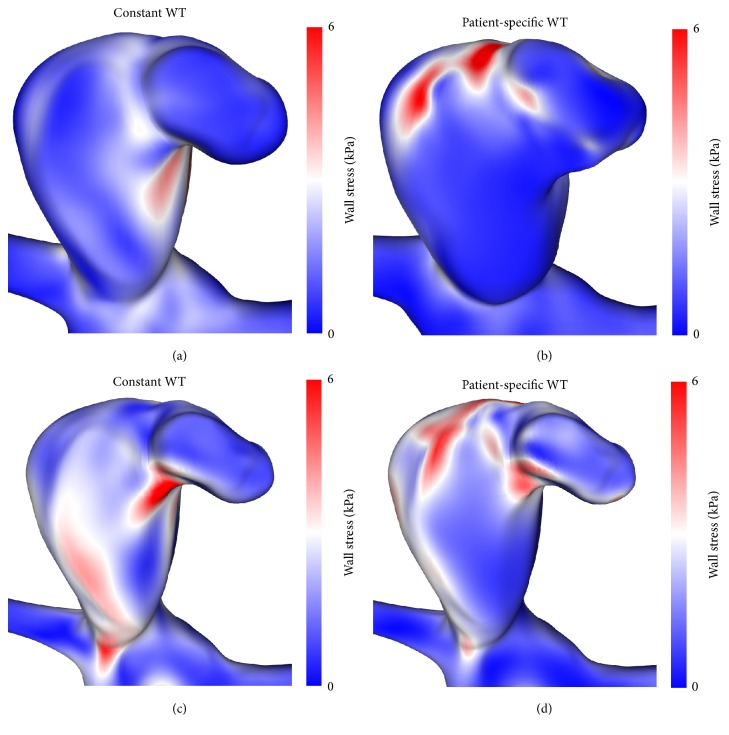
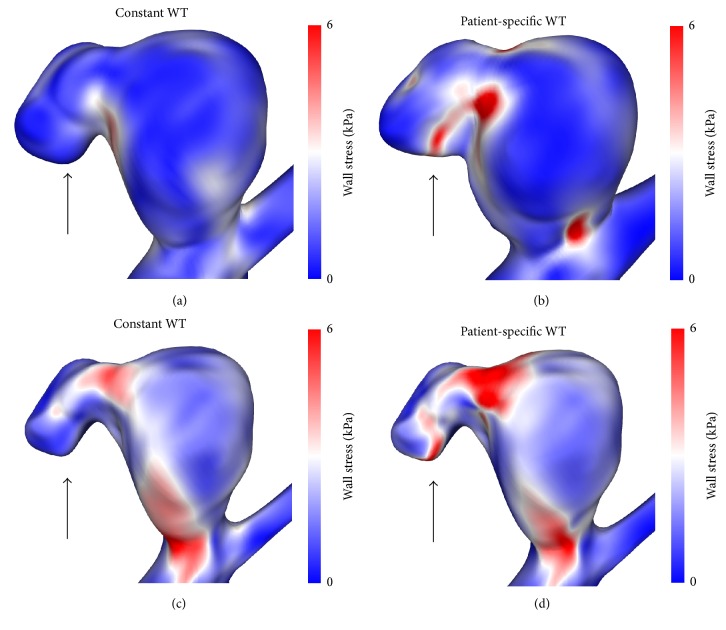
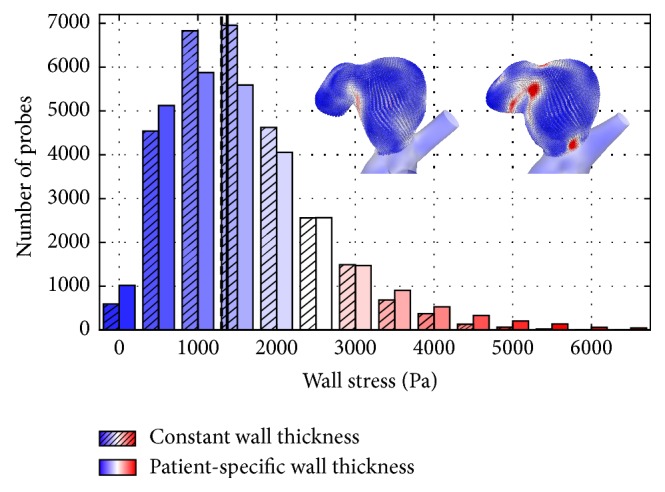
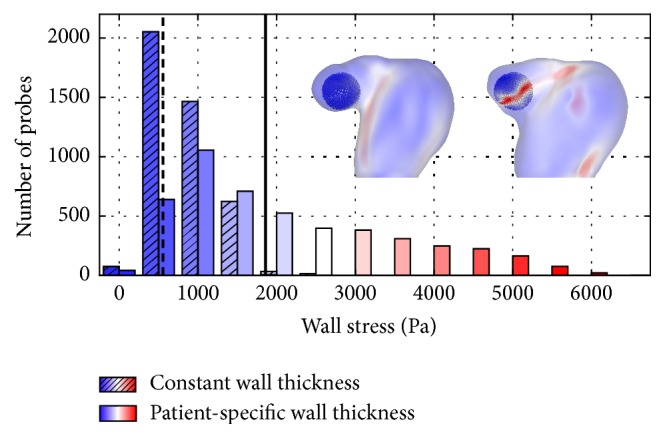
Computational Fluid Dynamics is intensively used to deepen the understanding of aneurysm growth and rupture in order to support physicians during therapy planning. However, numerous studies considering only the hemodynamics within the vessel lumen found no satisfactory criteria for rupture risk assessment. To improve available simulation models, the rigid vessel wall assumption has been discarded in this work and patient-specific wall thickness is considered within the simulation. For this purpose, a ruptured intracranial aneurysm was prepared ex vivo, followed by the acquisition of local wall thickness using μCT. The segmented inner and outer vessel surfaces served as solid domain for the fluid-structure interaction (FSI) simulation. To compare wall stress distributions within the aneurysm wall and at the rupture site, FSI computations are repeated in a virtual model using a constant wall thickness approach. Although the wall stresses obtained by the two approaches-when averaged over the complete aneurysm sac-are in very good agreement, strong differences occur in their distribution. Accounting for the real wall thickness distribution, the rupture site exhibits much higher stress values compared to the configuration with constant wall thickness. The study reveals the importance of geometry reconstruction and accurate description of wall thickness in FSI simulations.
Conflict of interest statement
The authors declare that there are no competing interests regarding the publication of this paper.
Figures
Similar articles
-
Local hemodynamics at the rupture point of cerebral aneurysms determined by computational fluid dynamics analysis.Cerebrovasc Dis. 2012;34(2):121-9. doi: 10.1159/000339678. Epub 2012 Aug 1. Cerebrovasc Dis. 2012. PMID: 22965244
-
Fluid-structure interaction of patient-specific Circle of Willis with aneurysm: Investigation of hemodynamic parameters.Biomed Mater Eng. 2018;29(3):357-368. doi: 10.3233/BME-181732. Biomed Mater Eng. 2018. PMID: 29578465
-
Blood flow dynamics in patient-specific cerebral aneurysm models: the relationship between wall shear stress and aneurysm area index.Med Eng Phys. 2008 Apr;30(3):329-40. doi: 10.1016/j.medengphy.2007.04.011. Epub 2007 Jun 6. Med Eng Phys. 2008. PMID: 17556005
-
CFD: computational fluid dynamics or confounding factor dissemination? The role of hemodynamics in intracranial aneurysm rupture risk assessment.AJNR Am J Neuroradiol. 2014 Oct;35(10):1849-57. doi: 10.3174/ajnr.A3710. Epub 2013 Sep 12. AJNR Am J Neuroradiol. 2014. PMID: 24029393 Free PMC article. Review.
-
How patient specific are patient-specific computational models of cerebral aneurysms? An overview of sources of error and variability.Neurosurg Focus. 2019 Jul 1;47(1):E14. doi: 10.3171/2019.4.FOCUS19123. Neurosurg Focus. 2019. PMID: 31261118 Review.
Cited by
-
Real-World Variability in the Prediction of Intracranial Aneurysm Wall Shear Stress: The 2015 International Aneurysm CFD Challenge.Cardiovasc Eng Technol. 2018 Dec;9(4):544-564. doi: 10.1007/s13239-018-00374-2. Epub 2018 Sep 10. Cardiovasc Eng Technol. 2018. PMID: 30203115 Free PMC article.
-
Multiple intracranial aneurysms: a direct hemodynamic comparison between ruptured and unruptured vessel malformations.Int J Comput Assist Radiol Surg. 2018 Jan;13(1):83-93. doi: 10.1007/s11548-017-1643-0. Epub 2017 Jul 21. Int J Comput Assist Radiol Surg. 2018. PMID: 28733907
-
Medical Image-Based Computational Fluid Dynamics and Fluid-Structure Interaction Analysis in Vascular Diseases.Front Bioeng Biotechnol. 2022 Apr 27;10:855791. doi: 10.3389/fbioe.2022.855791. eCollection 2022. Front Bioeng Biotechnol. 2022. PMID: 35573253 Free PMC article. Review.
-
Is Accurate Lumen Segmentation More Important than Outlet Boundary Condition in Image-Based Blood Flow Simulations for Intracranial Aneurysms?Cardiovasc Eng Technol. 2023 Oct;14(5):617-630. doi: 10.1007/s13239-023-00675-1. Epub 2023 Aug 15. Cardiovasc Eng Technol. 2023. PMID: 37582997 Free PMC article.
-
Complex wall modeling for hemodynamic simulations of intracranial aneurysms based on histologic images.Int J Comput Assist Radiol Surg. 2021 Apr;16(4):597-607. doi: 10.1007/s11548-021-02334-z. Epub 2021 Mar 14. Int J Comput Assist Radiol Surg. 2021. PMID: 33715047 Free PMC article.
References
MeSH terms
LinkOut - more resources
Full Text Sources
Other Literature Sources
Medical
