. 2018 Jan;175(2):284-300.
doi: 10.1111/bph.13642. Epub 2016 Nov 15.

Development of a stretch-induced neurotrauma model for medium-throughput screening in vitro: identification of rifampicin as a neuroprotectant

Affiliations

Development of a stretch-induced neurotrauma model for medium-throughput screening in vitro: identification of rifampicin as a neuroprotectant

Isabel López-García et al. Br J Pharmacol. 2018 Jan.

Abstract

Background and purpose: We hypothesized that an in vitro, stretch-based model of neural injury may be useful to identify compounds that decrease the cellular damage in neurotrauma.

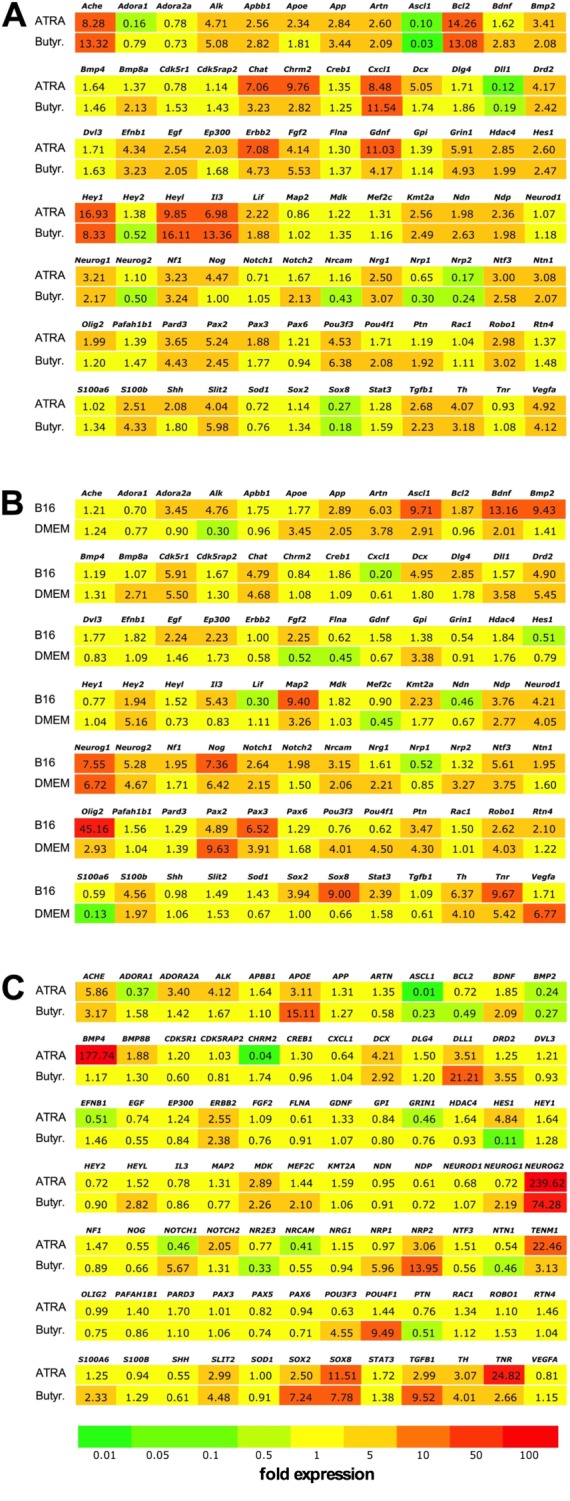
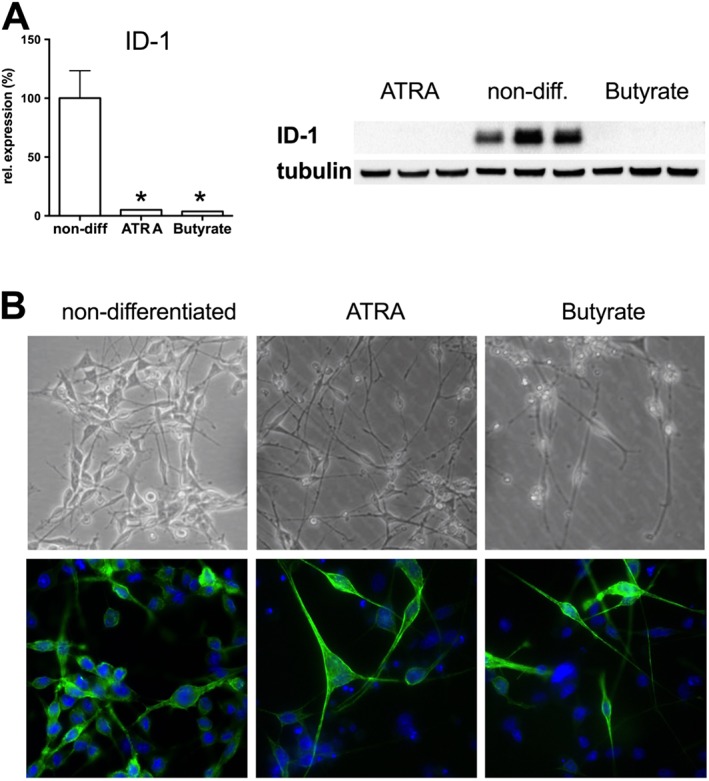
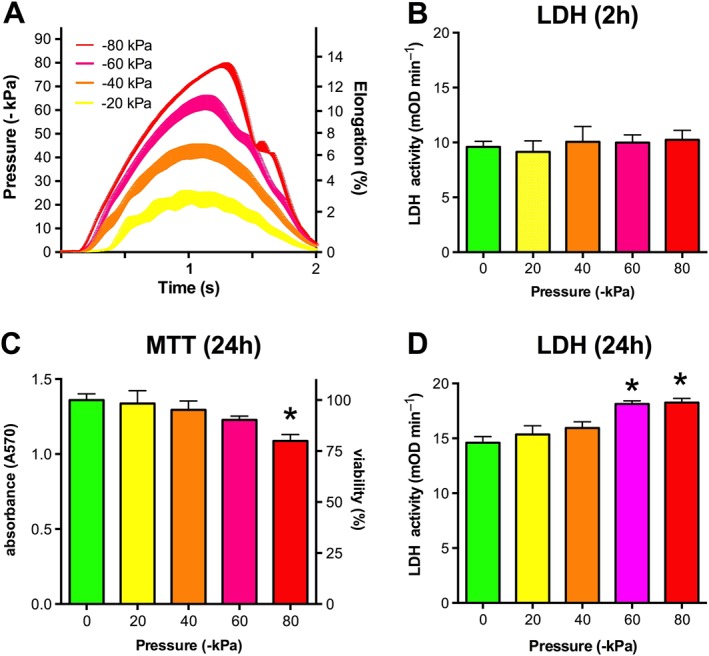
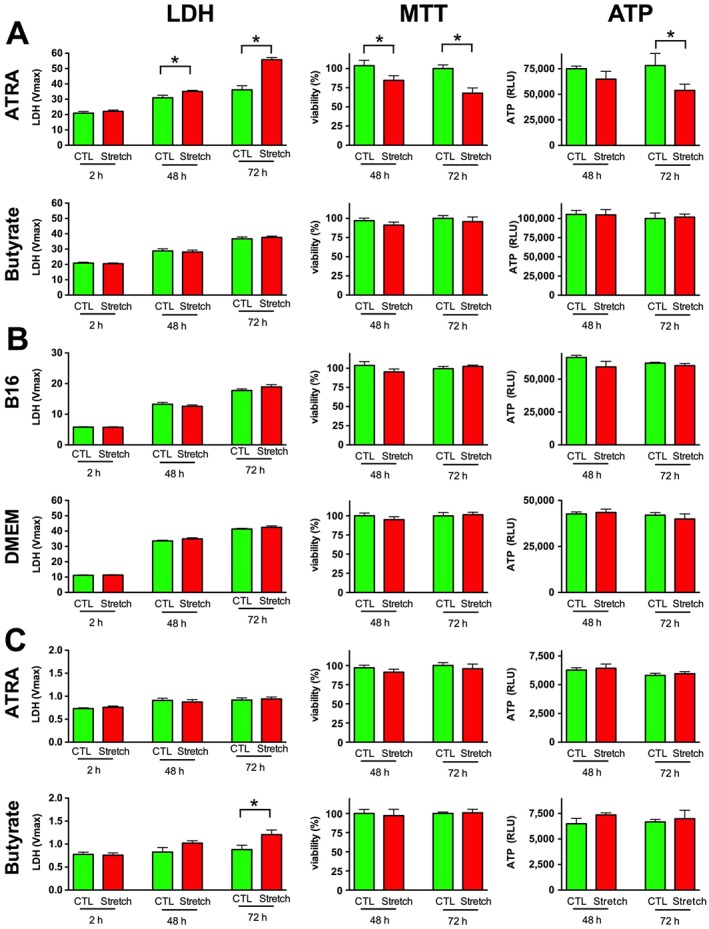
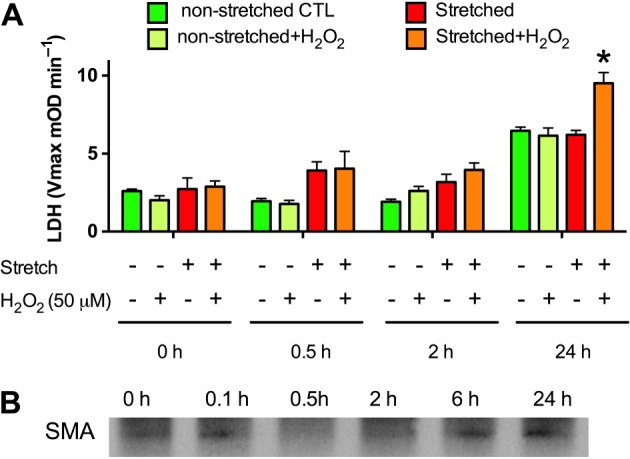
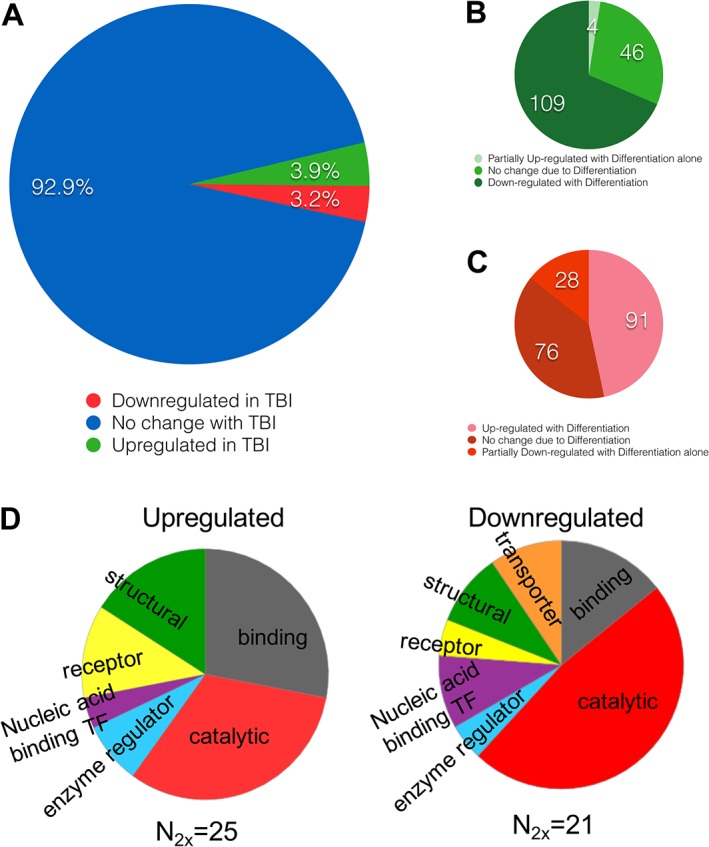
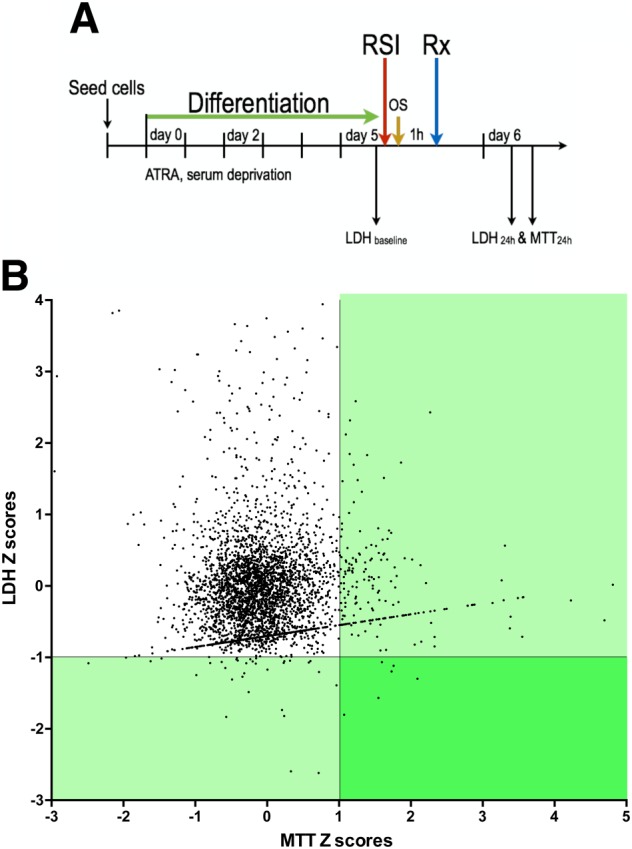
Experimental approach: We screened three neural cell lines (B35, RN33B and SH-SY5Y) subjected to two differentiation methods and selected all-trans-retinoic acid-differentiated B35 rat neuroblastoma cells subjected to rapid stretch injury, coupled with a subthreshold concentration of H2 O2 , for the screen. The model induced marked alterations in gene expression and proteomic signature of the cells and culminated in delayed cell death (LDH release) and mitochondrial dysfunction [reduced 3-(4,5-dimethyl-2-thiazolyl)-2,5-diphenyl-2H-tetrazolium bromide (MTT) conversion]. Follow-up studies utilized human stem cell-derived neurons subjected to rapid stretch injury.

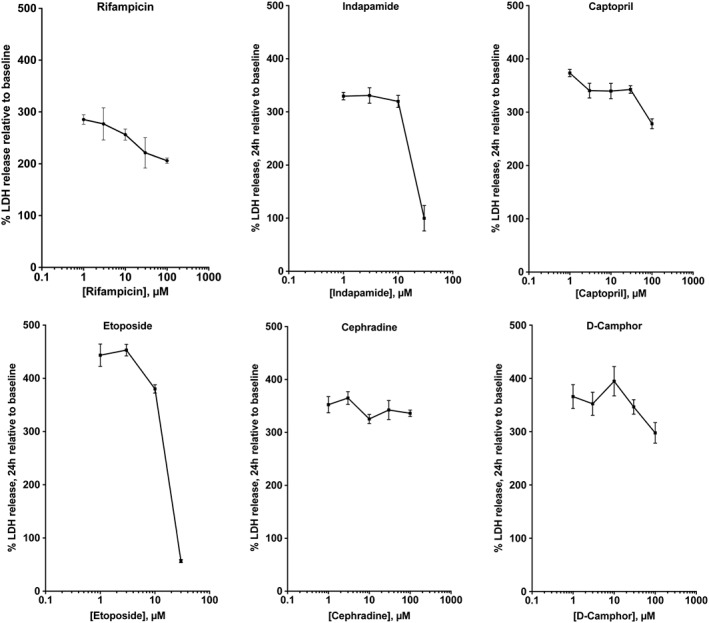
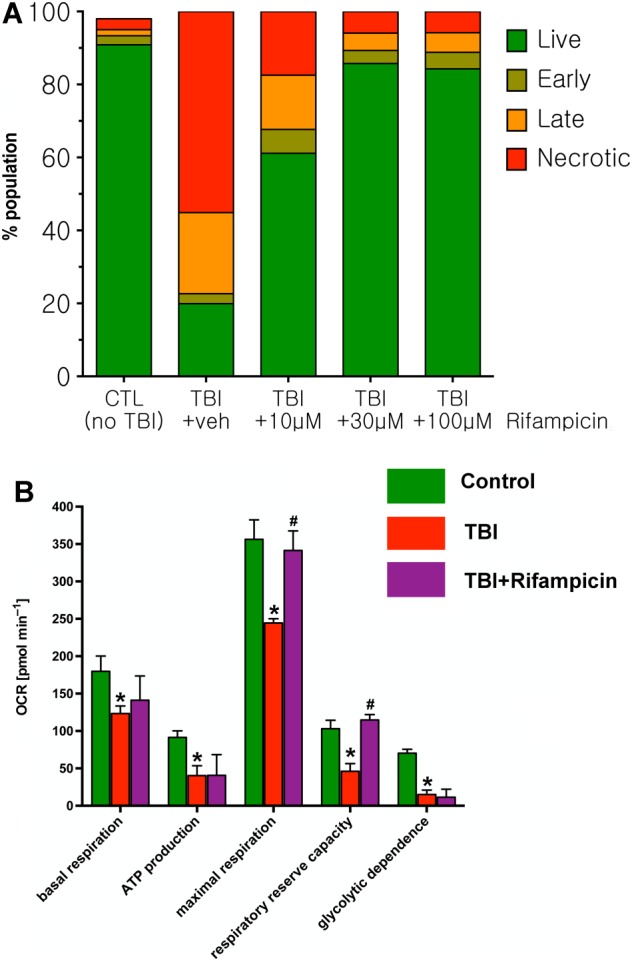
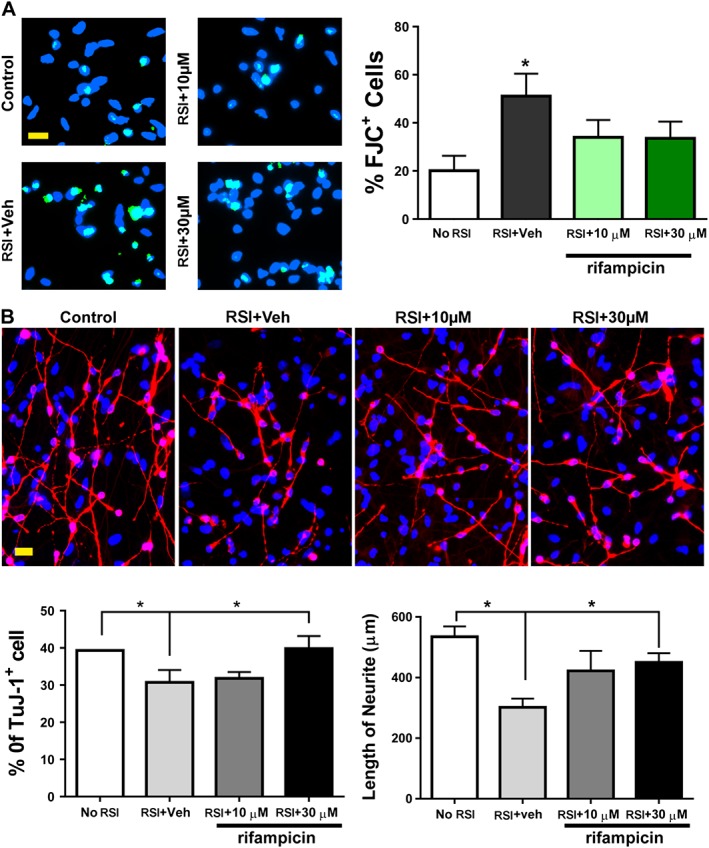
Key results: From screening of a composite library of 3500 drugs, five drugs (when applied in a post-treatment regimen relative to stretch injury) improved both LDH and MTT responses. The effects of rifampicin were investigated in further detail. Rifampicin reduced cell necrosis and apoptosis and improved cellular bioenergetics. In a second model (stretch injury in human stem cell-derived neurons), rifampicin pretreatment attenuated LDH release, protected against the loss of neurite length and maintained neuron-specific class III β-tubulin immunoreactivity.

Conclusions and implications: We conclude that the current model is suitable for medium-throughput screening to identify compounds with neuroprotective potential. Rifampicin, when applied either in pre- or post-treatment, improves the viability of neurons subjected to stretch injury and protects against neurite loss. Rifampicin may be a candidate for repurposing for the therapy of traumatic brain injury.

Linked articles: This article is part of a themed section on Inventing New Therapies Without Reinventing the Wheel: The Power of Drug Repurposing. To view the other articles in this section visit http://onlinelibrary.wiley.com/doi/10.1111/bph.v175.2/issuetoc.


Figures

Figure 1
Figure 1
Differentiation‐associated gene expression changes in neural cells. Expression levels of genes associated with neural differentiation were evaluated using neurogenesis PCR arrays. Gene symbols and average fold changes are shown compared with non‐differentiated control cells on a coloured background that highlights the changes in expression levels. (A) B35 neuroblastoma cells, differentiated by exposure to ATRA (10 μM) or sodium butyrate (Butyr., 300 μM). (B) RN33B neural cells, differentiated by exposure to 39°C in serum‐free B16 or DMEM/F12 medium. (C) SH‐SY5Y neuroblastoma cells, differentiated by exposure to ATRA (10 μM) or sodium butyrate (300 μM).
Figure 2
Figure 2
Differentiation of B35 neural cells on the morphological and protein expression level. B35 neuroblastoma cells were grown on collagen‐treated culture surface, and differentiation was induced by exposure to ATRA (10 μM) or sodium butyrate (Butyrate, 300 μM). (A) The level of the cell proliferation marker ID‐1 was measured by Western blotting. In differentiated B35 cultures, ID‐1 was almost undetectable. Representative blot image and densitometric analysis of ID‐1 values normalized to tubulin expression are shown. Data are shown as mean ± SEM, n = 5; *P < 0.05, significant change in ID‐1 expression in differentiated cells compared to non‐differentiated cells. Western blot shows representative of blots conducted on n = 3 experimental days. (B) Phase contrast images of non‐differentiated, ATRA‐ and butyrate‐differentiated B35 cells are shown. (C) Non‐differentiated and differentiated B35 cells were stained with actin stain (Alexa Fluor 488 phalloidin) and nuclear stain Hoechst 33342 to highlight the neurite outgrowths.
Figure 3
Figure 3
RSI on the Flexcell Tension System. B35 cells were differentiated by exposure to ATRA (10 μM) on flexible silicon‐rubber HT Bioflex culture plates. The cells were subjected to RSI (circumferential elongation) by applying vacuum pulse (−20 to −80 kPa) controlled by the Flexcell Tension System using sine wave regimens. (A) The registered pressure changes and respective elongation values are shown. (B) LDH release, measured in the supernatant 2 h post‐injury. (C, D) Cell viability (C) and LDH release (D), measured 24 h after the stretch injury. Significantly reduced viability and increased LDH release was measured in cells subjected to the most intense strain (−80 kPa pressure, 14% elongation). Data are shown as mean ± SEM, n = 5. *P < 0.05, significant differences in LDH release 24 h after RSI compared to control cells not subjected to stretch injury.
Figure 4
Figure 4
RSI induces delayed cell death in ATRA‐differentiated B35 cells. Neural cells were grown on HT Bioflex culture plates and B35 (A) and SH‐SY5Y (C) cells were differentiated by exposure to ATRA or butyrate, RN33B cells (B) by exposure to 39°C in serum‐free B16 or DMEM/F12 medium. The cells were exposed to stretch injury (−80 kPa, 2 s) on the Flexcell Tension System and the cell death was also confirmed by measuring the LDH release in the cell culture supernatant 2, 48 and 72 h after the injury. Cell viability was measured by the MTT viability assay and by quantification of the ATP content of the cells 48 and 72 h following the initial injury. Data are shown as mean ± SEM, n = 5. *P < 0.05, significant injury (increased LDH release, decreased MTT conversion or decreased ATP content) compared with the respective control cells not subjected to stretch injury.
Figure 5
Figure 5
Oxidative stress augments the RSI‐induced cell death in ATRA‐differentiated B35 cells. ATRA‐differentiated B35 cells were subjected to stretch injury (−80 kPa, 2 s) and subsequently treated with H2O2 (50 μM). (A) Cell injury was detected by measuring the LDH release into the supernatant from samples collected prior to and following the stretch injury (0.5, 2 and 24 h). H2O2 significantly potentiates the cytotoxic action of the stretch. The combination of RSI (30 cycles, 0.67 Hz, −80 kPa) and oxidative stress (50 μM H2O2) is henceforth referred to as an ‘in vitro TBI injury model’. Data are shown as mean ± SEM, n = 5. *P < 0.05, significant injury by the combination of RSI and oxidative stress. B: Expression level of α‐smooth muscle actin (SMA), detected by Western blotting, at various time points after stretch injury. Western blot shows representative of blots conducted on n = 3 experimental days.
Figure 6
Figure 6
Protein up‐ and down‐regulation in response to the in vitro TBI model in B35 cells. (A) Of 4093 proteins identified in all B35 samples, 3.9% (159) were up‐regulated and 3.2% (131) were down‐regulated in TBI conditions – a combination of RSI (30 cycles, 0.67 Hz, −80 kPa) and oxidative stress (50 μM H2O2) – relative to either differentiated alone or undifferentiated cells. (B) Of the TBI up‐regulated proteins, partial up‐regulation was attributable to differentiation in four cases, and differentiation alone induced down‐regulation of 109 proteins, while the last 46 proteins were unaffected by the process of differentiation and up‐regulated solely due to TBI. (C) Of the TBI down‐regulated proteins, partial down‐regulation was attributable to differentiation in 28 cases, and differentiation alone induced up‐regulation of 91 proteins, whereas the last 76 were unaffected by the process of differentiation and were down‐regulated solely due to TBI. (D) Functional classification of the proteins that were up‐ or down‐regulated by the in vitro TBI model.
Figure 7
Figure 7
Results of the medium‐throughput screen using the in vitro TBI model. (A) B35 cells were differentiated through a combination of serum deprivation and chemical induction with 10 μM ATRA media supplement. At the fifth day of differentiation, cells were subjected to the in vitro TBI model: a combination of RSI (30 cycles, 0.67 Hz, −80 kPa) and oxidative stress (50 μM H2O2). Test compounds were applied 1 h later at a final concentration of 3 μM. Baseline and 24 h endpoint measures were used to assess the ‘neuroprotective character’ of drugs in the screen. (B) Injured and vehicle‐treated controls were assessed to provide LDH and MTT score cut‐offs of MeanCTL,LDH‐3SDCTL and MeanCTL,MTT + 3SDCTL, which corresponded to LDH score = 143.7 and MTT score = 126.5. The scatter plot above shows Z scores within the screening data set generated such that the control‐derived cut‐offs fell along Z = 1.011 for the MTT axis and Z = −0.995 for the LDH axis. This revealed 223 compounds that satisfied the MTT requirement and 54 compounds satisfying the LDH requirement. The overlap of these two regions identified six compounds (rifampicin, indapamide, captopril, etoposide, cephadrine and D‐camphor) that were designated as potential ‘hit compounds’ and were subjected to follow‐up studies.
Figure 8
Figure 8
Dose‐responses: effect of the six potential compounds (rifampicin, indapamide, captopril, etoposide, cephadrine and D‐camphor) identified in the in vitro TBI model on LDH release in differentiated B35 cells. Drugs were applied at 1 h after in vitro TBI. Data are shown as mean ± SEM, n = 5.
Figure 9
Figure 9
Rifampicin reduces the percentage of late apoptotic and necrotic cell population after in vitro TBI in differentiated B35 cells and improves bioenergetic parameters. (A) Treatment with increasing concentrations of rifampicin (10 to 100 μM, applied at 1 h post in vitro TBI) produced a reduction in the percentage of apoptotic cells detected by flow cytometry. Results of a representative flow cytometry experiment are shown. (B) Rifampicin protects against the in vitro TBI induced impairment in bioenergetic parameters, assessed by Extracellular Flux Analysis, in differentiated B35 cells. Data are shown as mean ± SEM, n = 5. *P < 0.05, significant deleterious effect of the in vitro TBI challenge compared to control (non‐TBI subjected) neurons; #P < 0.05, significant protective effect of rifampicin on the indicated bioenergetic parameters.
Figure 10
Figure 10
Protection of rifampicin against RSI in human neural stem cell‐derived neurons. (A) One day after a RSI with or without rifampicin pretreatment, cells were stained with Fluro‐Jade C (green). (B) Four days after injury, neurons were labelled by TuJ‐1 antibody (red). Veh: vehicle control. Scale bars, 20 μm. Blue, DAPI nuclear counterstain. Data are shown as mean ± SEM, n = 5. *P < 0.05, significant differences between the indicated groups.

References

    1. Abdul‐Muneer PM, Chandra N, Haorah J (2015). Interactions of oxidative stress and neurovascular inflammation in the pathogenesis of traumatic brain injury. Mol Neurobiol 51: 966–979. - PMC - PubMed
    1. Arundine M, Aarts M, Lau A, Tymianski M (2004). Vulnerability of central neurons to secondary insults after in vitro mechanical stretch. J Neurosci 24: 8106–8123. - PMC - PubMed
    1. Bell JD, Park E, Ai J, Baker AJ (2009). PICK1‐mediated GluR2 endocytosis contributes to cellular injury after neuronal trauma. Cell Death Differ 16: 1665–1680. - PubMed
    1. Biagini G, Zoli M, Torri C, Boschi S, Vantaggiato G, Ballestri M et al. (1997). Protective effects of delapril, indapamide and their combination chronically administered to stroke‐prone spontaneously hypertensive rats fed a high‐sodium diet. Clin Sci (Lond) 93: 401–411. - PubMed
    1. Bramlett HM, Dietrich WD (2007). Progressive damage after brain and spinal cord injury: pathomechanisms and treatment strategies. Prog Brain Res 161: 125–124. - PubMed

Publication types

MeSH terms

Substances

LinkOut - more resources