. 2016 Nov;18(11):1185-1195.
doi: 10.1038/ncb3415. Epub 2016 Oct 10.

ETAA1 acts at stalled replication forks to maintain genome integrity

Affiliations

ETAA1 acts at stalled replication forks to maintain genome integrity

Thomas E Bass et al. Nat Cell Biol. 2016 Nov.

Abstract

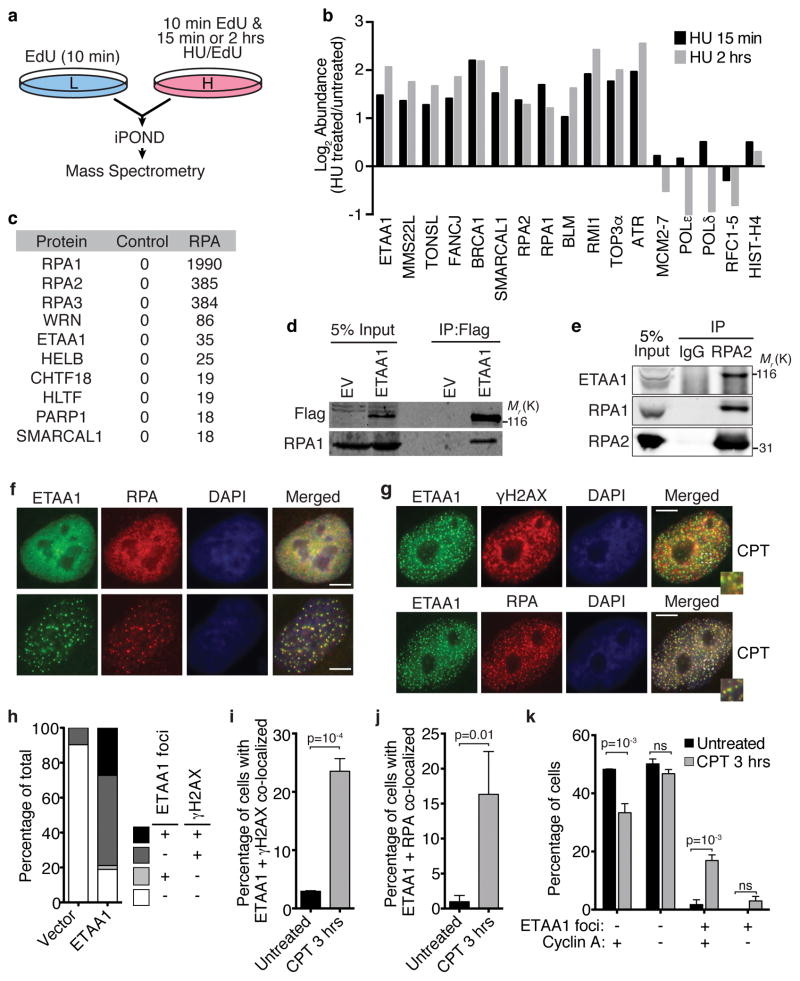
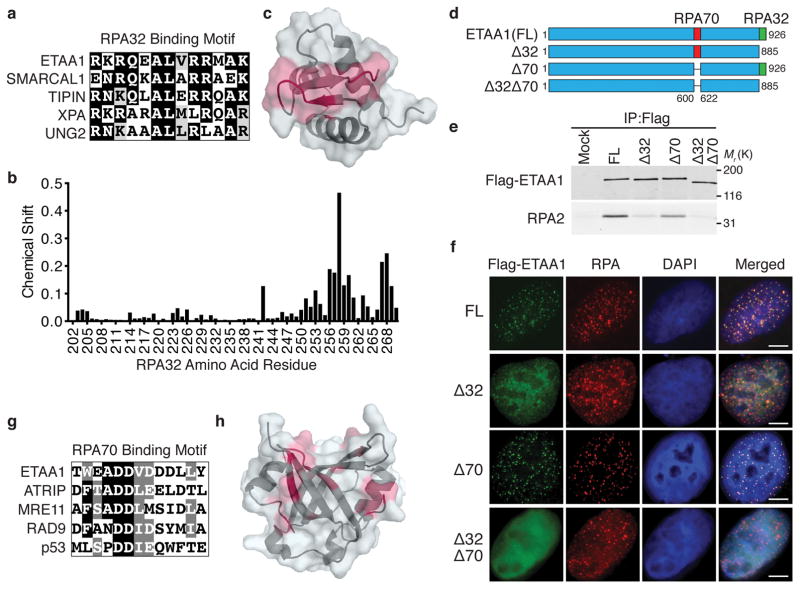
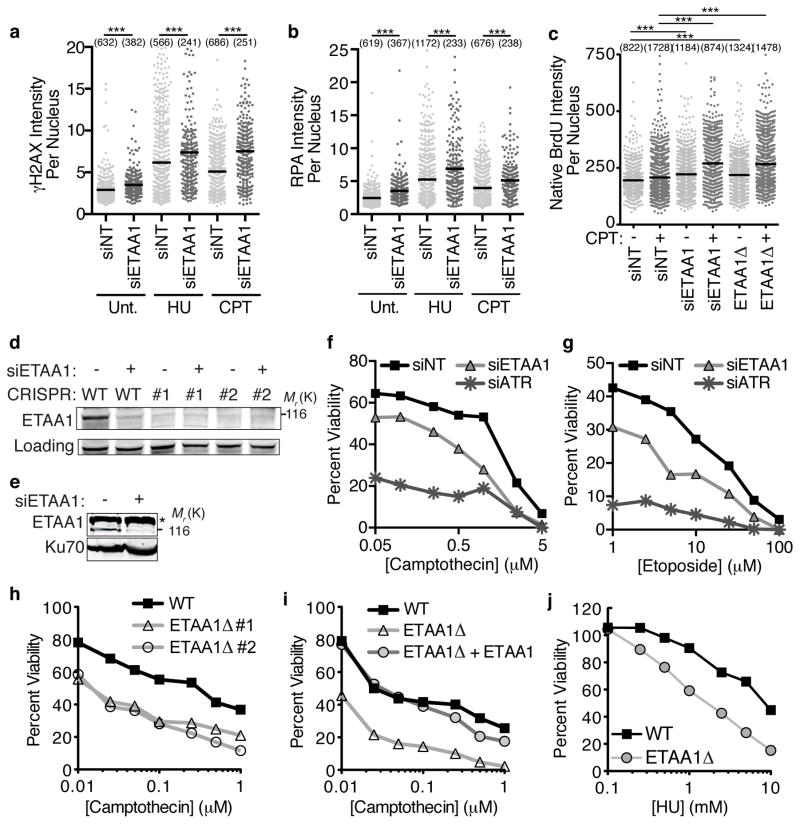
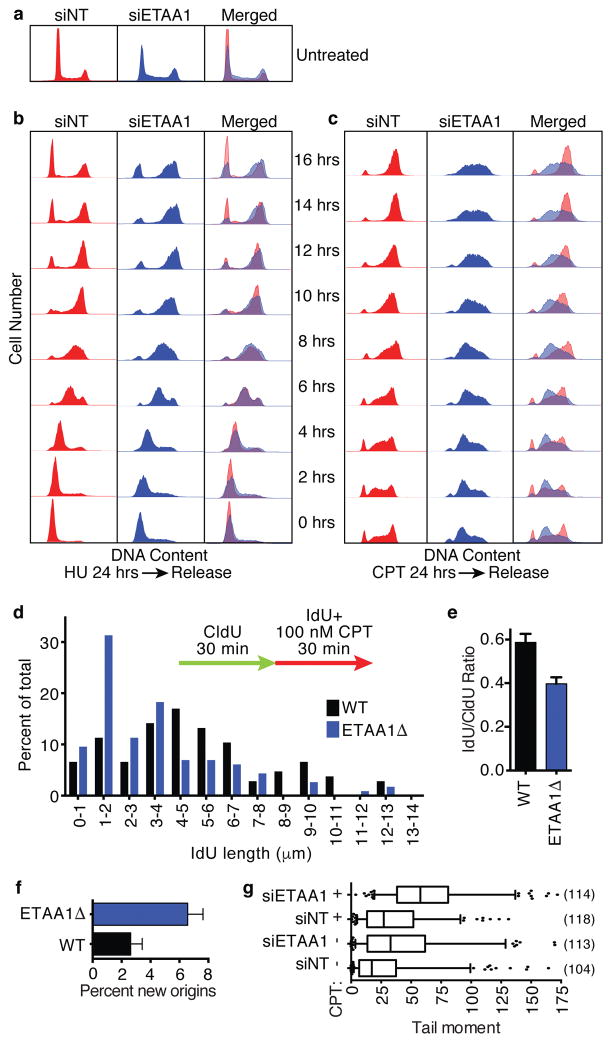
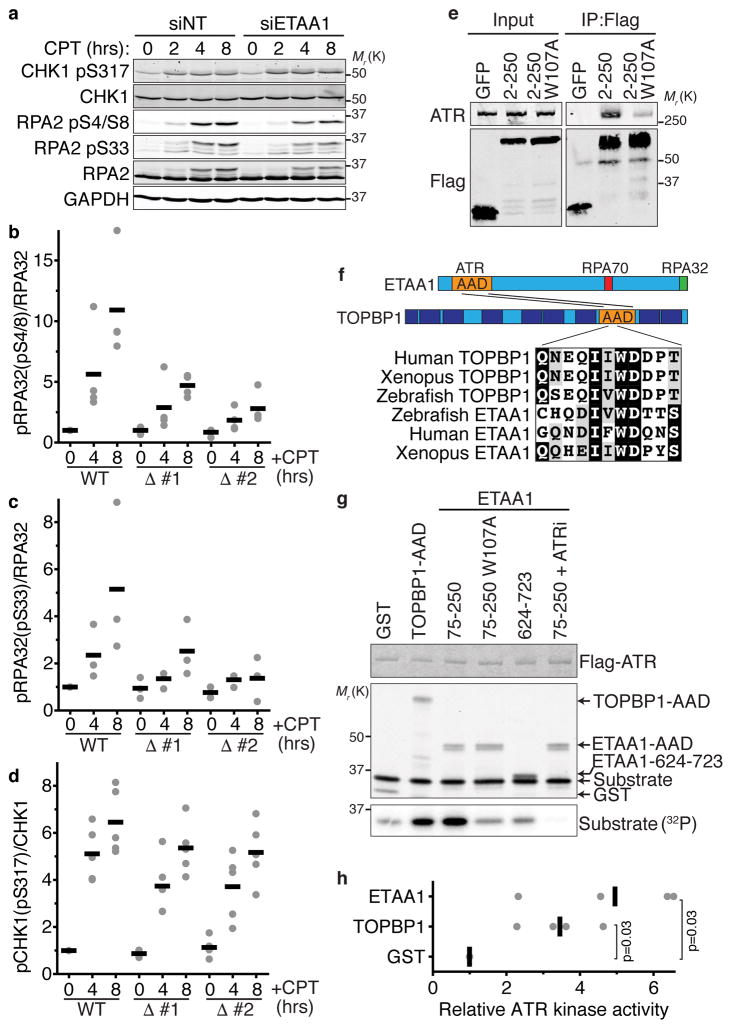
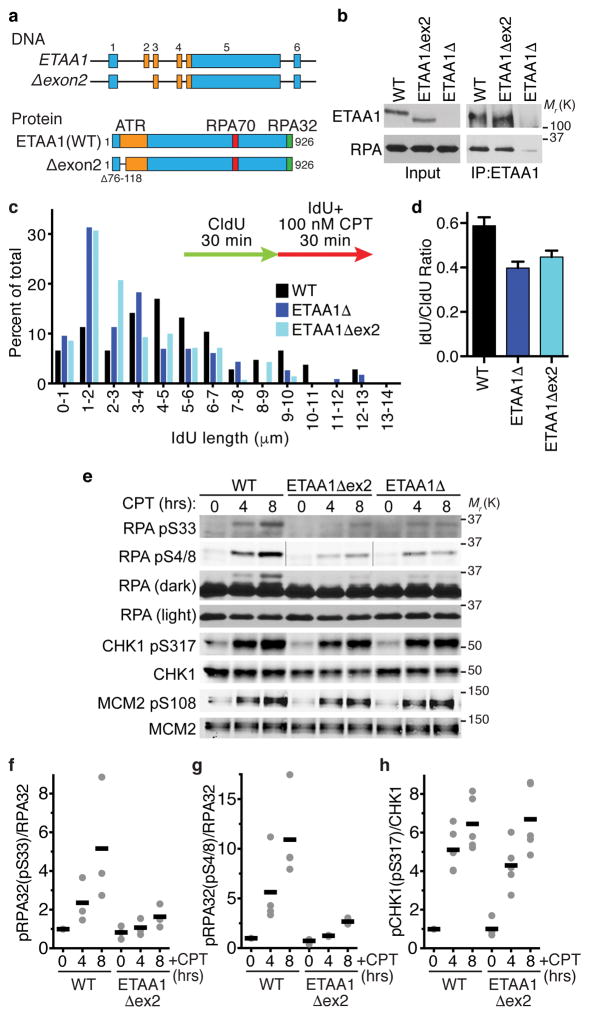
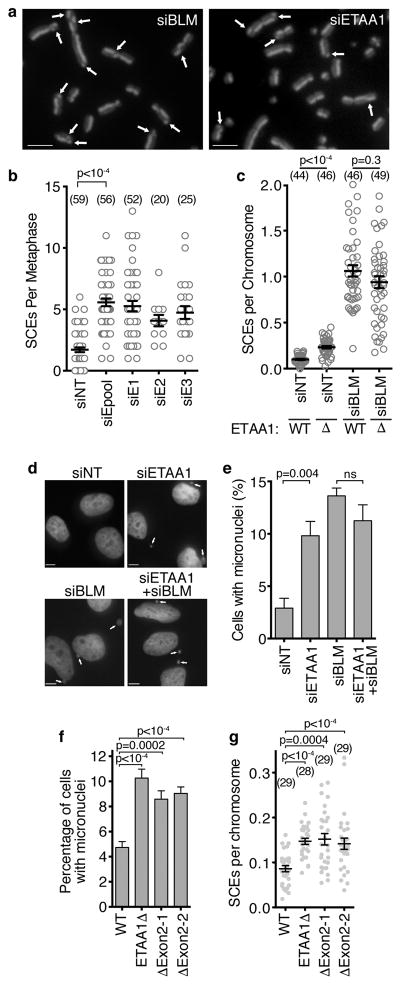
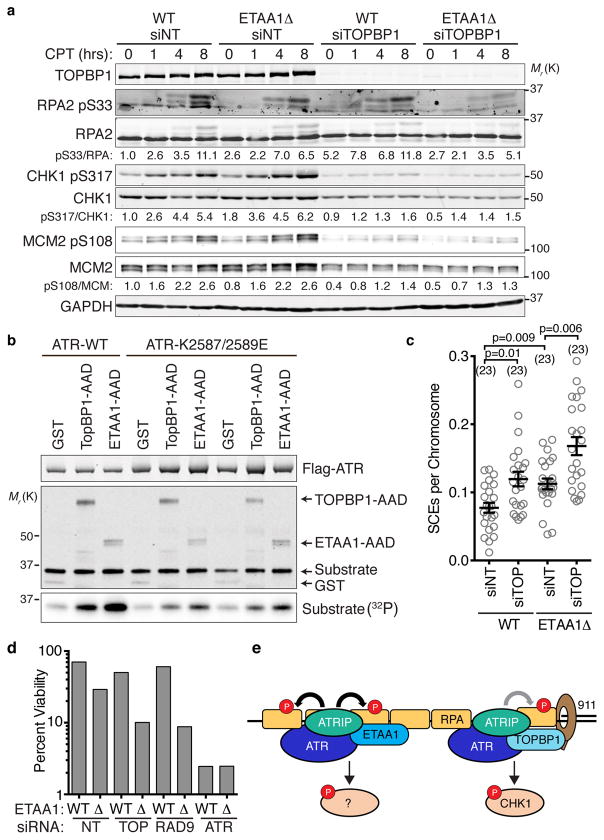
The ATR checkpoint kinase coordinates cellular responses to DNA replication stress. Budding yeast contain three activators of Mec1 (the ATR orthologue); however, only TOPBP1 is known to activate ATR in vertebrates. We identified ETAA1 as a replication stress response protein in two proteomic screens. ETAA1-deficient cells accumulate double-strand breaks, sister chromatid exchanges, and other hallmarks of genome instability. They are also hypersensitive to replication stress and have increased frequencies of replication fork collapse. ETAA1 contains two RPA-interaction motifs that localize ETAA1 to stalled replication forks. It also interacts with several DNA damage response proteins including the BLM/TOP3α/RMI1/RMI2 and ATR/ATRIP complexes. It binds ATR/ATRIP directly using a motif with sequence similarity to the TOPBP1 ATR-activation domain; and like TOPBP1, ETAA1 acts as a direct ATR activator. ETAA1 functions in parallel to the TOPBP1/RAD9/HUS1/RAD1 pathway to regulate ATR and maintain genome stability. Thus, vertebrate cells contain at least two ATR-activating proteins.


Conflict of interest statement

The authors have no competing financial interests.

Figures

Figure 1
Figure 1. ETAA1 is enriched at stalled replication forks and interacts with RPA
(a,b) HEK293T cells grown in heavy isotope media and incubated with EdU and HU were compared to EdU-labeled cells grown in light isotope media. Replication fork proteins were isolated and detected by iPOND and mass spectrometry. (b) The log2 of the average abundance ratio for selected proteins or complexes is depicted. The full iPOND-MS dataset is presented elsewhere. (c) Flag-RPA1 was immunopurified from HEK293T nuclear extracts and interacting proteins were identified by mass spectrometry. The table indicates the number of peptides identified for each protein. The control sample was an immunopurification from untransfected cells. The mass spectrometry experiment was performed once. (d) HEK293T cells were transfected with a Flag-ETAA1 or empty expression vector (EV), and nuclear extracts used for immunoprecipitation with Flag antibodies. Immunoprecipitates were immunoblotted with the indicated antibodies after separation by SDS-PAGE. Representative blots from one of five independent experiments are shown. (e) Nuclear extracts from HEK293T cells were used for immunoprecipitation with RPA2 or control IgG antibodies followed by immunoblotting. Representative blots from one of two independent experiments are shown. (f–h) U2OS cells were transiently transfected with a Flag-ETAA1 expression vector and stained and imaged for Flag-ETAA1, RPA, and γH2AX. Scale bars are 5 μm. In (g) cells were treated with 100 nM camptothecin (CPT) for 3 hrs. (i–k) Stable cell lines expressing GFP-Flag-ETAA1 were sorted by flow cytometry to select the 10% of cells expressing the lowest levels, stained for Flag-ETAA1, RPA, γH2AX, and cyclin A as indicated, and scored for focal co-localization before and after treatment with 100 nM CPT. Error bars are SEM from n=3 experiments; student’s, two-tailed, unpaired t-test. Unprocessed original scans of blots in d and e are shown in Supplementary Fig. 8 and source data for i–k are available in Supplemental Table 1.
Figure 2
Figure 2. ETAA1 interacts with RPA through the RPA32C and RPA70N domains
(a) Sequence alignment of ETAA1900–912 with the RPA32C binding motif of other RPA32C-interacting proteins. (b) Plot of RPA32C chemical shift perturbations induced by the binding of the ETAA1 peptide calculated from 15N-1H HSQC NMR spectra of 15N-labeled RPA32C obtained in the absence and presence of peptide. (c) Map of RPA32C residues with chemical shift perturbations greater than one standard deviation (SD) above the mean (red) on the structure of RPA32C (PDBID 4OU0). (d) Schematic diagram of ETAA1 mutants examined in e and f. (e) Nuclear extract from HEK293T cells mock transfected or transfected with ETAA1 expression constructs were used for immunoprecipitation with Flag antibodies; FL, full length. Immunoprecipitates were immunoblotted with Flag or RPA2 antibodies. (f) U2OS cells were transfected with the indicated ETAA1 expression vectors and treated with 100 nM CPT for 3 hrs prior to examining ETAA1 and RPA localization. Scale bars are 5 μm. (g) Sequence alignment of ETAA1599–611 with the RPA70N-interaction motif of other RPA70N-interacting proteins. (h) Map of RPA70N residues with chemical shift perturbations greater than one SD above the mean (red) on the structure of RPA70N (PDBID 2B29) calculated from NMR 15N-1H HSQC spectra of 15N-labeled RPA70N obtained in the absence and presence of ETAA1 peptide. Unprocessed original scans of blots in e are shown in Supplementary Fig. 8. All panels are representative of two experiments.
Figure 3
Figure 3. Loss of ETAA1 results in increased DNA damage and sensitivity to DNA damaging agents
(a,b) U2OS cells transfected with non-targeting (NT) or ETAA1 siRNAs were left untreated (Unt), or treated with 2 mM HU or 100 nM CPT for 3 hrs. Soluble proteins were extracted with detergent prior to fixation. γH2AX and RPA intensity were quantified by immunofluorescence imaging. (c) U2OS cells transfected with siRNA or ETAA1Δ U2OS cells were labeled with BrdU for 24 hrs and then treated with CPT for 3 hrs as indicated. Cells were fixed and stained with BrdU antibodies in non-denaturing conditions to measure ssDNA levels. In a–c the intensity of each nucleus and mean intensity from a representative experiment of at least two independent experiments is shown... Significance was determined by the Mann-Whitney test. ***p<0.001 The numbers avove each sample indicates the n value, which represents the number of nuclei imaged. (d) Immunoblot to confirm ETAA1 siRNA knockdown and gene deletion. A cross-reacting protein that migrates at a similar position as ETAA1 is observed in some ETAA1 immunoblots. (e) Nuclear extracts were prepared from U2OS cells transfected with pooled ETAA1 siRNAs and ETAA1 was detected by immunoblotting after SDS-PAGE. Star denotes cross-reacting protein. (f–g) U2OS cells were transfected with NT, ETAA1, or ATR siRNAs and treated with CPT or etoposide for 24 hrs. Viability compared to untreated cells was measured 72 hrs after initial addition of drug. Untreated cell viability was set at 100%. (h–j) Wild-type or ETAA1Δ U2OS cells were treated with CPT or HU for 24 hrs and viability was measured as in f and g. In i ETAA1Δ cells stably expressing wild type ETAA1 were also examined. In all viability assays, the mean viability from three technical replicates of a representative experiment is graphed. Three biological replicates were completed for all panels except h, which was repeated twice. Unprocessed original scans of blots in d are shown in Supplementary Fig. 8 and source data for a,c,b,f,g,h,i, and j are in Supplemental Table 1.
Figure 4
Figure 4. ETAA1 is needed to recover from replication stress
(a–c) U2OS cells were transfected with non-targeting or ETAA1 siRNAs and left untreated (a) or challenged with 2 mM HU (b) or 100 nM CPT (c) for 24 hrs. After 24 hrs, drug was removed and samples were collected every 2 hrs for 16 hrs. Collected cells were fixed, stained with propidium iodide, and DNA content was measured by flow cytometry. Data is representative of two experiments. (d–e) Wild-type or ETAA1 knockout cells were labeled with CldU and IdU and treated with 100 nM CPT as indicated during the second labeling period. DNA fibers stretched on a microscope slide were stained with IdU and CldU antibodies, imaged, and the lengths of fiber tracks measured. n=107 and 116 fibers for WT and ETAA1Δ respectively. One of two biological replicates is shown. (f) The percent of new origins (red only fibers) were also quantitated. n=500 fibers for WT and 508 fibers for ETAA1Δ. (g) U2OS cells transfected with non-targeting or ETAA1 siRNAs and left untreated or treated with 1 μM CPT for 1 hr were subjected to a neutral comet assay to measure double-strand breaks. The box depicts 25–75%, whiskers are 5–95%, and the line is the median value. The numbers of comets measured (n values) from one of two independent experiments are indicated. Source data for d,e,f and g is in Supplemental Table 1.
Figure 5
Figure 5. ETAA1 activates ATR
(a) U2OS cells transfected with non-targeting or ETAA1 siRNAs or (b–d) wild-type and two ETAA1Δ HEK293T cell clones were treated with 100 nM CPT for 2, 4, or 8 hrs. Cell lysates were separated by SDS-PAGE and immunoblotted with the indicated antibodies. The blots in a are representative of two experiments. (b–d) The amount of phosphorylated versus total RPA and CHK1 from n=4, 3, and 5 experiments in b, c, and d respectively is shown. Black bars are the mean. (e) Immunoprecipitates of GFP-Flag-NLS-tagged ETAA1 fragments expressed in HEK293T cells were immunoblotted for Flag and ATR. Representative blots from one of two independent experiments are shown. (f) Schematic diagram of the ETAA1 protein indicating the ATR-interacting domain and evolutionarily conserved sequence similarity with the TOPBP1-AAD. (g) Purified ATR/ATRIP complexes were incubated with GST-TOPBP1 or ETAA1 proteins purified from E. coli, substrate, and γ-32P-ATP. The kinase reactions were separated by SDS-PAGE prior to immunoblotting or quantitating substrate phosphorylation by phosphorimaging. ATRi, ATR inhibitor. (h) ATR kinase activity relative to the control reaction of n=4 independent experiments is graphed. Significance was calculated with the Mann-Whitney test. Unprocessed original scans of blots in a, e and g are shown in Supplementary Fig. 8, and source data for b, c, d, and h is provided in Supplemental Table 1.
Figure 6
Figure 6. The ETAA1 ATR activation domain is needed to maintain fork stability and promote ATR signaling
(a) Schematic of the ETAA1Δexon2 gene and protein. (b) ETAA1 immunoprecipitates from wild-type, ETAA1Δ, and ETAA1Δexon2 cells were immunoblotted for ETAA1 and RPA. Data are representative of two experiments. (c–d) Cells were labeled with CldU and IdU and treated with 100 nM CPT during the second labeling period. DNA fibers stretched on a microscope slide were stained with IdU and CldU antibodies, imaged, and the lengths of fiber tracks measured. n=107, 116, and 105 fibers for WT, ETAA1Δ, and ETAA1Δexon2 respectively. One of two biological replicates is shown. (e–h) Wild-type, ETAA1Δ, and ETAA1Δexon2 HEK293T cells were treated with 100 nM CPT for 0, 4, or 8 hrs. Cell lysates were immunoblotted for phosphorylated and total RPA and CHK1. Black bars are the mean from n=3, 4, and 5 experiments in f, g, and h respectively. The wild-type and ETAA1Δ data presented in panels c and d of this figure are the same as in figure 4 since the wild-type, ETAA1Δ, and ETAA1exon2 cells were compared in the same experiments. Unprocessed original scans of blots in b and e are shown in Supplementary Fig. 8, and source data for c,d,f,g, and h are provided in Supplemental Table 1
Figure 7
Figure 7. ETAA1 deficient cells have elevated sister chromatid exchanges and genetic instability
(a–b) SCEs were imaged and scored after ETAA1 knockdown. Scale bars are 5 μm. Four eperiments were performed for siNT and siEpool and one experiment was completed for the other siRNAs. Mean and SEM from a representative experiment is shown and significance calculated by ANOVA with a Dunnett multiple comparison post-test. The number of metaphases analyzed (n value) is indicated. (c) SCEs were scored in wild-type or ETAA1Δ U2OS cells transfected with non-targeting or BLM siRNAs. Data are representative from three independent experiments and significance was calculated with a Mann-Whitney test. The number of metaphases (n value) is indicated. (d,e) Micronuclei were imaged and scored in U2OS cells transfected with non-targeting, ETAA1, or BLM siRNAs as indicated. Data are mean and SD of n=3 independent experiments. Scale bar is 5 μm. (f) Micronuclei and (g) SCEs were scored in wild-type, ETAA1Δ, and two independent ETAA1Δexon2 U2OS cell clones. Mean, SEM, and number of metaphases analyzed (n value) is presented. Significance in e, f and g was determined by ANOVA with a Dunnett multiple comparison post-test. Source data for b,c,e,f, and g are provided in Supplemental Table 1.
Figure 8
Figure 8. ETAA1 and TOPBP1 act in separate pathways to regulate ATR and maintain genome stability
(a) Wild-type or ETAA1Δ U2OS cells were transfected with non-targeting or TOPBP1 siRNAs, treated with 100 nM CPT for the indicated times, lysed, and immunoblotted with the indicated antibodies. Blots are representative of two experiments. (b) Purified wild-type or mutant ATR/ATRIP complexes were incubated with GST or the AAD domains of TOPBP1 or ETAA1 in the presence of substrate and γ-32P-ATP. The kinase reactions were separated by SDS-PAGE prior to immunoblotting or quantitating substrate phosphorylation by phosphorimaging. Two independent replicates of the mutant ATR kinase reactions are shown. (c) SCEs in wild-type or ETAA1Δ U2OS cells transfected with non-targeting or TOPBP1 siRNAs were quantitated. Error bars are SEM and significance was calculated with a Mann-Whitney test. The number of metaphases scored (n value) is indicated. (d) Cells transfected with non-targeting, TOPBP1, RAD9, or ATR siRNAs were challenged with 10 nM CPT for 24 hrs and viability was determined by clonogenic assay. Untreated viability was set at 100%. Bars indicate the mean of three technical replicates from a representative experiment of two independent experiments (e) Simplified model of ATR activation by ETAA1 and TOPBP1. The 911 complex stabilizes TOPBP1 at stalled forks and assists in the TOPBP1-dependent activation pathway. ETAA1 is recruited directly by RPA and functions independently of 911 and TOPBP1 to activate ATR. Unprocessed original scans of blots in a and b are shown in Supplementary Fig. 8, and source data for c and d are provided in Supplemental Table 1.

References

    1. Ciccia A, Elledge SJ. The DNA damage response: making it safe to play with knives. Mol Cell. 2010;40:179–204. - PMC - PubMed
    1. Zeman MK, Cimprich KA. Causes and consequences of replication stress. Nat Cell Biol. 2014;16:2–9. - PMC - PubMed
    1. Fanning E, Klimovich V, Nager AR. A dynamic model for replication protein A (RPA) function in DNA processing pathways. Nucleic Acids Res. 2006;34:4126–37. - PMC - PubMed
    1. Zou L, Elledge SJ. Sensing DNA damage through ATRIP recognition of RPA-ssDNA complexes. Science. 2003;300:1542–8. - PubMed
    1. Ball HL, Myers JS, Cortez D. ATRIP Binding to Replication Protein A-Single-stranded DNA Promotes ATR – ATRIP Localization but Is Dispensable for Chk1. Phosphorylation. 2005;16:2372–2381. - PMC - PubMed

MeSH terms