. 2016 Nov;22(11):1351-1357.
doi: 10.1038/nm.4202. Epub 2016 Oct 10.

Microenvironment-dependent growth of preneoplastic and malignant plasma cells in humanized mice

Affiliations

Microenvironment-dependent growth of preneoplastic and malignant plasma cells in humanized mice

Rituparna Das et al. Nat Med. 2016 Nov.

Abstract

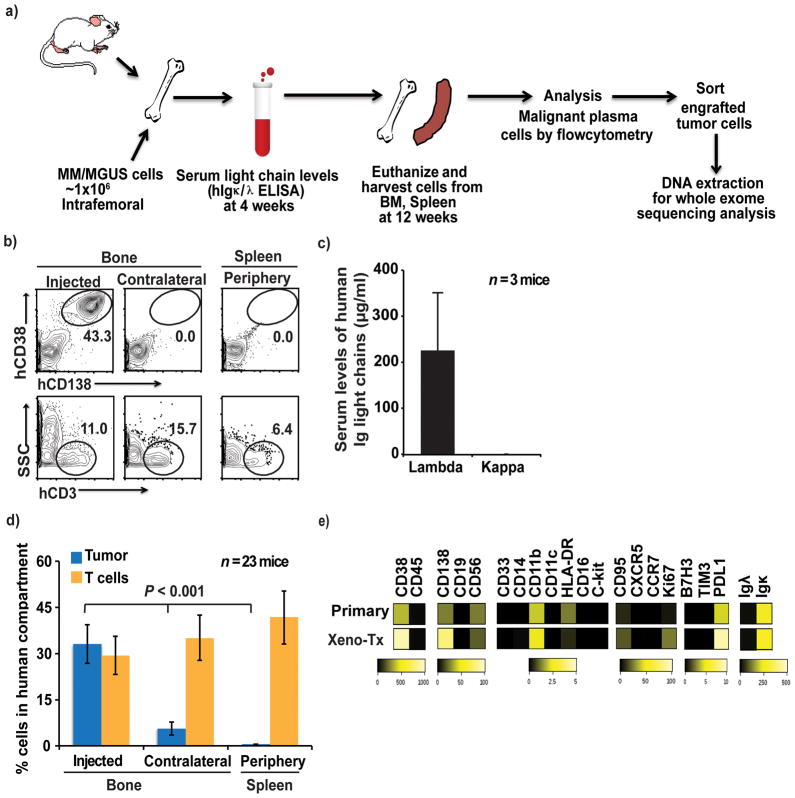
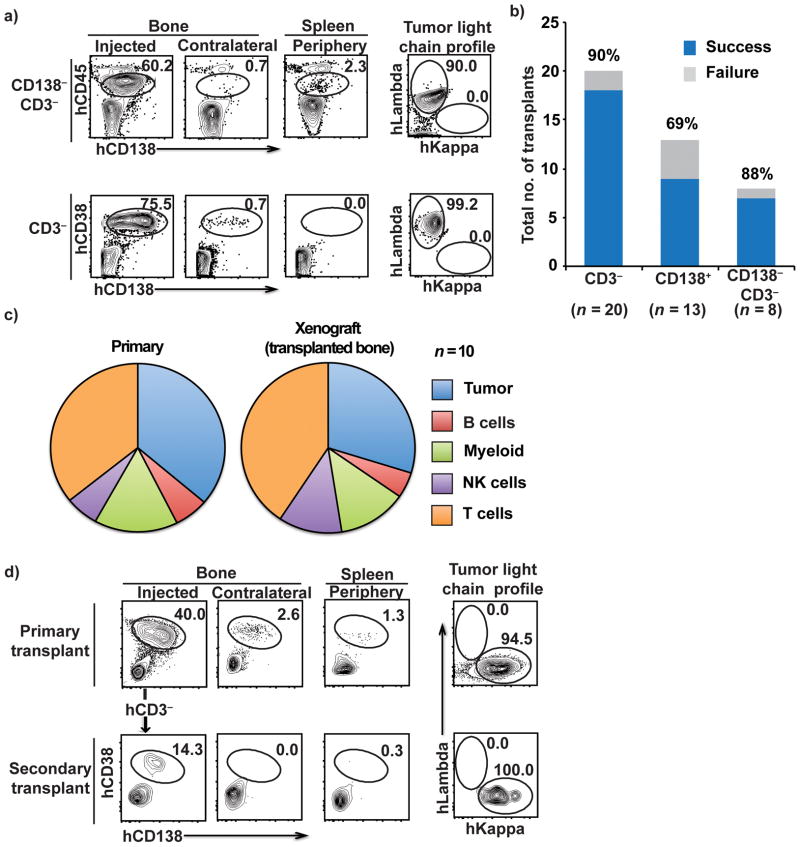
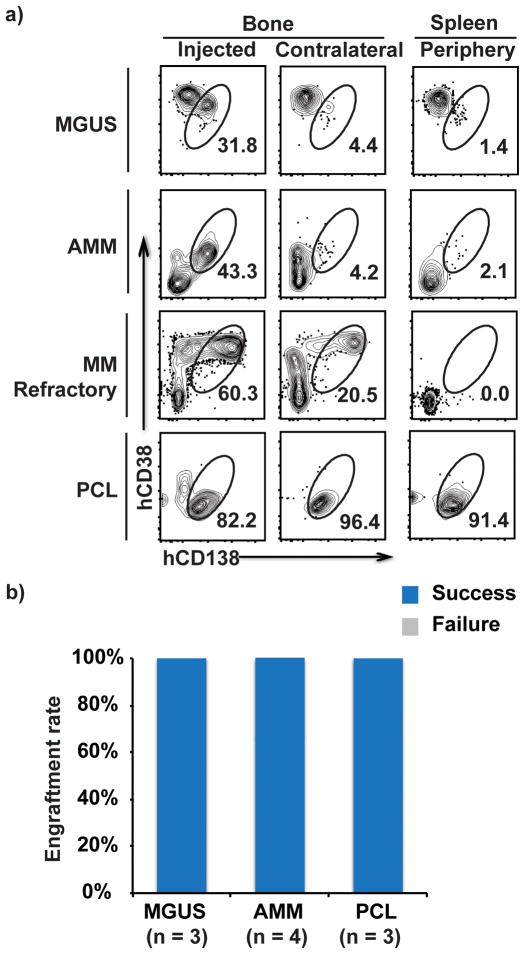
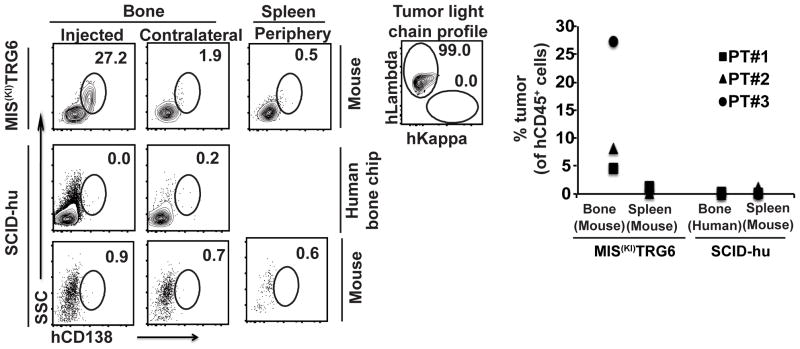
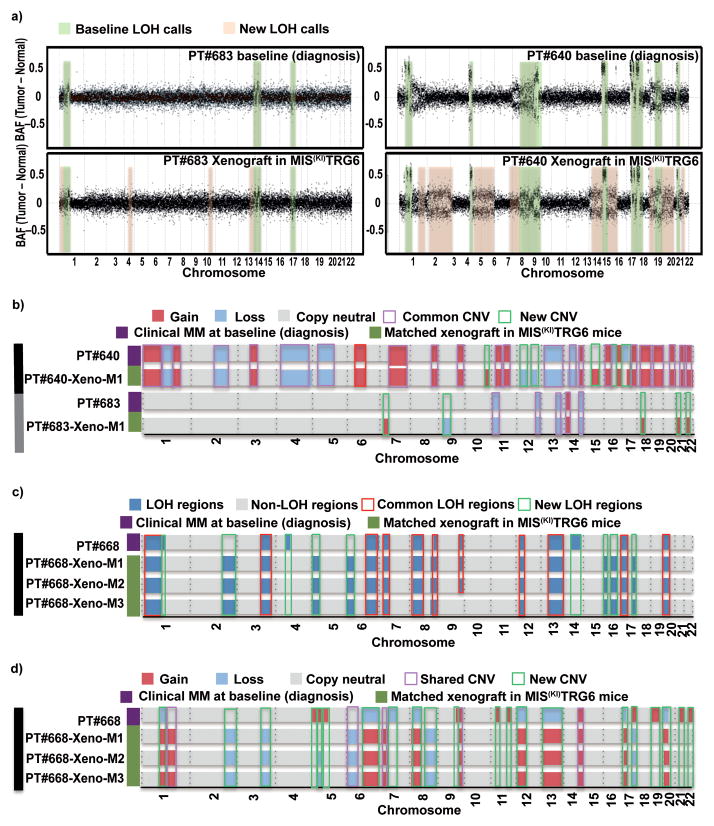
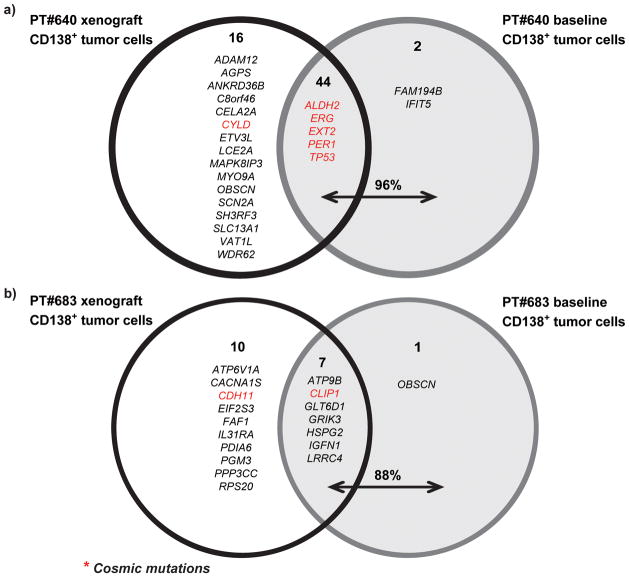
Most human cancers, including myeloma, are preceded by a precursor state. There is an unmet need for in vivo models to study the interaction of human preneoplastic cells in the bone marrow microenvironment with non-malignant cells. Here, we genetically humanized mice to permit the growth of primary human preneoplastic and malignant plasma cells together with non-malignant cells in vivo. Growth was largely restricted to the bone marrow, mirroring the pattern in patients with myeloma. Xenografts captured the genomic complexity of parental tumors and revealed additional somatic changes. Moreover, xenografts from patients with preneoplastic gammopathy showed progressive growth, suggesting that the clinical stability of these lesions may in part be due to growth controls extrinsic to tumor cells. These data demonstrate a new approach to investigate the entire spectrum of human plasma cell neoplasia and illustrate the utility of humanized models for understanding the functional diversity of human tumors.


Figures

Figure 1
Figure 1. Engraftment and phenotype of human plasma cell tumors in MIS(KI)TRG6 mice
1a. Summary of the overall strategy for tumor cell injection into mice and analysis of the mice. BM, bone marrow. 1b. Representative FACS plots showing engraftment of CD138+ primary tumor cells from a patient with multiple myeloma. Tumor (hCD138+hCD38+) and non-tumor (hCD3+) cells were detected in the injected bone, contralateral bone and spleen. 1c. Levels of human light chain-restricted monoclonal antibodies (μg/ml) in mouse sera, detected by ELISA. Data shown are from 3 mice injected with the sample from the patient in Fig 1b. 1d. The percentage of cellular engraftment of tumor cells (hCD138+hCD38+) and T cells (hCD3+) in the human cellular compartment (mCD45-mTer119-) in the injected bone, contralateral bone and spleen. Data shown are summary of data from n=23 mice with samples from 12 patients; ** ≤ .01). 1e. Heat-map for the expression of the indicated proteins by primary tumor cells and xenografted tumor cells as in 1b/1c, as analyzed by mass cytometry. Bars represent expression scales.
Figure 2
Figure 2. Engraftment of different tumor cellular compartments, the spectrum of non-malignant cells that engrafted and the potential for serial transplantation
2a. Tumor engraftment from the CD138− CD3− fraction (top) and hCD3-depleted fractions (bottom) and the intracellular light chain-restricted profiles of the corresponding tumor cells isolated from transplanted mouse bone marrow following injection of MM tumor cells (right). 2b. Success rate for engraftment for each of the cellular compartments transplanted (CD3− depleted, CD138+, and CD138− and CD3-depleted). N refers to numbers of patients. 2c. Spectrum of non-malignant human immune cells in primary tumors and in bone marrow aspirates of xenografted bone The proportions of T, NK, myeloid and B cells were analyzed by mass cytometry. N refers to numbers of patients. 2d. FACS plots showing the presence of CD38+CD138+ tumor cells in the bone following serial transplantation of tumor cells isolated from xenografted tumor. CD3-depleted tumor cells isolated from a primary transplant recipient were reinjected into the bone of secondary recipients. Data are representative of 2 patients with 3 primary recipients and 2–3 secondary recipients
Figure 3
Figure 3. Pattern of tumor cell growth from a spectrum of clonal plasma cell tumors and preneoplastic lesions
3a. Representative FACS plots showing engraftment of primary tumor cells from patients with MGUS, AMM, relapsed MM and PCL in the injected bone, contralateral bone and spleen. In the MGUS plot, the CD138−CD38+ cells were identified as NK cells (data not shown). 3b. Success rate for engraftment of tumor cells from MGUS (n=3), AMM (n=4) and PCL (n=3) samples.
Figure 4
Figure 4. Comparison of the MIS(KI)TRG6 and SCID-hu models for the growth of pre-neoplastic gammopathies
4a. FACS plots showing engraftment of tumor cells following injection of CD3-depleted bone marrow mononuclear cells from MGUS (n=2) and AMM (n=1) samples in MIS(KI)TRG6 and SCID-hu mice was. INA6 cells were utilized as a positive control for growth of MM cells in SCID-hu mice (supplementary fig 3a). 4b. Data for engraftment in individual patients. PT#1-3 are individual patients.
Figure 5
Figure 5. Genomic analysis of tumor cells engrafted in MIS(KI)TRG6 mice
5a. LOH regions in CD138+ parental tumor cells from patients #683 and #640 compared with those isolated from transplanted mice. BAF: B allelic frequencies. 5b. Copy number alterations (CNA) in CD138+ parental tumor cells from patients #640 and #683 compared with those isolated from transplanted mice. 5c and 5d.. Genomic analysis of multiple mice injected with the same tumor. 5c. LOH regions in CD138+ parental tumor cells from patient #668 compared with LOH regions in xenografted tumor cells isolated from 3 independent transplanted mice. 5d. Copy number alterations (CNA) in CD138+ parental tumor cells from patient #668 compared with CNAs in xenografted tumor cells isolated from 3 independent transplanted mice.
Figure 6
Figure 6
Analysis of somatic non-synonymous variants (SNVs) identified in parental tumor cells and those isolated from xenografted mice. The majority of SNVs detected in parental tumors were also found in xenografts. However several additional SNVs were also detected in xenografts.

References

    1. Palumbo A, Anderson K. Multiple myeloma. N Engl J Med. 2010;364:1046–1060. - PubMed
    1. Schuler J, Ewerth D, Waldschmidt J, Wasch R, Engelhardt M. Preclinical models of multiple myeloma: a critical appraisal. Expert Opin Biol Ther. 2013;13(Suppl 1):S111–123. - PubMed
    1. Yaccoby S, Barlogie B, Epstein J. Primary myeloma cells growing in SCID-hu mice: a model for studying the biology and treatment of myeloma and its manifestations. Blood. 1998;92:2908–2913. - PubMed
    1. Calimeri T, et al. A unique three-dimensional SCID-polymeric scaffold (SCID-synth-hu) model for in vivo expansion of human primary multiple myeloma cells. Leukemia. 2011;25:707–711. - PMC - PubMed
    1. Rongvaux A, et al. Human hemato-lymphoid system mice: current use and future potential for medicine. Annu Rev Immunol. 2013;31:635–674. - PMC - PubMed

Publication types