. 2016 Oct 10:2:16185.
doi: 10.1038/nmicrobiol.2016.185.

Whole genome-based population biology and epidemiological surveillance of Listeria monocytogenes

Affiliations

Whole genome-based population biology and epidemiological surveillance of Listeria monocytogenes

Alexandra Moura et al. Nat Microbiol. .

Abstract

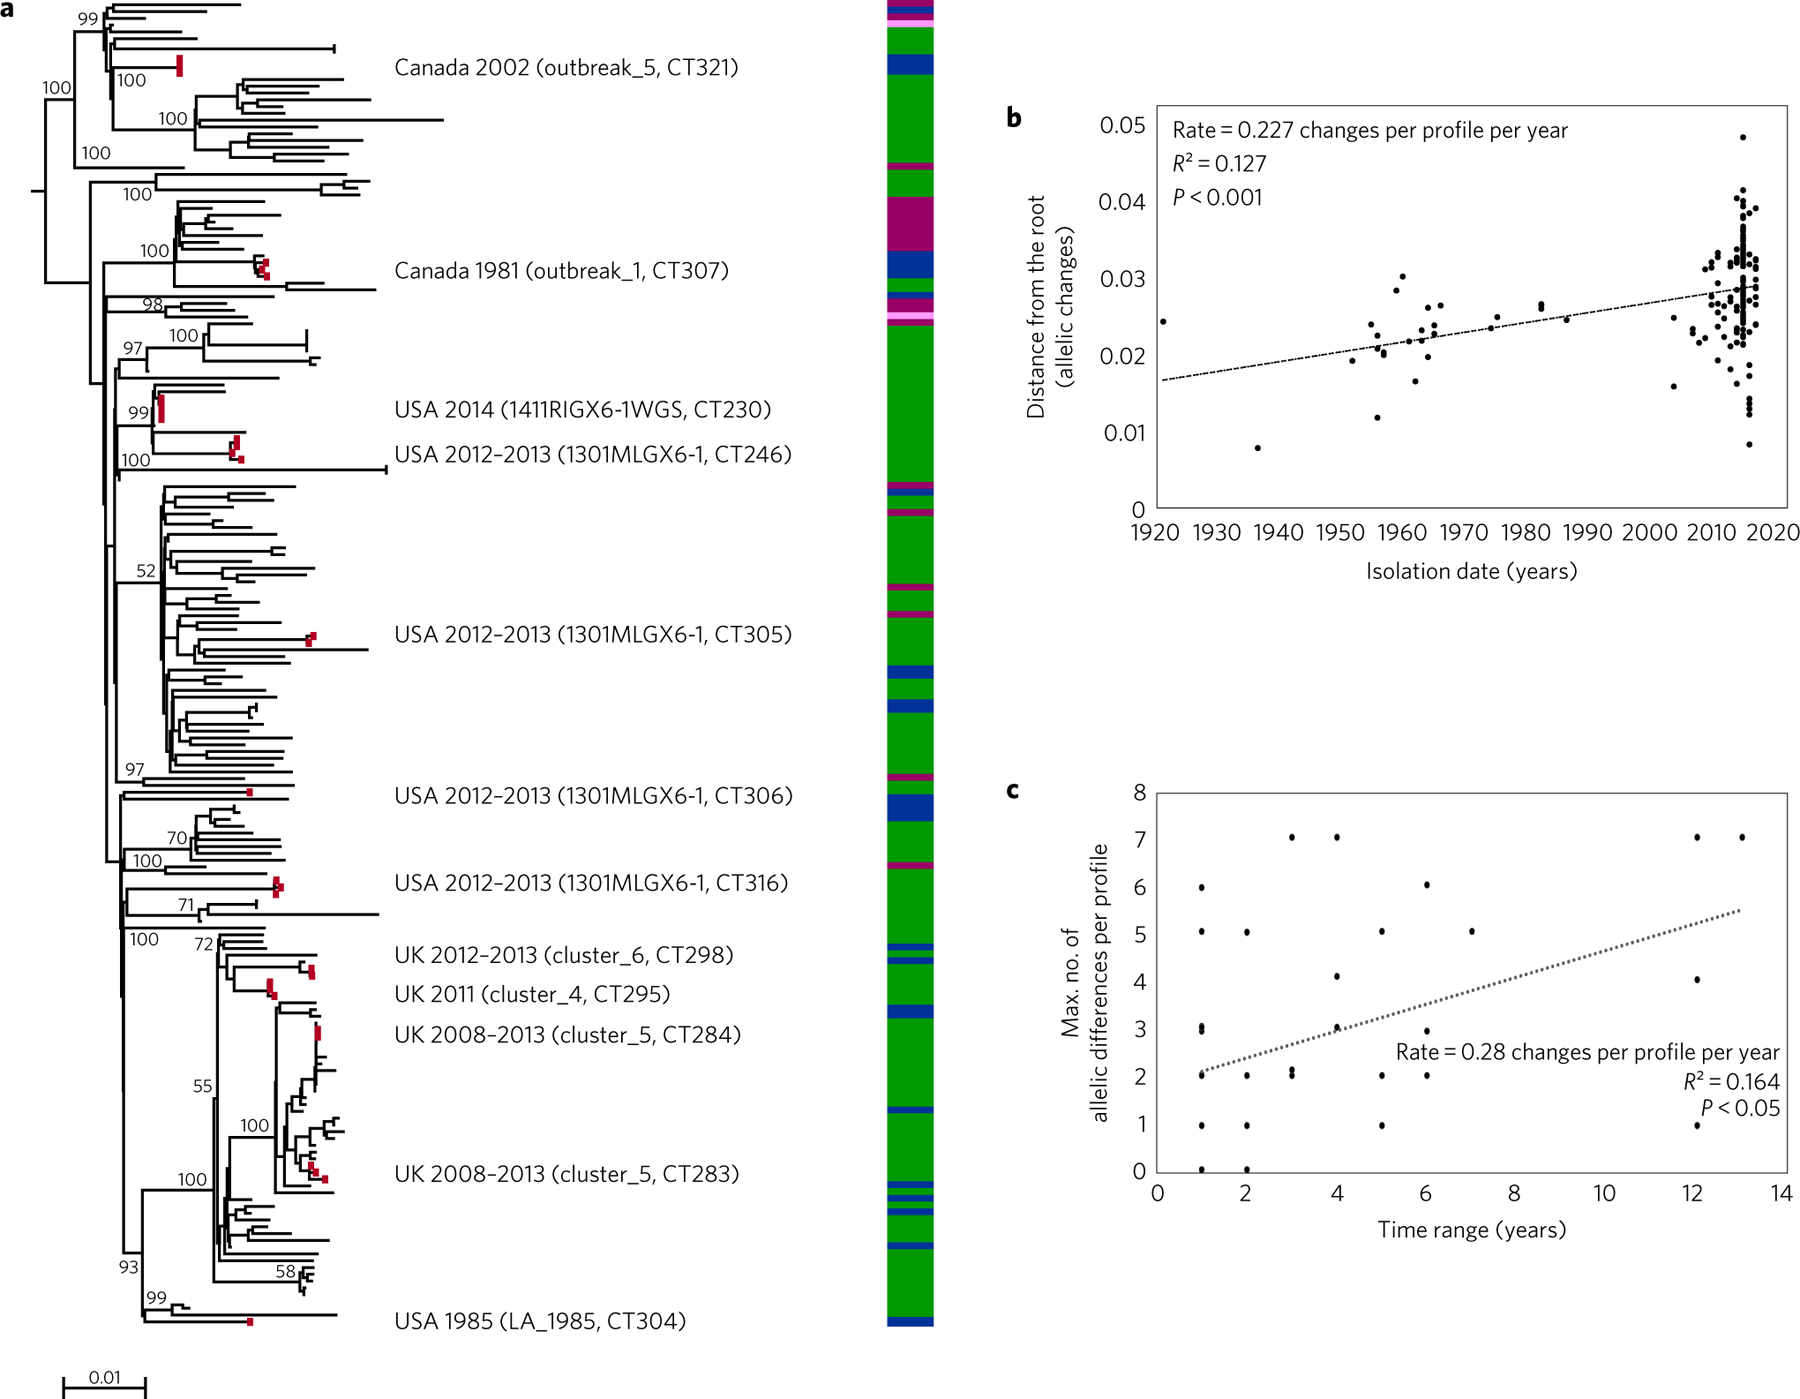
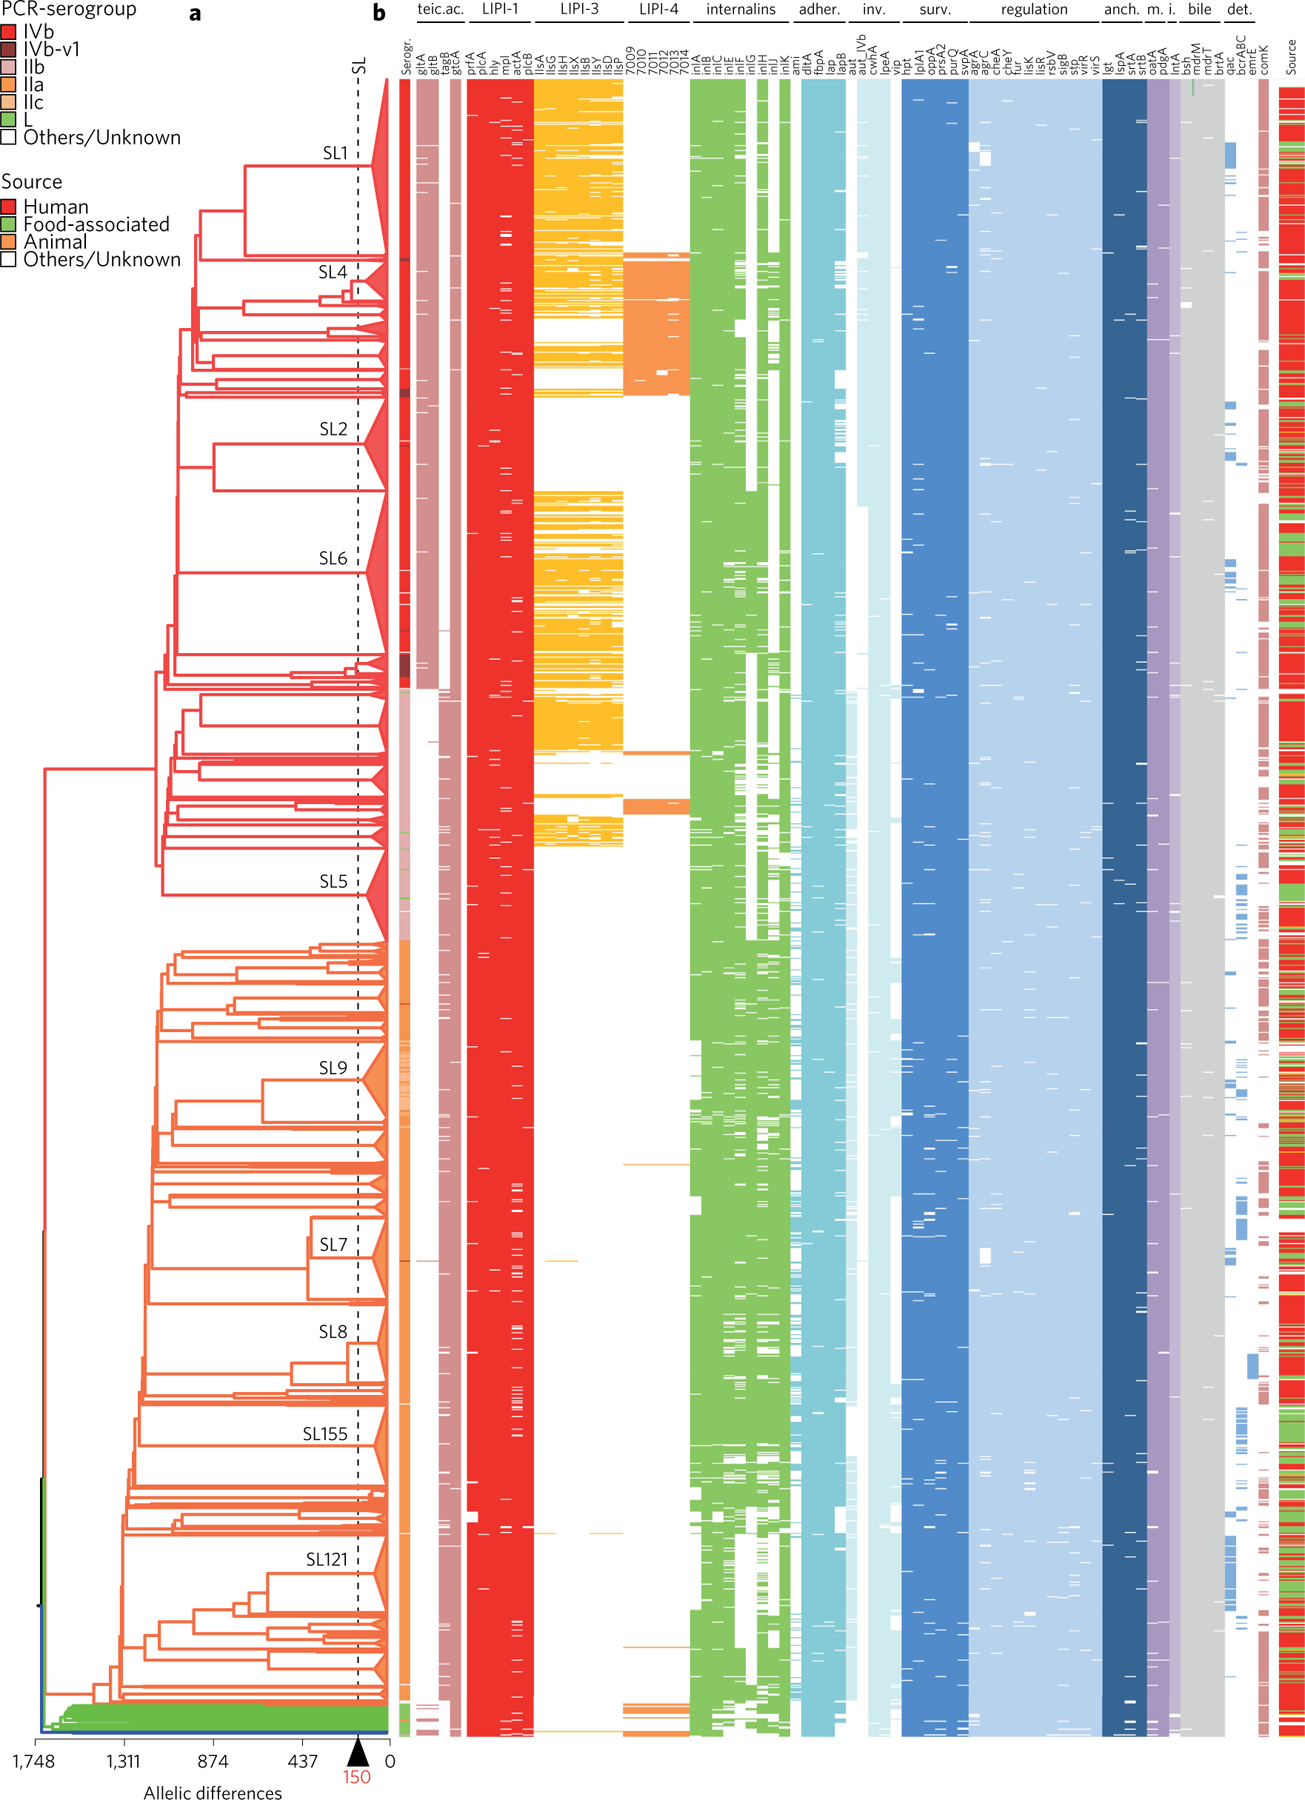
Listeria monocytogenes (Lm) is a major human foodborne pathogen. Numerous Lm outbreaks have been reported worldwide and associated with a high case fatality rate, reinforcing the need for strongly coordinated surveillance and outbreak control. We developed a universally applicable genome-wide strain genotyping approach and investigated the population diversity of Lm using 1,696 isolates from diverse sources and geographical locations. We define, with unprecedented precision, the population structure of Lm, demonstrate the occurrence of international circulation of strains and reveal the extent of heterogeneity in virulence and stress resistance genomic features among clinical and food isolates. Using historical isolates, we show that the evolutionary rate of Lm from lineage I and lineage II is low (∼2.5 × 10⁻⁷ substitutions per site per year, as inferred from the core genome) and that major sublineages (corresponding to so-called 'epidemic clones') are estimated to be at least 50-150 years old. This work demonstrates the urgent need to monitor Lm strains at the global level and provides the unified approach needed for global harmonization of Lm genome-based typing and population biology.


Conflict of interest statement

Competing interests

H.P. and B.P. are co-developers of the BioNumerics software mentioned in the manuscript. The remaining authors declare no competing interests.

Figures

Figure 1 |
Figure 1 |. Nomenclature of Lm cgMLST profiles.
a, Distribution of the number of cgMLST allelic differences between pairs of isolates among the 1,696 genomes (blue) and within 49 sets of epidemiologically related isolates (426 isolates in total; red). Dashed vertical bars represent cutoff values for cgMLST types (CT, 7 allelic mismatches) and sublineages (SL, 150 allelic mismatches). Inset: global data set. Main figure: up to 200 allelic mismatches. b, Rarefaction curves of the number of sublineages and cgMLST types identified, broken down per main phylogenetic lineage (I–IV). Curves were estimated using 100 random samples per point. Inset: zoom on the 0–50 x-axis values. Lineages III and IV were pooled but must be sampled more extensively to determine the shape of the curve.
Figure 2 |
Figure 2 |. Phylogenetic structure of the global Lm data set.
a, Phylogeny of the four phylogenetic lineages (I, red; II, orange; III, green; IV, blue). Representative isolates of the four lineages were used to determine the location of the root, using L. innocua and L. marthii as outgroups. The tree was obtained using FastME on the p-distance of the 1,748 concatenated alignments. b, Comparison of the phylogeny obtained from 1,748 recombination-purged sequence alignments (left) and from cgMLST allelic profile distances (right). To reduce redundancy, only one strain per outbreak set was used. Scale bars indicate the percentage of nucleotide substitutions (a right and b left) and the percentage of allelic mismatches (b right). For practical reasons, bootstrap values (based on 500 replicates) are shown only for long internal branches.
Figure 3 |
Figure 3 |. International distribution of Lm sublineages.
a, Clustering of 1,696 Lm isolates based on single-linkage analysis of the cgMLST profiles. Lineage branch colours are as in Fig. 2. Light and dark grey alternation (inner circle) delimits sublineages with more than 10 isolates (main sublineages are labelled). Source country is represented in the external ring using the colour key from c. b, Number of countries from which a sublineage was isolated, as a function of number of isolates per sublineage. Disk size is a function of number of isolates per sublineage. c, Inferred geographical origin of ancestral nodes of the phylogeny of SL1. Pie charts represent the likelihood proportion of geographical origins. The tree was constructed using minimum evolution based on cgMLST profiles. Bootstrap values above 50% (based on 500 replicates) are shown for the major nodes. d, Absolute number of geographical transitions (left) and number of geographical transitions normalized by total branch length (right) within the ten most frequent sublineages, as inferred by stochastic ancestral state reconstructions (numbers in parentheses indicate the precise values inferred for each sublineage).
Figure 4 |
Figure 4 |. International groups of isolates classified into the same cgMLST type.
The nine groups of isolates are indicated by a specific colour. The genotype is indicated as a string consisting of a succession of lineage (for example, L1), sublineage (for example, SL1), sequence type (for example, ST1) and cgMLST type (for example, CT288). Countries of isolation, isolation year range and total number of isolates are given after the genotype string. Circles on the map indicate the country where a particular CT was isolated and their size is related to the number of isolates from that country. The details for each CT are given in Supplementary Table 6. Abbreviations: US, United States of America; CA, Canada; DK, Denmark; UK, United Kingdom; FR, France.
Figure 5 |
Figure 5 |. Temporal analysis of cgMLST profile evolution.
a, Best-fitting rooted phylogeny of SL1 isolates (n = 195), including the historical isolates. The tree was obtained using FastME on cgMLST profiles. Coloured blocks represent the isolation time range (1921–1950, pink; 1951–1980, purple; 1981–2010, blue; 2011–2015, green). Outbreak reference strains are indicated by red dots. Outbreak identifier, country, year and cgMLST type are provided on the right. The scale bar indicates the number of allelic substitutions per locus. Statistical significance was assessed using F-test. b, Linear regression of isolation year with root-to-tip cgMLST distance. c, Accumulation of cgMLST variation over time, determined based on the international CTs (n = 9) and outbreak sets (n = 49). Statistical significance was assessed using F-test.
Figure 6 |
Figure 6 |. Virulence and resistance profiles across the phylogeny of the 1,696 Lm isolates.
a, Cluster analysis based on cgMLST profiles. The dashed vertical bar indicates the cgMLST mismatch cutoff for sublineages. The ten most frequent sublineages are highlighted. b, Pattern of gene presence (colour line) or absence (white). The first and last columns correspond to the serogroup and sample source, respectively, represented by colour codes (upper left key). The presence/absence gene matrix represents, from left to right, genes involved in teichoic acid biosynthesis (gltAB, tagB, gtcA), genes located in the pathogenicity islands LIPI-1 (prfA, plcA, hly, mpl, actA, plcB), LIPI-3 (llsAGHXBYDP) and LIPI-4 (LM9005581_70009 to LM9005581_70014), genes coding for internalins (inlABCEFGHJK) and other genes involved in adherence (ami, dltA, fbpA, lap, lapB), invasion (aut, aut_IVb, cwhA, lpeA, vip), intracellular survival (hpt, lplA1, oppA, prsA2, purQ, svpA), regulation of transcription and translation (agrAC, cheAY, fur, lisKR, rsbV, sigB, stp, virRS), surface protein anchoring (lgt, lspA, srtAB), peptidoglycan modification (oatA, pdgA), immune modulation (lntA), bile-resistance (bsh, mdrM, mdrT, brtA), resistance to detergents (qac, bcrABC, ermE) and biofilm formation and virulence (comK).

References

    1. Mutreja A et al. Evidence for several waves of global transmission in the seventh cholera pandemic. Nature 477, 462–465 (2011). - PMC - PubMed
    1. Grad YH et al. Genomic epidemiology of the Escherichia coli O104:H4 outbreaks in Europe, 2011. Proc. Natl Acad. Sci. USA 109, 3065–3070 (2012). - PMC - PubMed
    1. Woolhouse MEJ, Rambaut A & Kellam P Lessons from Ebola: improving infectious disease surveillance to inform outbreak management. Sci. Transl. Med 7, 307rv5 (2015). - PMC - PubMed
    1. van Belkum A et al. Guidelines for the validation and application of typing methods for use in bacterial epidemiology. Clin. Microbiol. Infect 13, 1–46 (2007). - PubMed
    1. Bogner P, Capua I, Cox NJ, Lipman DJ & Others. A global initiative on sharing avian flu data. Nature 442, 981–981 (2006).