Meta-Analysis
. 2016 Nov;48(11):1418-1424.
doi: 10.1038/ng.3680. Epub 2016 Oct 10.

Genome-wide association studies of autoimmune vitiligo identify 23 new risk loci and highlight key pathways and regulatory variants

Affiliations
Meta-Analysis

Genome-wide association studies of autoimmune vitiligo identify 23 new risk loci and highlight key pathways and regulatory variants

Ying Jin et al. Nat Genet. 2016 Nov.

Abstract

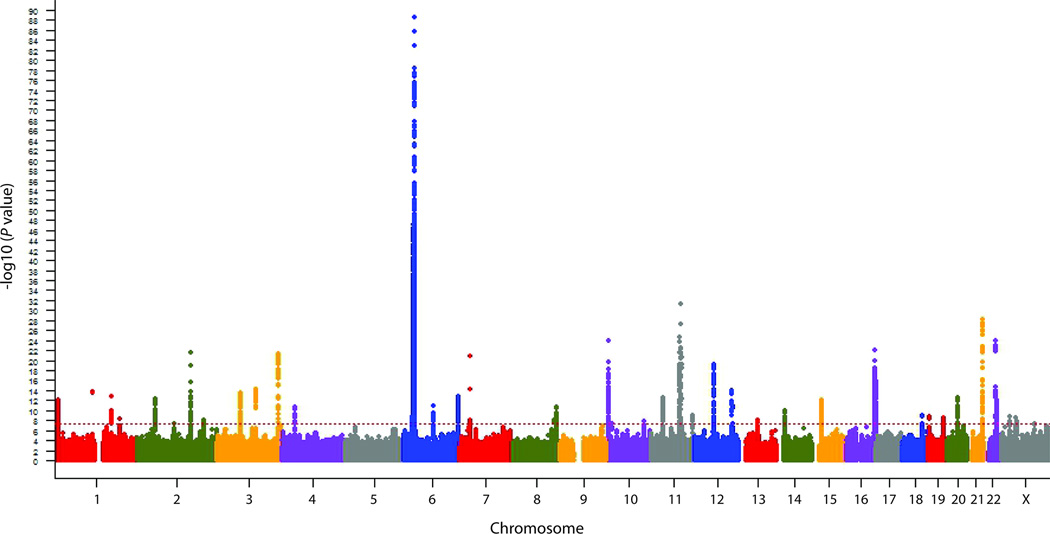
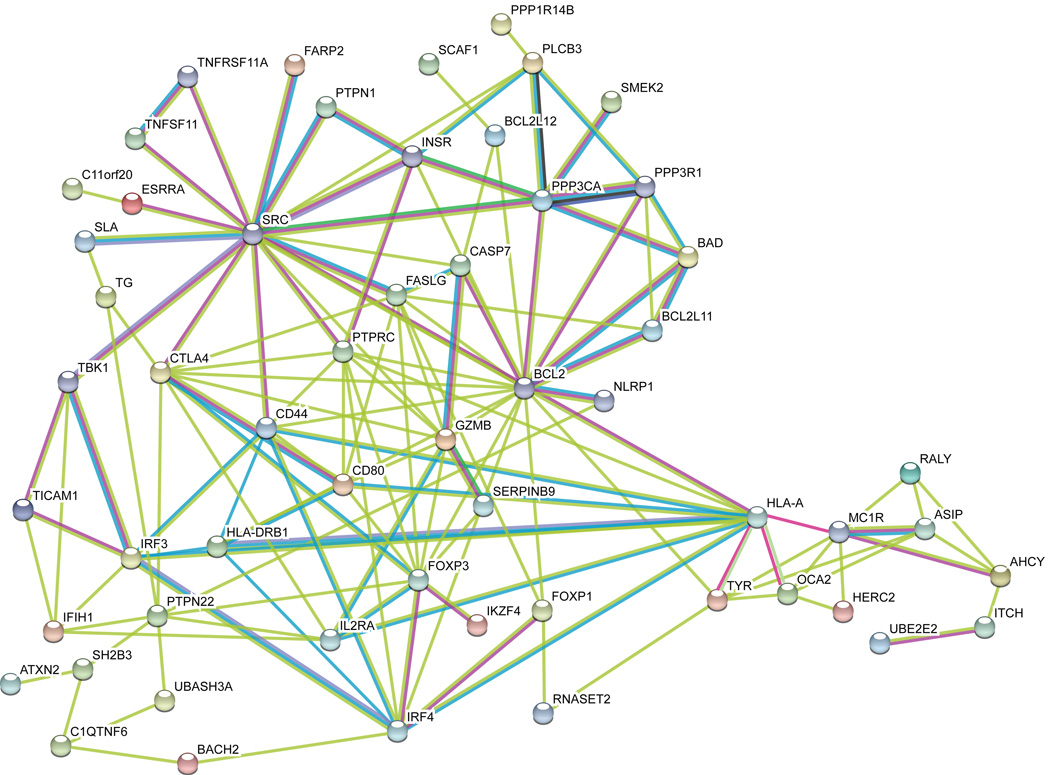
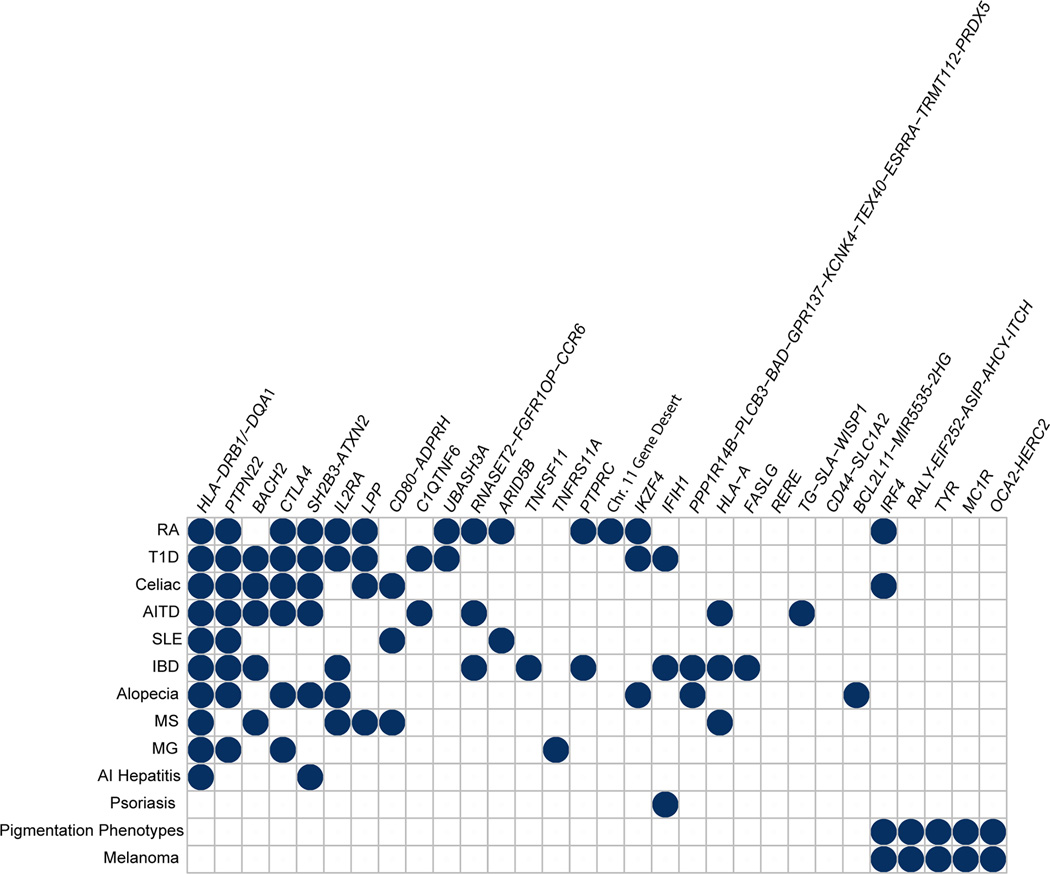
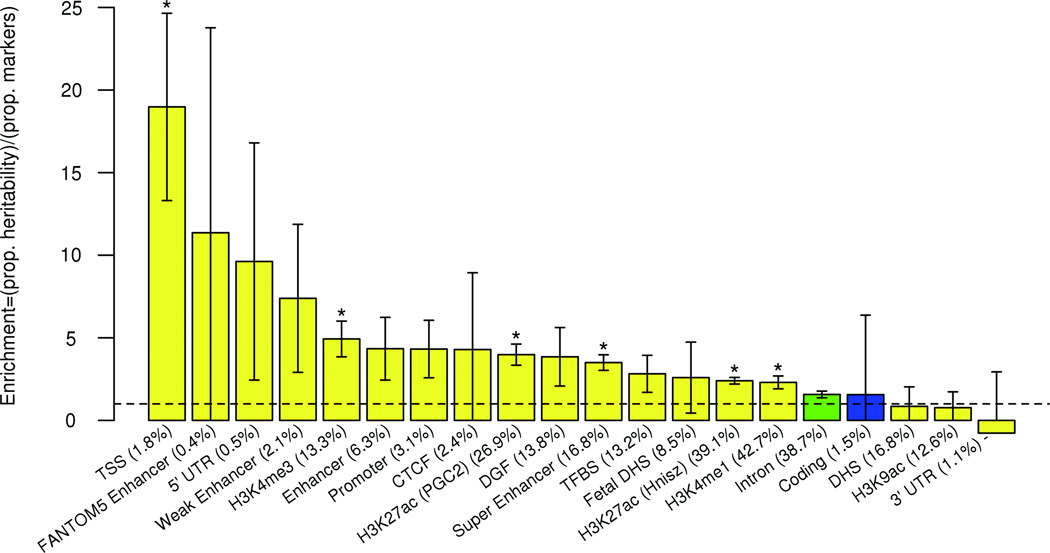
Vitiligo is an autoimmune disease in which depigmented skin results from the destruction of melanocytes, with epidemiological association with other autoimmune diseases. In previous linkage and genome-wide association studies (GWAS1 and GWAS2), we identified 27 vitiligo susceptibility loci in patients of European ancestry. We carried out a third GWAS (GWAS3) in European-ancestry subjects, with augmented GWAS1 and GWAS2 controls, genome-wide imputation, and meta-analysis of all three GWAS, followed by an independent replication. The combined analyses, with 4,680 cases and 39,586 controls, identified 23 new significantly associated loci and 7 suggestive loci. Most encode immune and apoptotic regulators, with some also associated with other autoimmune diseases, as well as several melanocyte regulators. Bioinformatic analyses indicate a predominance of causal regulatory variation, some of which corresponds to expression quantitative trait loci (eQTLs) at these loci. Together, the identified genes provide a framework for the genetic architecture and pathobiology of vitiligo, highlight relationships with other autoimmune diseases and melanoma, and offer potential targets for treatment.


Figures

Figure 1
Figure 1
Genome-wide meta-analysis results. The genome-wide distribution of −log10 (P values) from the Cochran-Mantel-Haenszel meta-analysis for 8,966,411 genotyped and imputed markers from GWAS1, GWAS2, and GWAS3 is shown across the chromosomes. The dotted line indicates the threshold for genome-wide significance (P < 5 × 10⁻⁸).
Figure 2
Figure 2
Bioinformatic functional interaction network analysis of proteins encoded by all positional candidate genes at all confirmed and suggestive vitiligo candidate loci. As a first step, unsupervised functional interaction network analysis was carried out using STRING v10.0, considering each protein as a node and permitting ≤ 5 second-order interactions to maximize connectivity. Nodes that shared no edges with other nodes were then excluded from the network. Edge colors are per STRING: teal, interactions from curated databases; purple, experimentally determined interactions; green, gene neighborhood; blue, databases; red, gene fusions; dark blue, gene co-occurrence; pale green, text-mining; black, co-expression; lavender, protein homology. Note that SMEK2 is an alternative name for PPP4R3B.
Figure 3
Figure 3
Concordant associations for vitiligo and other autoimmune and inflammatory diseases. We searched the NHGRI-EBI GWAS Catalog and PubMed for associations of the 48 genome-wide significant and 7 suggestive vitiligo susceptibility loci with other autoimmune, inflammatory, and immune-related disorders, and for association with normal human pigmentation variation. Only reported associations that achieved genome-wide significance (P < 5 × 10⁻⁸) are included. RA, rheumatoid arthritis; T1D, type 1 diabetes mellitus; AITD, autoimmune thyroid disease; SLE, systemic lupus erythematosus; IBD, inflammatory bowel disease; MS, multiple sclerosis; MG, myasthenia gravis; AI hepatitis, autoimmune hepatitis.
Figure 4
Figure 4
Enrichment estimates for functional annotations. The combined CMH GWAS123 summary statistics were analyzed using the stratified LD score regression method utilizing the full baseline model. Regulatory, yellow; protein coding, blue; intron, green. Bar height represents enrichment which is defined to be the proportion of SNP heritability in the category divided by the proportion of SNPs in that category. Error bars represent jackknife standard error around the enrichment. For each category, percentage of the total markers in the category is in parentheses. Dashed line represents a ratio of 1 (no enrichment). Asterisks indicate enrichment significant at P < 0.05 after Bonferroni correction for the 20 categories tested (the categories conserved, repressed, transcribed, and promoter flanking were removed and considered insufficiently specific). CTCF, CCCTC-binding factor; DGF, digital genomic footprint; DHS, DNase hypersensitivity site; TFBS, transcription factor binding site; TSS, transcriptional start site; 5’ and 3’ UTR, 5’ and 3’ untranslated regions. H3K4me1, H3K4me3, H3K9ac, and H3K27ac are regulatory chromatin marks,.

References

    1. Picardo M, Taïeb A, editors. Vitiligo. Springer, Heidelberg & New York: 2010.
    1. Alkhateeb A, et al. Epidemiology of vitiligo and associated autoimmune diseases in Caucasian probands and their families. Pigment Cell Res. 2003;16:208–214. - PubMed
    1. Jin Y, et al. NALP1 in vitiligo-associated multiple autoimmune disease. N. Engl. J. Med. 2007;356:1216–1225. - PubMed
    1. Jin Y, et al. Variant of TYR and autoimmunity susceptibility loci in generalized vitiligo. N. Engl. J. Med. 2010;362:1686–1697. - PMC - PubMed
    1. Jin Y, et al. Common variants in FOXP1 are associated with generalized vitiligo. Nat. Genet. 2010;42:576–578. - PMC - PubMed

Methods-only References

    1. Taïeb A, Picardo M. The definition and assessment of vitiligo: a consensus report of the VitiligoEuropean Task Force. Pigment Cell Res. 2007;20:27–35. - PubMed
    1. Purcell S, et al. PLINK: a toolset for whole-genome association and population-based linkage analysis. Am. J. Hum. Genet. 2007;81:559–575. - PMC - PubMed
    1. Price AL, et al. Principal components analysis corrects for stratification in genome-wide association studies. Nat. Genet. 2006;38:904–909. - PubMed
    1. Lee AB, Luca D, Klei L, Devlin B, Roeder K. Discovering genetic ancestry using spectral graph theory. Genet. Epidemiol. 2010;34:51–59. - PMC - PubMed
    1. Chang D, et al. Accounting for eXentricities: analysis of the X chromosome in GWAS reveals X- linked genes implicated in autoimmune diseases. PLoS One. 2014;9:e113684. - PMC - PubMed

Publication types