. 2016 Oct 10;15(1):113.
doi: 10.1186/s12938-016-0234-6.

Hemodynamic numerical simulations of the disturbance due to intracoronary flow measurements by a Doppler guide wire

Affiliations

Hemodynamic numerical simulations of the disturbance due to intracoronary flow measurements by a Doppler guide wire

Kamil J Chodzyński et al. Biomed Eng Online. .

Abstract

Background: Since hemodynamics plays a key role in the development and evolution of cardiovascular pathologies, physician's decision must be based on proper monitoring of relevant physiological flow quantities.

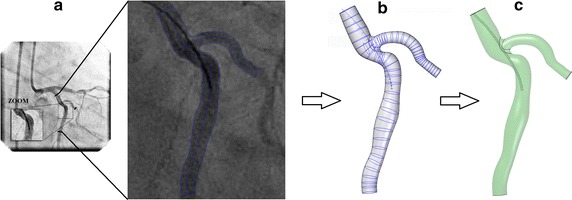
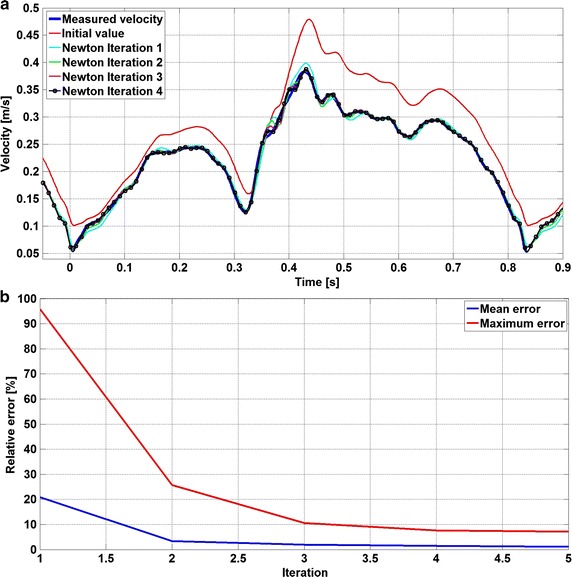
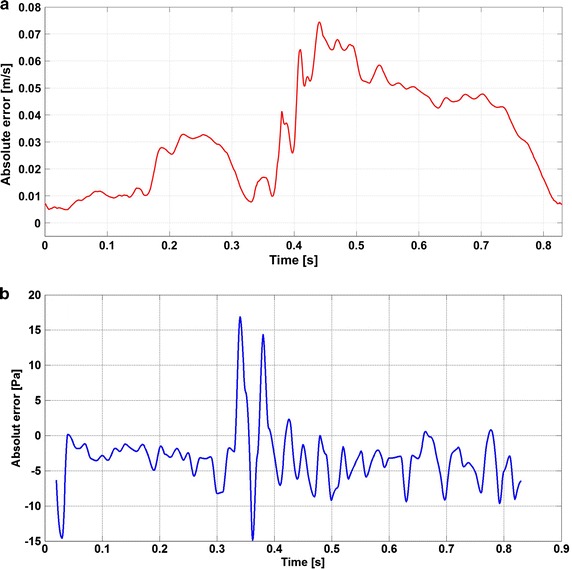
Methods: A numerical analysis of the error introduced by an intravascular Doppler guide wire on the peak velocity measurements has been carried out. The effect of probe misalignment (±10°) with respect to the vessel axis was investigated. Numerical simulations were performed on a realistic 3D geometry, reconstructed from coronary angiography images. Furthermore, instead of using Poiseuille or Womersley approximations, the unsteady pulsatile inlet boundary condition has been calculated from experimental peak-velocity measurements inside the vessel through a new approach based on an iterative Newton's algorithm.

Results: The results show that the presence of the guide modifies significantly both the maximum velocity and the peak position in the section plane; the difference is between 6 and 17 % of the maximum measured velocity depending on the distance from the probe tip and the instantaneous vessel flow rate. Furthermore, a misalignment of the probe may lead to a wrong estimation of the peak velocity with an error up to 10 % depending on the probe orientation angle.

Conclusions: The Doppler probe does affect the maximum velocity and its position during intravascular Doppler measurements. Moreover, the Doppler-probe-wire sampling volume at 5.2 and 10 mm far from the probe tip is not sufficient to prevent its influence on the measurement. This should be taken into account in clinical practice by physicians during intravascular Doppler quantification. The new numerical approach used in this work could potentially be helpful in future numerical simulations to set plausible inlet boundary conditions.

Keywords: Doppler guide wire; Flow disturbance; Numerical simulations; Unsteady pulsatile inlet boundary condition.


Figures

Fig. 1
Fig. 1
Doppler guide wire—acquisition of peak velocity. Position of the measured volume slice with respect to the tip guide wire (left) and peak evolution in time reconstruction (right) from the measured samples (centre)
Fig. 2
Fig. 2
Measured coronary velocity: raw data and post-processed data. A real coronary artery signal measured in a patient indicates a significant variability from cycle to cycle (length of one cycle equals 0.83 s). The figure depicts the in vivo signal, divided in periods of the same length (thin gray lines) and the resulting averaged filtered velocity profile (thick line). In addition, minimum and maximum measured velocities at a given time are marked as circles
Fig. 3
Fig. 3
From angiographies images to CAD model for CFD computation. a, left The quantitative coronary angiography (QCA) images performed during the measurements, (a, right) outline the 2D geometry, b 3D skeleton definition by contour revolution and c closed volume generation
Fig. 4
Fig. 4
Peak velocity evolution in measuring volume slice during Newton’s iterations. a The Newton’s iterations of the peak velocity compared with in vivo measured velocity (blue line) inside the vessel are given. b The maximum and mean relative error values of error function e(u(t)) at each iteration to prescribe fitted inlet boundary condition are plotted
Fig. 5
Fig. 5
Inlet velocity condition during the Newton’s iterations. Each coloured line represents the time dependent inlet velocity for each Newton’s iteration (blue line is the first guess—black with the markers is the final solution)
Fig. 6
Fig. 6
Flow field comparison at t = 0.02 s for 3 cutting planes. The figure presents the 2D velocity magnitude fields for the minimum velocity at t = 0.02 s. The 3 cutting planes are respectively 0, 5 and 10 mm far from the guide wire tip. To emphasize the guide wire influence, a comparison of the fields without the guide wire (left) and with (right) is also provided
Fig. 7
Fig. 7
Flow field comparison at t = 0.44 s for 3 cutting planes. The figure presents the 2D velocity magnitude fields for the maximum velocity at t = 0.44 s. The cutting planes are respectively 0, 5 and 10 mm far from the guide wire tip. To emphasize the guide wire influence, a comparison of the fields without the guide wire (left) and with (right) is also provided
Fig. 8
Fig. 8
Investigated volume slices for different orientations. The figure presents the investigated volume slices and the covered regions in the vessels for three different angles (−10°—blue cylinder, 0°—red cylinder, +10°—green cylinder)
Fig. 9
Fig. 9
Analysis of the catheter probe position angles inside the vessel. The figure presents the maximum velocity evolution measured for different position of the catheter angles between ∓10°. In addition, for comparison a result for the case without the wire is also added
Fig. 10
Fig. 10
Velocity and pressure absolute error evaluation. The plot shows the absolute error between the simulations with and without wire for the velocity a and pressure b. The error is significant for the velocity a and negligible for the pressure b in comparison to the average blood pressure
Fig. 11
Fig. 11
Result analysis—peak velocity relative errors. The figure presents the relative error of the peak velocity between the case with and without wire and cutting planes 0, 5 and 10 mm far from the guide wire tip. They are presented for the time step tmin = 0.02 s (blue bars) and tmax = 0.44 s (red bars)
Fig. 12
Fig. 12
Result analysis—absolute errors on the sections. The absolute error of the velocity fields between the cases with and without wire is given. The error is calculated on three cutting planes at 0, 5 and 10 mm ahead of the guide wire tip. The results visualize the time step tmin = 0.02 s (left column) and tmax = 0.44 s (right column)
Fig. 13
Fig. 13
Result analysis—peak velocity relative errors for different probe tip angle

References

    1. Jiang J, Strother C, Johnson K, Baker S, Consigny D, Wieben O, et al. Comparison of blood velocity measurements between ultrasound Doppler and accelerated phase-contrast MR angiography in small arteries with disturbed flow. Phys Med Biol. 2011;56:1755–1773. doi: 10.1088/0031-9155/56/6/015. - DOI - PMC - PubMed
    1. Ferns SP, Schneiders JJ, Siebes M, van den Berg R, van Bavel ET, Majoie CB. Intracranial blood-flow velocity and pressure measurements using an intra-arterial dual-sensor guidewire. AJNR Am J Neuroradiol. 2010;31:324–326. doi: 10.3174/ajnr.A1718. - DOI - PMC - PubMed
    1. Benndorf G, Singel S, Proest G, Lanksch W, Felix R. The Doppler guide wire: clinical applications in neuroendovascular treatment. Neuroradiology. 1997;39:286–291. doi: 10.1007/s002340050411. - DOI - PubMed
    1. Doucette JW, Corl PD, Payne HM, Flynn AE, Goto M, Nassi M, et al. Validation of a Doppler guide wire for intravascular measurement of coronary artery flow velocity. Circulation. 1992;85:1899–1911. doi: 10.1161/01.CIR.85.5.1899. - DOI - PubMed
    1. Ai L, Yu H, Dai W, Hale SL, Kloner RA, Hsiai TK. Real-time intravascular shear stress in the rabbit abdominal aorta. IEEE Trans Biomed Eng. 2009;56:1755–1764. doi: 10.1109/TBME.2009.2013455. - DOI - PMC - PubMed

LinkOut - more resources