. 2016 Oct 11:5:e19960.
doi: 10.7554/eLife.19960.

Dynamics of mTORC1 activation in response to amino acids

Affiliations

Dynamics of mTORC1 activation in response to amino acids

Maria Manifava et al. Elife. .

Abstract

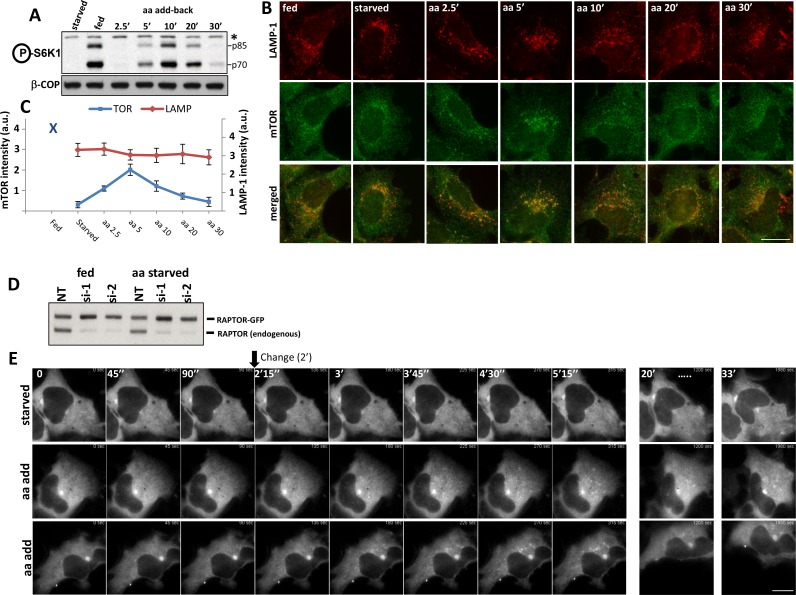
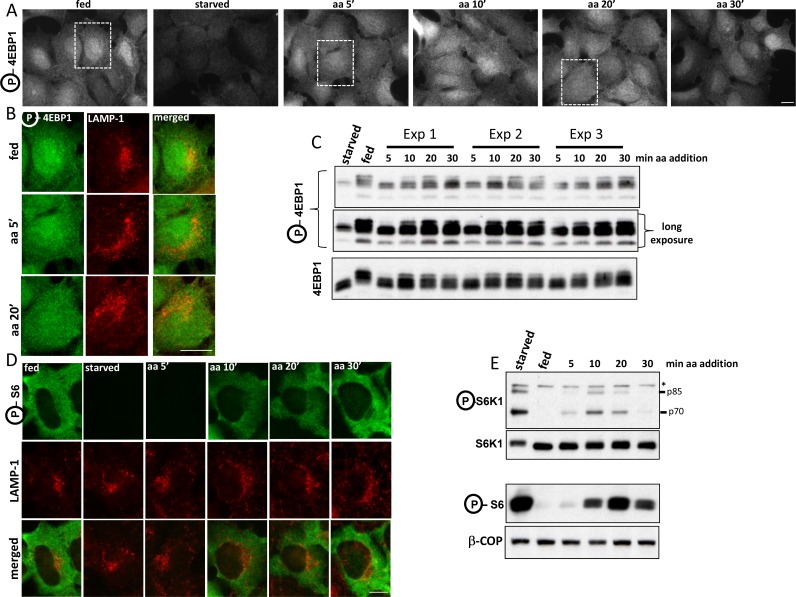
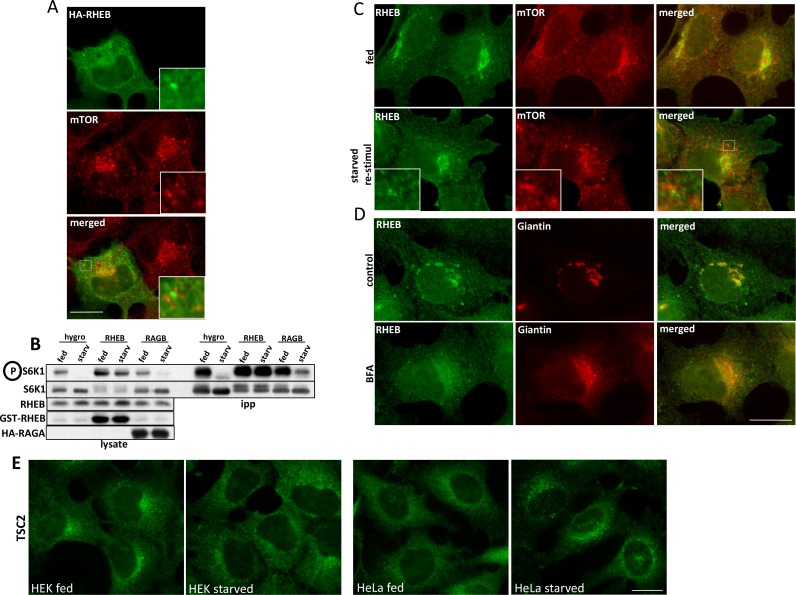
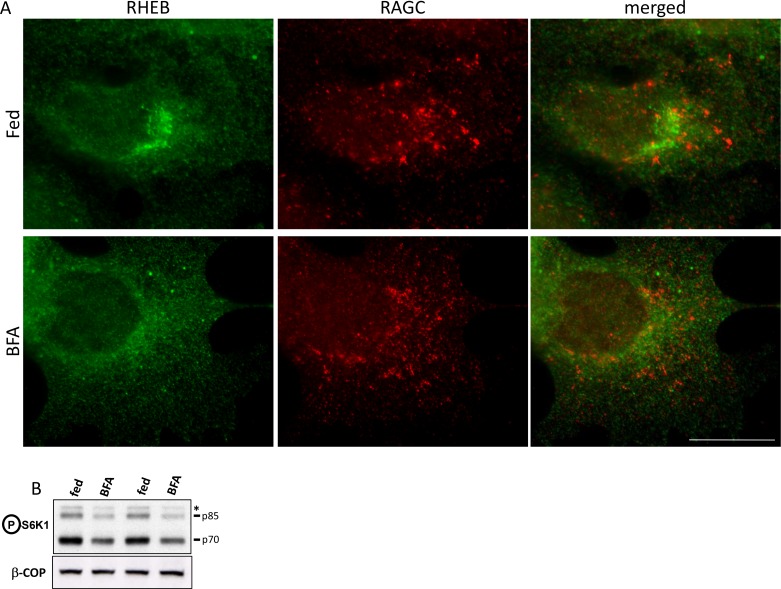
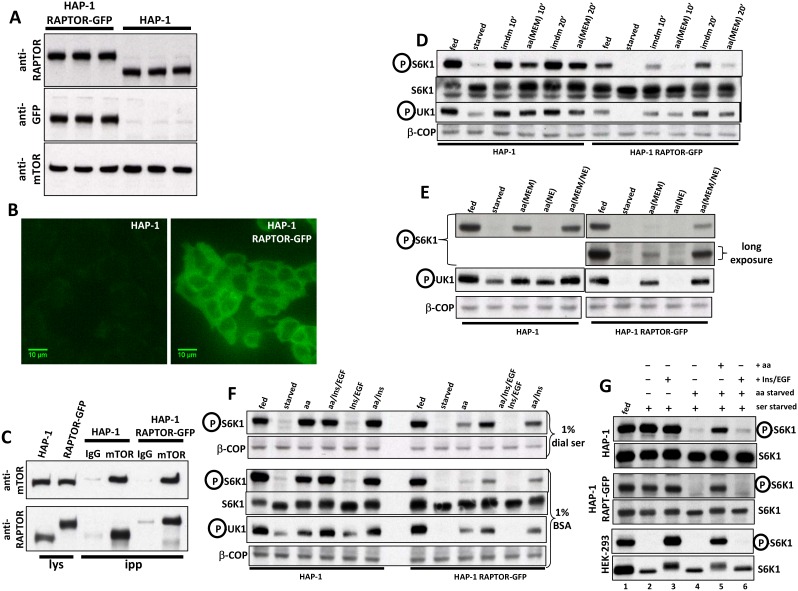
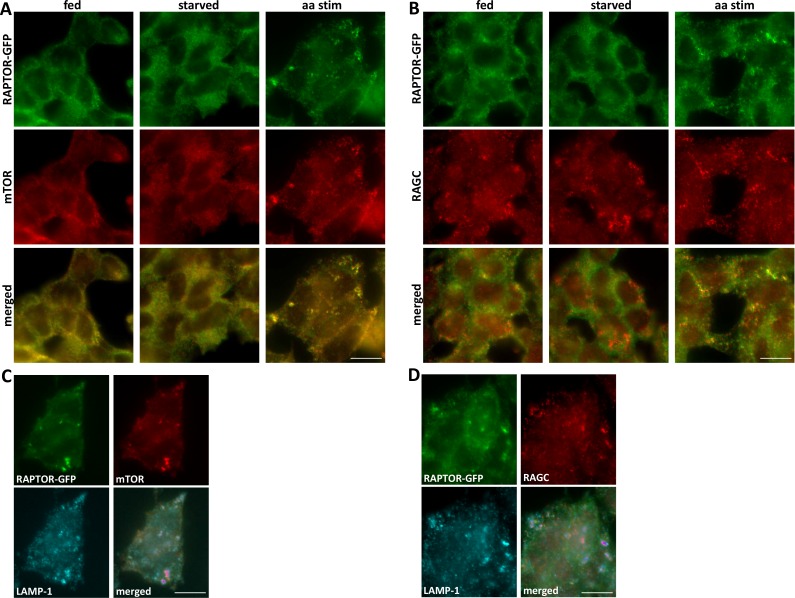
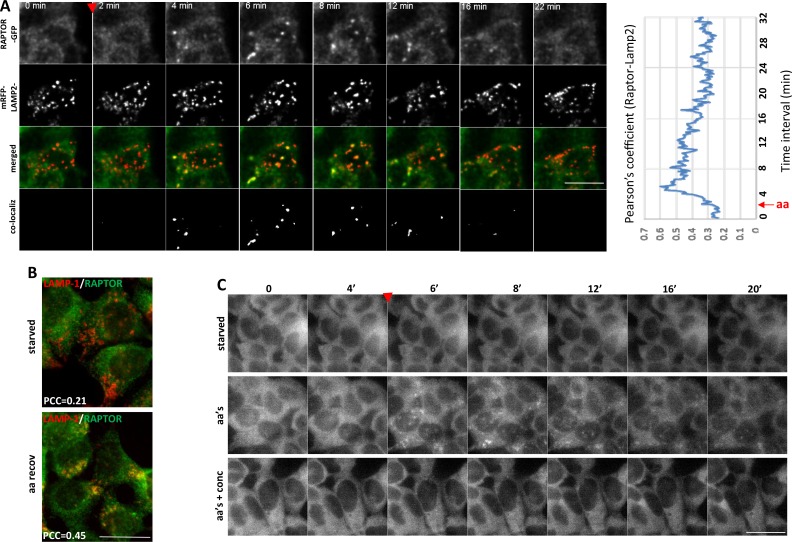
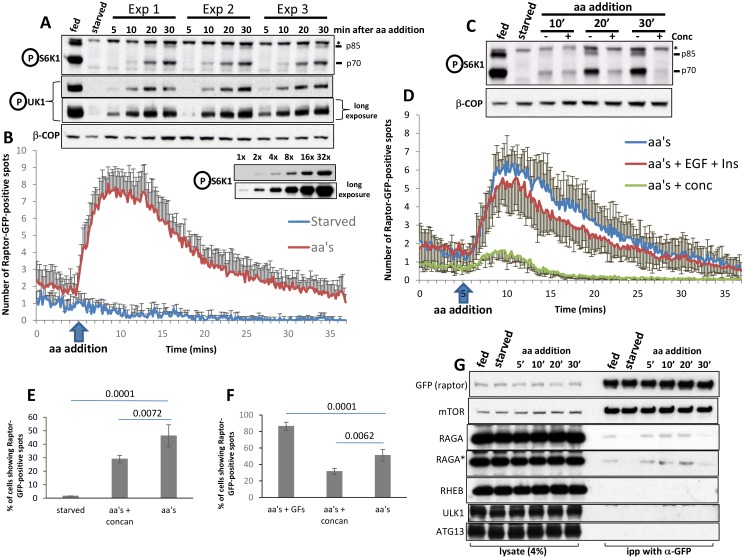
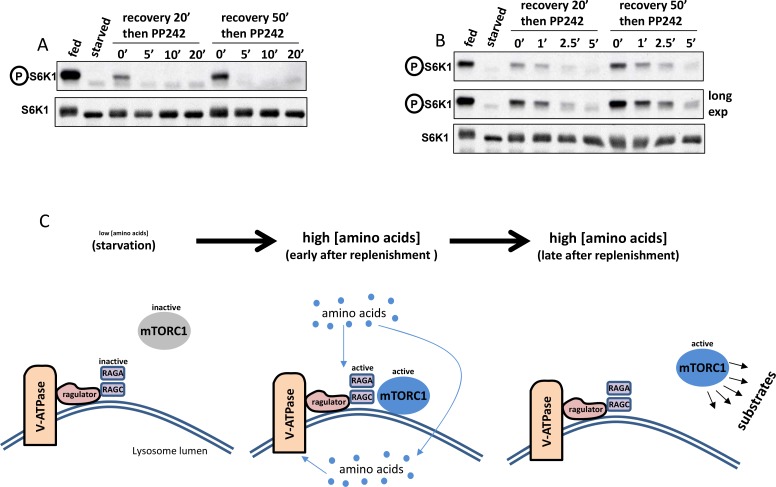
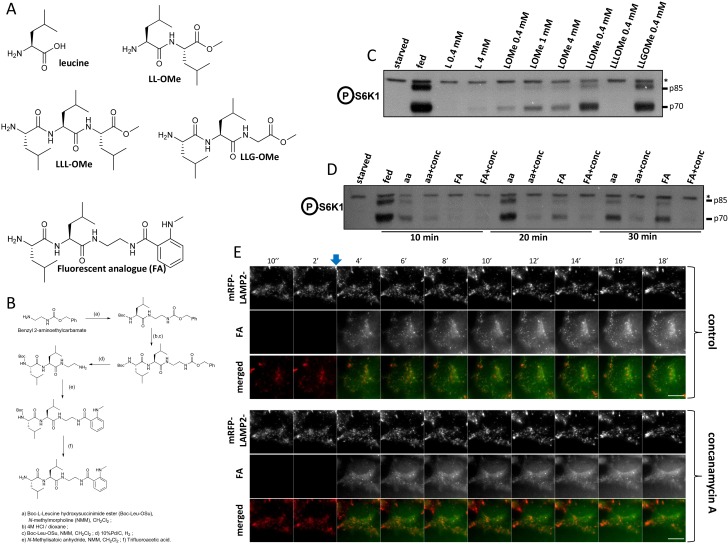
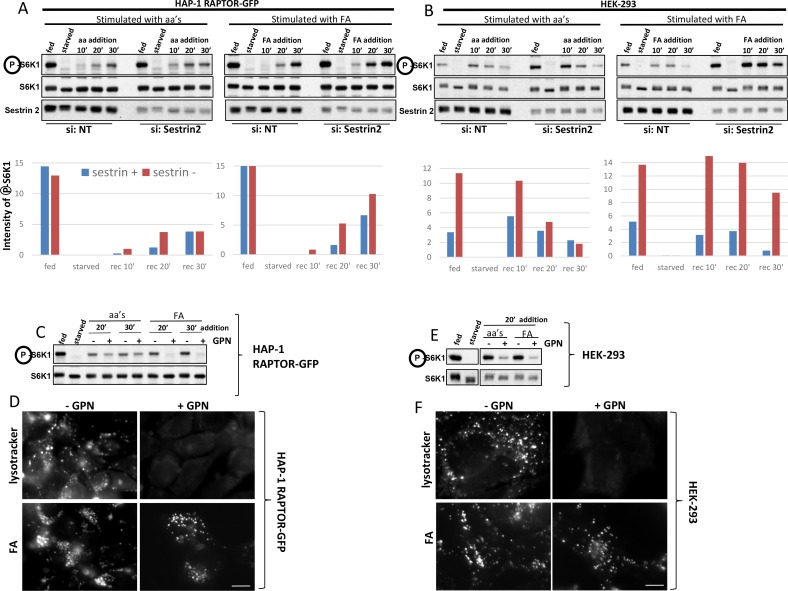
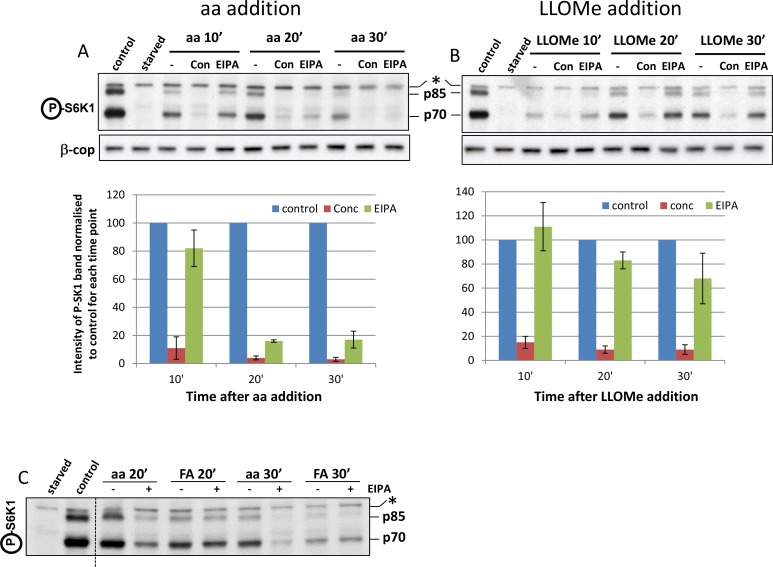
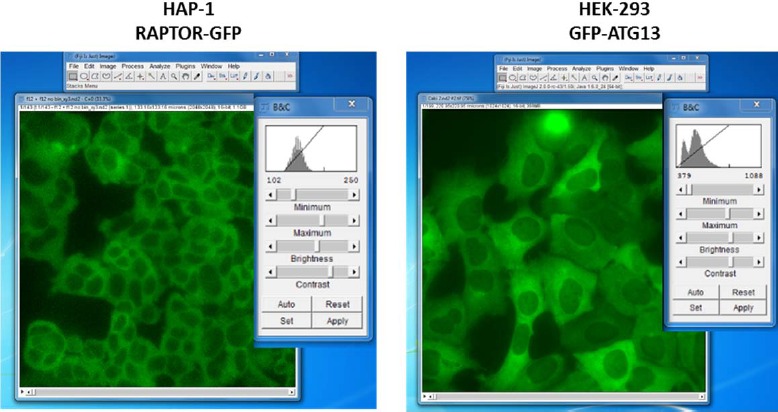
Amino acids are essential activators of mTORC1 via a complex containing RAG GTPases, RAGULATOR and the vacuolar ATPase. Sensing of amino acids causes translocation of mTORC1 to lysosomes, an obligate step for activation. To examine the spatial and temporal dynamics of this translocation, we used live imaging of the mTORC1 component RAPTOR and a cell permeant fluorescent analogue of di-leucine methyl ester. Translocation to lysosomes is a transient event, occurring within 2 min of aa addition and peaking within 5 min. It is temporally coupled with fluorescent leucine appearance in lysosomes and is sustained in comparison to aa stimulation. Sestrin2 and the vacuolar ATPase are negative and positive regulators of mTORC1 activity in our experimental system. Of note, phosphorylation of canonical mTORC1 targets is delayed compared to lysosomal translocation suggesting a dynamic and transient passage of mTORC1 from the lysosomal surface before targetting its substrates elsewhere.

Keywords: amino acids; biochemistry; cell biology; human; mtor; signaling.


Conflict of interest statement

The authors declare that no competing interests exist.

Figures

Figure 1.
Figure 1.. Activation of mTOR components in response to amino acids.
HEK-293 cells were starved of amino acids and growth factors, and re-stimulated for the indicated times with MEM amino acids. (A) The phosphorylation of S6K at T389 was established as a surrogate for mTORC1 activity. Band marked with an asterisk serves as loading control. (B) Under the same conditions the localization of mTOR and the LAMP-1 lysosomal protein were examined by indirect immunofluorescence using antibodies that recognise the endogenous protein. (C) The total intensity of mTOR- or LAMP-1-positive puncta for the conditions shown in (B) were quantitated and plotted. We used 2 biological replicates with 10 technical repeats (10 regions of interest) and the error bars represent standard error of the mean. (D) HEK-293 cells were co-transfected with siRNAs targeting the 3’ (si-1) and the 5’ (si-2) untranslated region of RAPTOR together with plasmids expressing RAPTOR-GFP for 3 days. Levels of endogenous RAPTOR and the exogenous tagged protein were determined with RAPTOR antibodies. (E) Live cell imaging of samples as in D. Cells were starved of amino acids and growth factors and re-stimulated either with starvation medium (starved) or with amino acids (aa add) for the indicated times. Representative frames are shown. The change to either starvation or amino acid medium was done after 90’’ of incubation. The bar in all panels represents 10 µm. DOI: http://dx.doi.org/10.7554/eLife.19960.003
Figure 1—figure supplement 1.
Figure 1—figure supplement 1.. Localization of mTOR-phosphorylated 4EBP1 and S6K-phosphorylated S6 in response to amino acid stimulation.
(A–C) HEK-1 cells were starved of amino acids and growth factors for 60’ and re-stimulated with starvation medium containing MEM amino acids for the indicated times. Some samples were stained with antibodies to endogenous phosphorylated (T37/46) 4EBP1 and endogenous LAMP-1 (A and B) whereas parallel samples were analysed by immunoblotting to reveal phosphorylated (T37/46) 4EBP1 (C). Note that for clarity we have shown the co-staining of phosphorylated 4EBP1 and LAMP-1 in (B) only for the selected regions shown in (A). (D, E). Cells treated as above were stained with antibodies to phosphorylated S6 and LAMP-1 (shown in D) or immunoblotted for phosphorylated S6K1 or phosphorylated S6 as indicated. Asterisk indicates irrelevant band serving as loading control. Bar in all panels represents 10 µm. DOI: http://dx.doi.org/10.7554/eLife.19960.004
Figure 1—figure supplement 2.
Figure 1—figure supplement 2.. Localization of overexpressed and endogenous RHEB in relation to mTOR.
(A) HEK-293 cells were transfected with plasmids encoding HA-RHEB for 24 hr and were then fixed and stained for immunofluorescence with antibodies to HA and endogenous mTOR. (B) HEK-293 cells were transfected with empty vector (hygro) or with plasmids expressing either RHEB or RAGA simultaneously (all three conditions) with HA-tagged S6K1. After 24 hr, cells were kept in full medium or starved for 60 min and all samples were lysed and immunoprecipitated with HA antibodies. After electrophoresis and blotting, the blots were stained with antibodies to S6K phospho T389 or the other relevant proteins as indicated (C) HEK-293 cells were kept in full medium (fed), or starved and re-stimulated with starvation medium containing MEM amino acids for 20’. The cells were fixed and stained for immunofluorescence with antibodies to endogenous mTOR and endogenous RHEB. (D) HEK-293 cells were left untreated (control) or treated with 5 µg/ml Brefeldin A for 60’ (BFA). After fixation the cells were stained for immunofluorescence with antibodies to endogenous RHEB or endogenous Giantin. (E) HEK-293 or HeLa cells were kept in full medium or starved for 60’. They were then fixed and stained for antibodies to endogenous TSC2. Bar in all panels represents 10 µm. DOI: http://dx.doi.org/10.7554/eLife.19960.005
Figure 1—figure supplement 3.
Figure 1—figure supplement 3.. Localization and activity of RHEB upon Golgi disruption.
HEK-293 cells were kept in normal medium or treated with 5 µg/ml BFA for 60’. (A) After fixation and permeabilization, the cells were stained with antibodies to endogenous RHEB and RAGC as indicated. (B) After treatment, the samples were lysed and immunoblotted for S6K phospho T389 in order to ascertain the effect of RHEB redistribution on mTORC1 activation. Bar represents 10 µm. DOI: http://dx.doi.org/10.7554/eLife.19960.006
Figure 2.
Figure 2.. Characterization of HAP-1 cells expressing RAPTOR-GFP in place of endogenous RAPTOR.
(A) Immunoblots of parental HAP-1 cells or HAP-1 cells expressing RAPTOR-GFP, in triplicate. (B) Fluorescence microscopy of cells as in A; both photos were taken at the same setting of brightness and similarly edited in Photoshop. The bar represents 10 µm. (C) Cells as in A were lysed in 0.3% CHAPS lysis buffer and lysates subjected to immunoprecipitation using either mTOR antibodies or antibodies to PAK1 used as an IgG control. After immunoprecipitation and electrophoresis the samples were blotted with antibodies to RAPTOR or to mTOR. (D) Cells as in A were kept in normal medium (Iscove’s modified Dulbecco’s medium -IMDM plus 10% FBS) or starved of amino acids and growth factors for 60 min in medium containing salts and 1% dialysed FBS. The cells were then re-stimulated for 10’ or 20’ either with normal growth medium (imdm) or with a mixture of MEM amino acids added to the starvation medium (aa). After lysis and electrophoresis the samples were immunoblotted for the indicated proteins. (E) Cells kept fed or starved as above were re-stimulated for 20 min with starvation medium containing a mixture of MEM amino acids, a mixture of non-essential (NE) amino acids or a combination of both. Detection was for S6K phospho T389 or ULK1 phospho S757. (F) Cells as in A were starved of amino acids and growth factors in medium containing salts and either 1% dialysed FBS (top panel) or 1% BSA (bottom panel). Re-stimulation for 20’ was in medium containing either dialysed FBS or BSA matching the starvation condition and also containing amino acids (mixture of MEM and NE), amino acids plus Insulin and EGF, Insulin and EGF only or amino acids plus Insulin. Detection was for the indicated proteins. (G) Parental HAP-1 cells, HAP-1 cells expressing RAPTOR-GFP or HEK-293 cells as indicated were starved of serum overnight. Next day, some samples were also starved of amino acids for 60’ as indicated and then re-stimulated for 20’ in medium containing growth factors (Insulin and EGF) and/or amino acids. Detection was for S6K or S6K phospho T389. DOI: http://dx.doi.org/10.7554/eLife.19960.007
Figure 3.
Figure 3.. Translocation of RAPTOR-GFP to mTOR- and RAGC-positive compartments in response to amino acid stimulation.
(A, B). HAP-1 cells expressing RAPTOR-GFP were kept under fed conditions or were starved of amino acids and growth factors and re-stimulated with a mixture of MEM and NE amino acids for 15’. The cells were fixed and stained with antibodies to endogenous mTOR (A) or RAGC (B). Detection was for GFP (RAPTOR) or using red secondary antibodies for mTOR and RAGC. (C, D). Cells starved and re-stimulated as above were fixed and simultaneously stained for mTOR and LAMP-1 (C) or RAGC and LAMP-1 (D). The bar in all panels represents 10 µm. DOI: http://dx.doi.org/10.7554/eLife.19960.008
Figure 4.
Figure 4.. Translocation of RAPTOR-GFP to lysosomes and its dynamics in response to amino acid stimulation.
(A) HAP-1 cells expressing RAPTOR-GFP were co-transfected with plasmids expressing mRFP-LAMP2 for 24 hr. The cells were then starved of amino acids and growth factors for 60’ and assembled on an imaging chamber still in starvation medium. Live imaging was started in a starvation medium for 2’ followed by replacement with medium containing a mixture of MEM and NE amino acids for an additional 40’. Images were captured every 10’’. Shown here are frames from such a movie in the two channels (GFP and red) the merged images and the co-localizing areas for the indicated time points. The extent of co-localization between RAPTOR-GFP and mRFP-LAMP2 as determined by the Pearson’s coefficient is plotted on the graph. Images were background-subtracted using the rolling ball method in FIJI (Schindelin et al., 2012) with a diameter of 10 pixels. Co-localization analysis was performed using Imaris software (Bitplane/Oxford Instruments) with thresholds for co-localization set using the auto function to avoid user bias. See also Video 1. (B) HAP-1 cells expressing RAPTOR-GFP were starved of amino acids and growth factors, and re-stimulated for 20’. The cells were stained for GFP (RAPTOR) and endogenous LAMP-1, and the extent of co-localization was determined by the Pearson’s co-efficient (PCC) shown. (C) HAP-1 cells expressing RAPTOR-GFP were starved of amino acids and growth factors for 60’ and set up for live imaging as above. Re-stimulation after 5’ of imaging was in the starvation medium (starved), in the starvation medium containing a mixture of MEM and NE amino acids (aa’s), or in medium containing amino acids and 2 µM concanamycin A (aa’s + conc) for an additional 40’. Images were captured every 10’’. Selected frames are shown. Note that in the concanamycin A-treated samples we found it necessary to pre-treat the cells for the last 10’ of starvation with the compound before adding it again during re-stimulation. The bar in all panels represents 10 µm. DOI: http://dx.doi.org/10.7554/eLife.19960.009
Figure 5.
Figure 5.. Dynamics of RAPTOR-GFP translocation to lysosomes in comparison to mTOR activity.
HAP-1 cells expressing RAPTOR-GFP were set up for parallel experiments: live imaging to reveal RAPTOR dynamics (B, D, E, F) and immunoblotting to reveal S6K phospho T389 (A, C) and ULK1 phospho S757 (A). Immunoblotting was for the indicated times after re-stimulation with a mixture of MEM and NE amino acids. The linearity of the detection for S6K phospho T389 is shown for ascending amounts of lysate (last two blots in A). In the experiment shown in A, re-stimulation was in triplicate. In the blot shown in C, concanamycin A was added to a final concentration of 2 µM for the indicated samples. In order to obtain graphs of RAPTOR translocation to punctate structures (B and D) we examined many cells for each condition coming from 3 to 4 independent imaging experiments (13 cells for control and 137 cells for aa’s in panel b; 59 cells for aa’s, 77 cells for aa’s + EGF + Ins and 60 cells for aa’s + conc in panel d). The number of puncta upon stimulation was counted in each cell using the Spots Detection function of Imaris software (Bitplane/Andor), and the average of all cells in each condition together with the standard deviation is plotted here. The number of cells responding to the various treatments and expressed as a percentage is shown in panels E and F, together with the statistical significance of the differences as indicated. Significance was evaluated using one-way ANOVA with a Bonferoni post-hoc test. Error bars represent standard error of the mean. (G) HAP-1 cells expressing RAPTOR-GFP were kept in fed conditions, starved for 60’ or starved for 60’ and re-stimulated with amino acids and growth factors for 5’, 10’, 20’ and 30’. The RAPTOR-GFP protein was immunoprecipitated from these cells and the immunoprecipitates were analysed for a variety of potential interacting proteins as shown. All experiments were conducted in 0.3% CHAPS lysis buffer with the exception of the one labelled RAGA* which was conducted in 0.3% deoxy big CHAP. DOI: http://dx.doi.org/10.7554/eLife.19960.012
Figure 5—figure supplement 1.
Figure 5—figure supplement 1.. Dynamics of de-phosphorylation and a simple model.
(A–B) The phosphatase(s) de-phosphorylating S6K do(es) not show differential activity during amino acid stimulation. HAP-1 cells expressing RAPTOR-GFP were kept fed or starved of amino acids and growth factors for 60’. They were then re-stimulated with amino acids and growth factors for either 20’ or 50’ to generate two populations of mTOR-phosphorylated S6K. At the end of re-stimulation one sample from each population was kept and the rest received 1 µM PP242 – an mTOR inhibitor – for the indicated times (note that panel B shows a tighter time course in comparison to panel A). At the end of this treatment the samples were lysed and immunoblotted for S6K phospho T389 in order to ascertain the speed by which S6K became de-phosphorylated upon mTOR inhibition. (C) A model for mTORC1 transiently translocating to the lysosomal surface and then phosphorylating some of its substrates in the cytosol. Our data are consistent with the idea that soon after amino acid replenishment the mTORC1 complex translocates to the lysosome but it then comes off the lysosomes at later time points while still active towards its substrates. DOI: http://dx.doi.org/10.7554/eLife.19960.014
Figure 6.
Figure 6.. Dynamics of RAPTOR-GFP translocation to lysosomes containing a fluorescent amino acid analogue.
(A) Cells – parental HAP-1 or those expressing RAPTOR-GFP – were kept in normal medium (Iscove’s modified DMEM plus 10% FBS) or starved of amino acids and growth factors for 60’ in medium containing salts and 1% dialysed FBS. The cells were then re-stimulated for 20’ either with normal growth medium (Isc) or with a mixture of non-essential (NE) amino acids and growth factors (GF) added to the starvation medium and also containing in some samples 0.1 mM LLOMe or 0.4 mM fluorescent analogue (FA) as indicated. After lysis and electrophoresis the samples were immunoblotted for S6K phospho T389 and ULK1 phospho S757 as indicated. (B) HAP-1 cells expressing RAPTOR-GFP were starved and re-stimulated as indicated above, but with the addition in some cases of 0.4 mM arginine (R) as indicated. After lysis and electrophoresis the samples were immunoblotted for S6K phospho T389 and ULK1 phospho S757 as indicated. (CE) HAP-1 cell expressing RAPTOR-GFP were transfected with plasmids encoding mRFP-LAMP2 for 24 hr and then moved to a microscope stage for live imaging experiments. After 5’ in starvation medium, the cells were stimulated with medium containing NE amino acids, growth factors, arginine and the fluorescent analogue as described in (B) above. Images were captured every 10’’. Selected frames are shown in the three channels and as an overlay for panel C. Bar represents 10 µm. Only the GFP and fluorescent analogue channels are shown for (DE). (F) The number of puncta containing RAPTOR-GFP upon stimulation with amino acids and growth factors (aa’s) or with the fluorescent leucine analogue (FA) were counted in each cell using the Spots Detection function of Imaris software (Bitplane/Andor), and the average of all cells in each condition is plotted here. The plot also contains the number of puncta containing the fluorescent analogue (FA puncta) during the stimulation. The response to the fluorescent analogue comes from a total of 125 cells measured from seven different coverslips, each with 3 different regions of interest. Although not shown here for clarity reasons, the standard deviation for each measurement is comparable to that shown in Figure 5B and D. The amino acid response shown here comes from 59 cells and only the early points are shown for clarity. Because of the smaller number of cells this part of the plot is more bumpy than the ones shown in Figure 5 but the kinetics were remarkably similar. DOI: http://dx.doi.org/10.7554/eLife.19960.016
Figure 6—figure supplement 1.
Figure 6—figure supplement 1.. A leucine-based fluorescent analogue that can activate mTORC1.
(A) Chemical structures of leucine and various analogues examined here. (B) Steps in the chemical synthesis of the fluorescent analogue. (C) HEK-293 cells were kept in normal medium (fed), starved of amino acids and growth factors (starved) or re-stimulated with starvation medium containing individual amino acids and analogues as indicated for 20’. After lysis and electrophoresis the samples were immunoblotted for S6K phospho T389. Asterisk indicates irrelevant band serving as loading control. (D) HEK-293 cells as above were starved and re-stimulated with a mixture of MEM amino acids (aa) or 0.4 mM fluorescent analogue in the presence or absence of concanamycin A for the indicated times. After lysis and electrophoresis the samples were immunoblotted for S6K phosphoT389. Asterisk indicates irrelevant band serving as loading control. (E) HEK-293 cells stably expressing mRFP-LAMP2 were moved to a microscope stage for live imaging experiments. After 2’ in starvation medium, fluorescent analogue was added. In some samples, concanamycin A was added for 5’ before the addition of the fluorescent anaIogue and then throughout the rest of the experiment. Images were captured every 10 s and selected frames are shown in the two channels and as an overlay. The bar represents 10 µm. DOI: http://dx.doi.org/10.7554/eLife.19960.018
Figure 7.
Figure 7.. Activation of mTORC1 in HAP-1 RAPTOR-GFP cells and in HEK-293 cells depends on Sestrin2 and intact lysosomes.
(A) HAP-1 cells expressing RAPTOR-GFP were treated with siRNA against Sestrin2 or with a non-targetting control (NT) as indicated. After 72 hr, cells were kept in normal medium (Iscove’s modified Dulbecco’s medium -IMDM plus 10% FBS) or starved of amino acids and growth factors for 60’ in medium containing salts and 1% dialysed FBS. The starved cells were then re-stimulated for 10’, 20’ or 30’ with a mixture of amino acids and growth factors (aa) or with fluorescent analogue (fa) added to the starvation medium as indicated. After lysis and electrophoresis the samples were immunoblotted for the indicated proteins. The intensity of the S6K phospho T389 band is plotted in the graphs. This experiment is representative of two. (B) The same experiment as in A was done with HEK-293 cells. This experiment is representative of two. (C) HAP-1 cells expressing RAPTOR-GFP were kept in normal medium or starved and re-stimulated for 20’ and 30’ with amino acids and growth factors (aa) or with fluorescent analogue (FA) in the presence or absence of GPN as indicated. After lysis and electrophoresis the samples were immunoblotted for the indicated proteins. (D) Cells as in C were loaded with lysotracker or with fluorescent analogue (FA) for 30’ during aa re-stimulation in the presence or absence of GPN as indicated. After fixation the cells were examined by fluorescence microscopy. (E) HEK-293 cells were kept in normal medium or starved and re-stimulated for 20’ with MEM amino acids (aa) or with fluorescent analogue (FA) in the presence or absence of GPN as indicated. After lysis and electrophoresis the samples were immunoblotted for the indicated proteins. (F) Cells as in E were loaded with lysotracker or with fluorescent analogue (FA) for 20’ during aa re-stimulation in the presence or absence of GPN as indicated. After fixation the cells were examined by fluorescence microscopy. The bar in all panels represents 10 µm. DOI: http://dx.doi.org/10.7554/eLife.19960.020
Figure 7—figure supplement 1.
Figure 7—figure supplement 1.. Properties of the fluorescent leucine analogue in mTORC1 activation.
(A) HEK-293 cells were starved of amino acids and growth factors, and re-stimulated for the indicated times with MEM amino acids in the presence or absence of concanamycin A (2 µM) or EIPA (100 µM) as indicated. After lysis and electrophoresis the samples were immunoblotted for the indicated proteins. The intensity of the S6K phospho T389 band is plotted in the graph. Data from 3 experiments. (B) Experiment as in A, but samples were stimulated with 0.4 mM di-leucine methyl ester in the absence of any other addition. (C) Samples as in A and B but stimulated with 0.4 mM fluorescent analogue on its own in the presence of absence of 100 µM EIPA as indicated. All graphs represent n = 3. Values represent mean ± SEM. DOI: http://dx.doi.org/10.7554/eLife.19960.021
Author response image 1.
DOI: http://dx.doi.org/10.7554/eLife.19960.022

References

    1. Araki N. Labeling of endocytic vesicles using fluorescent probes for fluid-phase endocytosis. In: Celis JE, editor. Cell Biology: A Laboratory Handbook. Academic Press; 2006. - DOI
    1. Auer TO, Duroure K, De Cian A, Concordet JP, Del Bene F. Highly efficient CRISPR/Cas9-mediated knock-in in zebrafish by homology-independent DNA repair. Genome Research. 2014;24:142–153. doi: 10.1101/gr.161638.113. - DOI - PMC - PubMed
    1. Bar-Peled L, Chantranupong L, Cherniack AD, Chen WW, Ottina KA, Grabiner BC, Spear ED, Carter SL, Meyerson M, Sabatini DM. A tumor suppressor complex with GAP activity for the Rag GTPases that signal amino acid sufficiency to mTORC1. Science. 2013;340:1100–1106. doi: 10.1126/science.1232044. - DOI - PMC - PubMed
    1. Bar-Peled L, Sabatini DM. Regulation of mTORC1 by amino acids. Trends in Cell Biology. 2014;24:400–406. doi: 10.1016/j.tcb.2014.03.003. - DOI - PMC - PubMed
    1. Bar-Peled L, Schweitzer LD, Zoncu R, Sabatini DM. Ragulator is a GEF for the rag GTPases that signal amino acid levels to mTORC1. Cell. 2012;150:1196–1208. doi: 10.1016/j.cell.2012.07.032. - DOI - PMC - PubMed

Publication types

MeSH terms

Substances