. 2016 Oct 11:5:e18816.
doi: 10.7554/eLife.18816.

An excitatory cortical feedback loop gates retinal wave transmission in rodent thalamus

Affiliations

An excitatory cortical feedback loop gates retinal wave transmission in rodent thalamus

Yasunobu Murata et al. Elife. .

Abstract

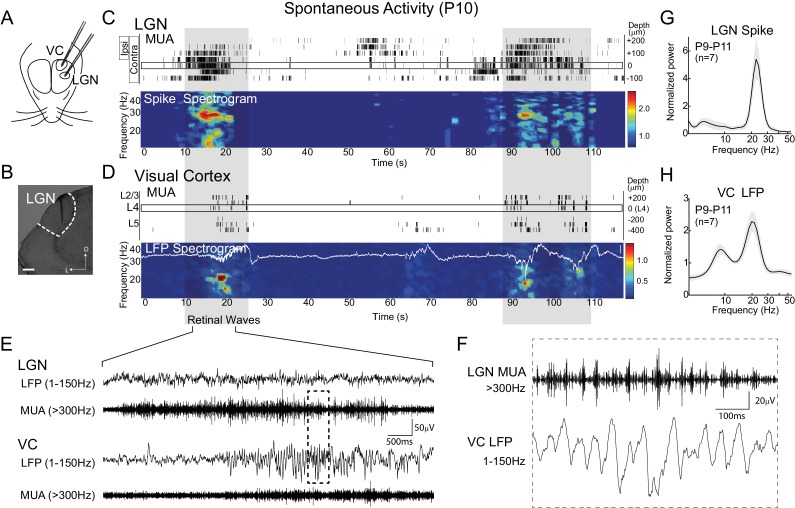
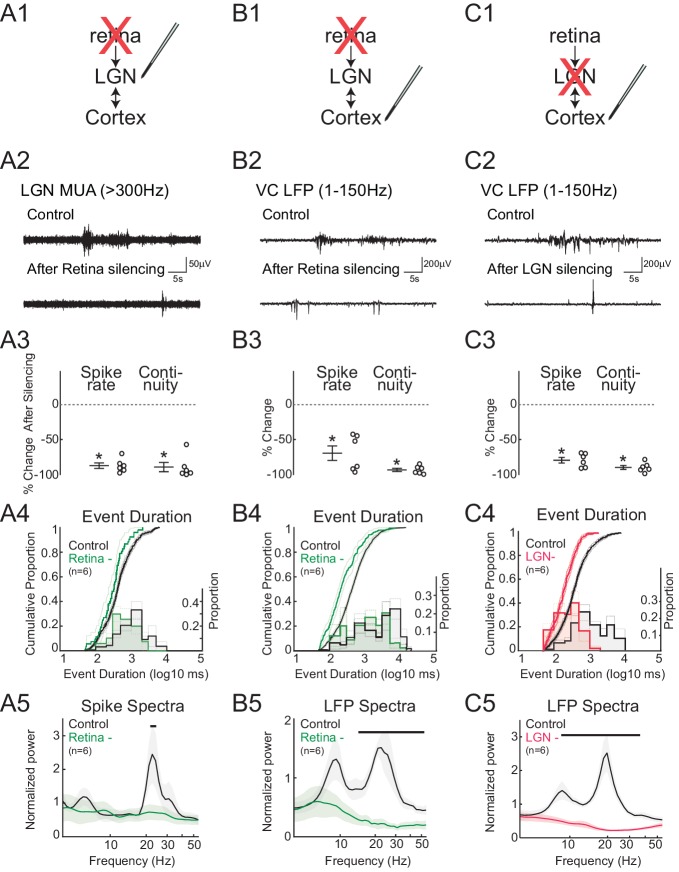
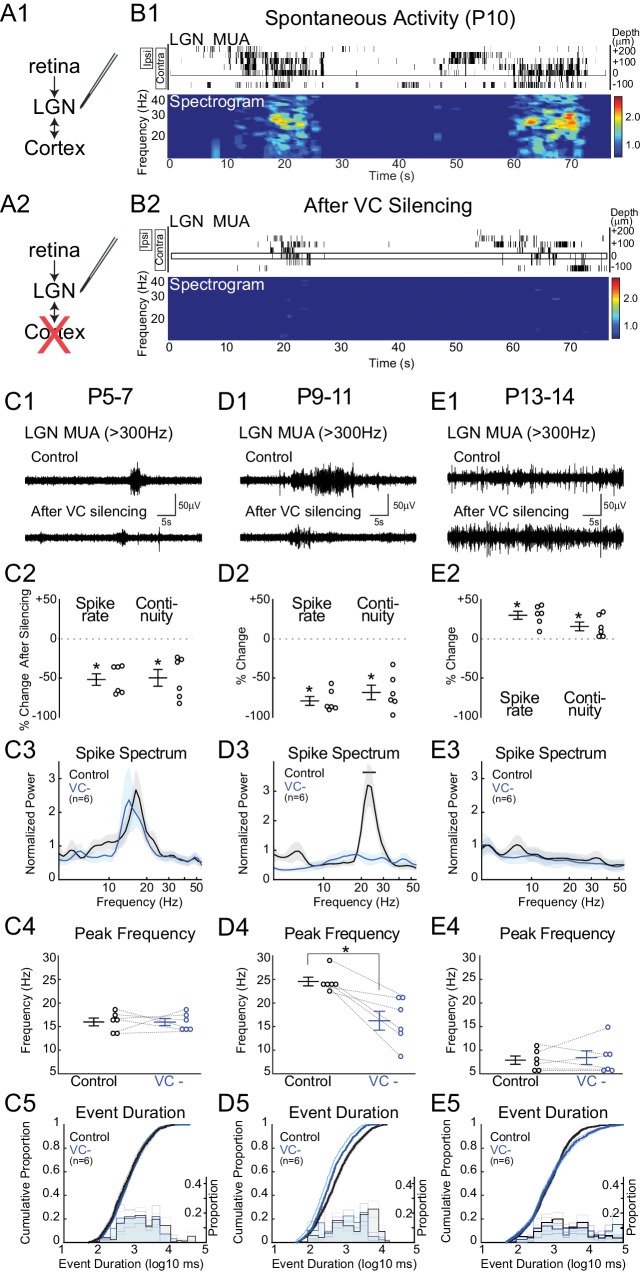
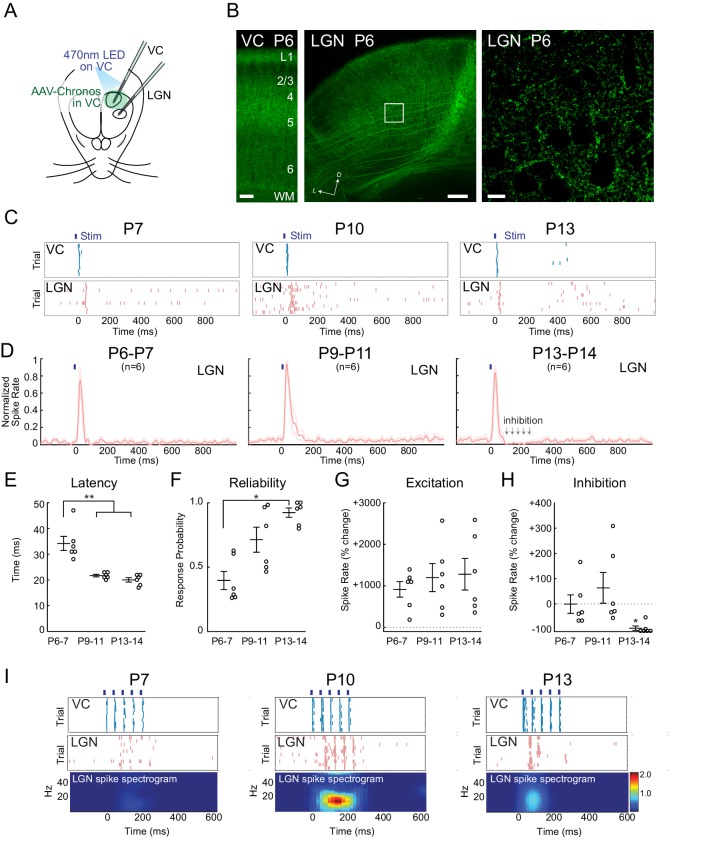
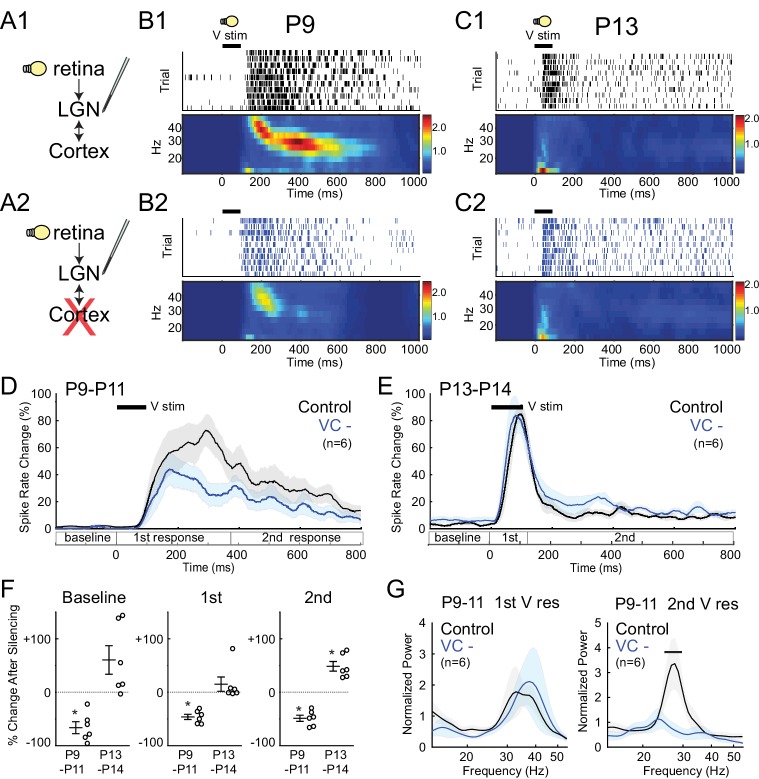
Spontaneous retinal waves are critical for the development of receptive fields in visual thalamus (LGN) and cortex (VC). Despite a detailed understanding of the circuit specializations in retina that generate waves, whether central circuit specializations also exist to control their propagation through visual pathways of the brain is unknown. Here we identify a developmentally transient, corticothalamic amplification of retinal drive to thalamus as a mechanism for retinal wave transmission in the infant rat brain. During the period of retinal waves, corticothalamic connections excite LGN, rather than driving feedforward inhibition as observed in the adult. This creates an excitatory feedback loop that gates retinal wave transmission through the LGN. This cortical multiplication of retinal wave input ends just prior to eye-opening, as cortex begins to inhibit LGN. Our results show that the early retino-thalamo-cortical circuit uses developmentally specialized feedback amplification to ensure powerful, high-fidelity transmission of retinal activity despite immature connectivity.

Keywords: EEG; activity depedent development; neuroscience; oscillations; plasticity; rat; retinal waves.


Conflict of interest statement

The authors declare that no competing interests exist.

Figures

Figure 1.
Figure 1.. Thalamic spindle-burst oscillations are transmitted to visual cortex.
(A) Experimental setup. Simultaneous recordings from visual thalamus (lateral geniculate nucleus, LGN) and primary monocular visual cortex (VC) were acquired with two single shank multi-electrode arrays in awake, head-fixed rats. (B) Reconstructed electrode track in LGN. Scale bar: 100 µm (C) Representative spontaneous activity in LGN of a P10 rat. Raster plot shows multi-unit spiking (MUA) from contacts separated by 50 µm. Eye specificity of each channel is shown by box on left. Spike spectrogram shows frequency of MUA modulation for LGN channel with maximal contralateral visual response (rectangle at 0 µm). Long-duration spiking events previously shown to result from retinal waves (Colonnese and Khazipov, 2010), marked by grey shadding, are associated with elevation in beta-band frequencies in LGN and VC, referred to a spindle-burst oscillations. (D) Representative spontaneous activity in VC simultaneously recorded with (C). Raster plots show MUA at multiple depths. Local field potential (LFP) recording in L4 is plotted on LFP-derived spectrogram. Elevations in beta-band frequencies (spindle-bursts) are associated with similar activities in LGN. Scale bar is 200 µV. (E) LFP (1–150 Hz) and MUA (>300 Hz) in LGN and VC during the retinal wave shown in (C) and (D) at expanded time scale. (F) LGN MUA (>300 Hz) and VC LFP (1–150 Hz) during a retinal wave shown in (E) at expanded time scale. (G) Population mean of normalized LGN spike spectra for P9-P11 (n = 7). Grey shading is standard error of the mean. (H) Population mean of normalized VC LFP spectra for P9-P11 (n = 7). DOI: http://dx.doi.org/10.7554/eLife.18816.003
Figure 2.
Figure 2.. Spindle-burst oscillations require retinal and thalamic activity.
(A) Blockade of spontaneous retinal waves reduces thalamic firing and spindle-burst oscillations. (A1) Ocular injection of glutamate receptor antagonists APV and CNQX to silence retinal activity with simultaneous recording in LGN. (A2) Representative LGN MUA (>300 Hz) before (control) and after retinal silencing. (A3) Percent change in multi-unit spike rate and continuity of activity during retinal blockade (n = 6, Wilcoxon signed-rank test for difference from pre-silence, p=0.0313, p=0.0313). Spike continuity is calculated as the proportion of periods containing at least two spikes with interval of less than 500 ms. (A4) Analysis of event duration. Cumulative distribution is shown in solid lines (left y-axis). 95% confidence interval (CI) is shown as shaded area (n = 856 and n = 52, two sample KS test, p=0.0193). Proportion distribution is additionally plotted as a bar graph to aid visualization of event duration (right y-axis). (A5) Population mean of normalized spike spectra. Silencing retina reduced spindle-burst frequencies (n = 6, permutation test, p<0.05 between 23.9–25.5 Hz, bar = frequencies significantly different by permutation test). (B) Silencing retinal activity reduces cortical firing and spindle-burst oscillations. (B15) As for A15 but for L4 of VC (B2: VC LFP (1–150 Hz); B3: n = 6, Wilcoxon signed-rank test, p=0.0313, p=0.0313; B4: n = 1109 and 189, two sample KS test, p=10–12; B5: n = 6, permutation test, p<0.05 between 14.4–54.6 Hz). (C) Silencing thalamic activity with muscimol while recording in VC. (C15) As for B15. Larger reduction in spontaneous firing, event duration and spectral power than for retinal silencing suggests residual activity in thalamocortical loop after retinal silencing can generate small amounts of spindle-burst activity. (C2: VC LFP (1–150 Hz); C3: n = 6, Wilcoxon signed-rank test, p=0.0313, p=0.0313; C4: n = 811 and 377, two sample KS test, p=10–22; C5: n = 6, permutation test, p<0.05 between 8.6–42.5 Hz). All error bars are SEM unless noted. DOI: http://dx.doi.org/10.7554/eLife.18816.004
Figure 3.
Figure 3.. Corticothalamic feedback amplifies retinal waves in thalamus.
(A) Experimental set-up: silencing VC with local application of APV and CNQX while recording in LGN. (B) Representative spontaneous activity in LGN before (B1) and after VC silencing in a P10 rat (B2). LGN MUA rasters and spike-rate spectrogram as for Figure 1. (C1) Representative LGN MUA (>300 Hz) before (control) and after VC silencing at P5-7. (C2) Percent change in multi-unit spike rate and continuity of activity after VC silencing during cholinergic retinal waves (P5-7). VC silencing reduces LGN spiking as early as P5 (n = 6 each, Wilcoxon signed-rank test for difference from pre-silencing, p=0.0313, p=0.0313). (C3) Population mean of normalized LGN spike spectra. Note no change in frequency distribution despite decreased spike rates at P5-7 (permutation test, p>0.05 at all frequency ranges). (C4) Peak of spike frequency distribution (Wilcoxon signed-rank test, p=0.8750). (C5) Event duration distributions before and after VC silencing (n = 1727 and 728, two sample KS test, p=0.1975). (D) Effects of VC silencing during glutamatergic waves (P9-11) (n = 6). (D15) as for C15 (D2: Wilcoxon signed-rank test, p=0.0313, p=0.0313; D3: permutation test, p<0.05 between 19.8–27.2 Hz; D4: Wilcoxon signed-rank test, p=0.0313; D5: n = 1549 and 773, two sample KS test, p=10–9). Note large decrease in spindle-oscillation power and peak frequency in LGN following VC silencing. (E) Effects of VC silencing after retinal wave period (P13-14) (n = 6). (E15) as for C15 (E2: Wilcoxon signed-rank test, p=0.0313 p=0.0313; E3: permutation test, p>0.05 at all frequency ranges; E4: Wilcoxon signed-rank test, p=0.8750; E5: n = 1785 and 1129, two sample KS test, p=0.0029). Note absence of effect on spike spectra, and increase, in contrast to the decreases until P11, in spike rate, continuity and event duration in LGN following VC silencing at P13-14. DOI: http://dx.doi.org/10.7554/eLife.18816.005
Figure 4.
Figure 4.. Increasing reliability and recruitment of inhibition transforms corticothalamic function.
(A) Experimental setup: Optogenetic stimulation of VC neurons expressing Chronos-GFP while simultaneously recording in LGN and VC. AAV-Chronos-GFP was injected into VC at P0-1. (B) Representative images of Chronos-GFP expression in the VC and Chronos-GFP expressing corticothalamic axons in LGN at P6. Scale bars: 100, 100 and 10 µm. (C) Representative MUA rasters for 10 trials with LGN responses at each age. (D) Population mean post-stimulus time histogram of LGN spiking (n = 6 for each age group). At P6-11 VC optogenetic stimulation evokes purely excitatory responses in LGN, while in P13-14 animals initial excitation is followed by inhibition. (E) Population mean delay between LGN and VC spike onset (Kruskal-Wallis test, P6-7 vs P9-11 p=0.0020, P6-7 vs P13-14 p=0.0058, P9-11 vs P13-14 p=0.6247). (F) Population mean reliability: percentage of trials in which VC spike activity produced LGN spike activity (Kruskal-Wallis test, p=0.1744, 0.0057, 0.3960). (G) Population mean of spike-rate change in LGN following VC stimulation (1–100 ms after stim) (Wilcoxon signed-rank test vs baseline, P6-7: p=0.0313, P9-11: p=0.0313, P13-14: p=0.0313). (H) Population mean spike-rate change in LGN during inhibitory period (100–250 ms after stim). Significant inhibition is observed only at P13-14 (Wilcoxon signed-rank test vs baseline, P6-7: p=0.6563, P9-11: p=0.8438, P13-14: p=0.0313). (I) Cortical stimulation at spindle-burst frequencies (20 Hz) induces oscillations in LGN only at P9-11. VC stimulation at 20 Hz caused firing in LGN at all ages, but entrained LGN only at P9-11. DOI: http://dx.doi.org/10.7554/eLife.18816.006
Figure 5.
Figure 5.. Corticothalamic feedback required for spindle-burst oscillations but not early-gamma oscillations.
(A) Visually evoked MUA responses were measured in LGN before (A1) and after (A2) VC silencing. Visual stimulus was 100 ms flash. (B) Representative evoked LGN MUA before (B1) and after VC silencing (B2) in a P9 rat. Before VC silencing, visual responses consists of an initial (first) early-gamma oscillation (EGO), followed by a spindle-burst (second), as observed in VC (Colonnese et al., 2010). After VC silencing, EGOs remain, but spindle-bursts oscillations are reduced. (C) Representative visual responses at P13 before (C1) and after VC silencing (C2). Note disappearance of EGOs and spindle-burst in LGN after P13 as observed in VC (Colonnese et al., 2010). (D) Population mean post-stimulus spike rate histogram for P9-11 (n = 6). Spike rates are reduced by VC silencing both during primary (EGO) and secondary (spindle-burst) responses. (E) Population mean post-stimulus spike rate histogram for P13-14 (n = 6). LGN spike-rates are increased by VC silencing at P13-14, in contrast to decrease after VC silencing at P9-11. (F) Population mean change in LGN spike-rate caused by VC silencing in the baseline (left), primary visual (first, middle) and secondary visual (second, right) responses for both age groups. (P9-11, n = 6, Wilcoxon signed-rank test for difference from pre-silencing, baseline: p=0.0313, first: 0.0313, second: 0.0313; P13-14, n = 6, p=0.0625, 0.4375, 0.0313). (G) Normalized LGN spike spectra for first (left) and second (right) visual response at P9-11. Despite reductions in spike rate for both responses, only spindle-burst frequencies (second) are reduced by VC silencing (n = 6, bar = frequencies significantly different by permutation test, first: p>0.05 at all frequency ranges, second: p<0.05 at 26.7–31.7 Hz). DOI: http://dx.doi.org/10.7554/eLife.18816.007

Comment in

  • Catching a wave.
    Fogerson PM, Huguenard JR. Fogerson PM, et al. Elife. 2016 Oct 11;5:e21236. doi: 10.7554/eLife.21236. Elife. 2016. PMID: 27725090 Free PMC article.

Similar articles

Cited by

References

    1. Ackman JB, Burbridge TJ, Crair MC. Retinal waves coordinate patterned activity throughout the developing visual system. Nature. 2012;490:219–225. doi: 10.1038/nature11529. - DOI - PMC - PubMed
    1. Ackman JB, Crair MC. Role of emergent neural activity in visual map development. Current Opinion in Neurobiology. 2014;24:166–175. doi: 10.1016/j.conb.2013.11.011. - DOI - PMC - PubMed
    1. Aggelopoulos N, Parnavelas JG, Edmunds S. Synaptogenesis in the dorsal lateral geniculate nucleus of the rat. Anatomy and Embryology. 1989;180:243–257. doi: 10.1007/BF00315883. - DOI - PubMed
    1. Allène C, Cattani A, Ackman JB, Bonifazi P, Aniksztejn L, Ben-Ari Y, Cossart R. Sequential generation of two distinct synapse-driven network patterns in developing neocortex. Journal of Neuroscience. 2008;28:12851–12863. doi: 10.1523/JNEUROSCI.3733-08.2008. - DOI - PMC - PubMed
    1. André M, Lamblin M-D, d’Allest AM, Curzi-Dascalova L, Moussalli-Salefranque F, Nguyen The Tich S, Vecchierini-Blineau M-F, Wallois F, Walls-Esquivel E, Plouin P. Electroencephalography in premature and full-term infants. Developmental features and glossary. Neurophysiologie Clinique/Clinical Neurophysiology. 2010;40:59–124. doi: 10.1016/j.neucli.2010.02.002. - DOI - PubMed

Publication types

LinkOut - more resources