. 2016 Oct 11:5:e18313.
doi: 10.7554/eLife.18313.

Diabetes regulates fructose absorption through thioredoxin-interacting protein

Affiliations

Diabetes regulates fructose absorption through thioredoxin-interacting protein

James R Dotimas et al. Elife. .

Abstract

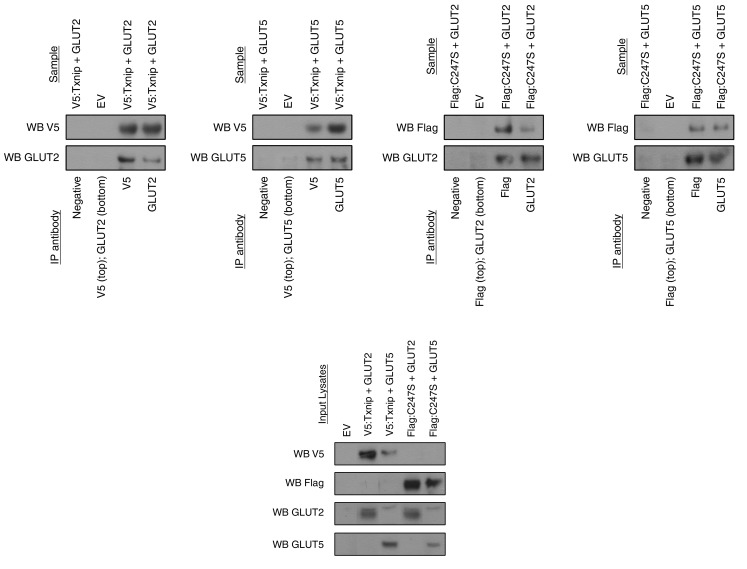
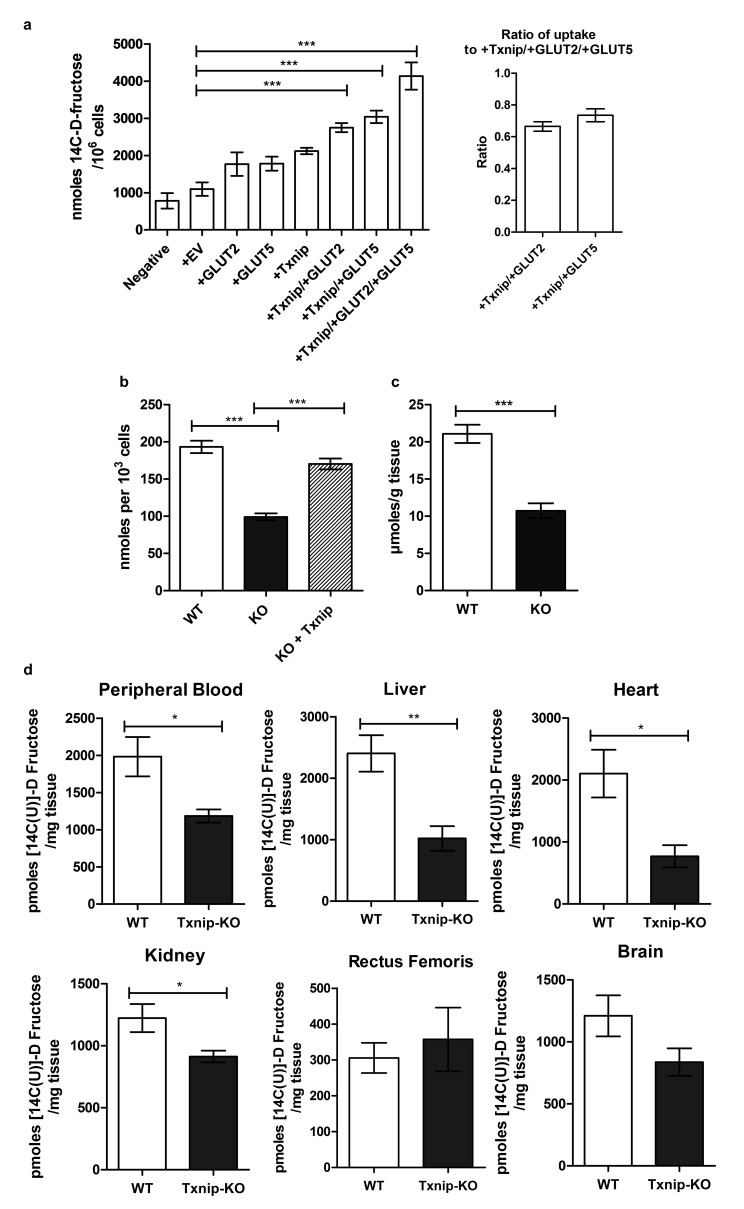
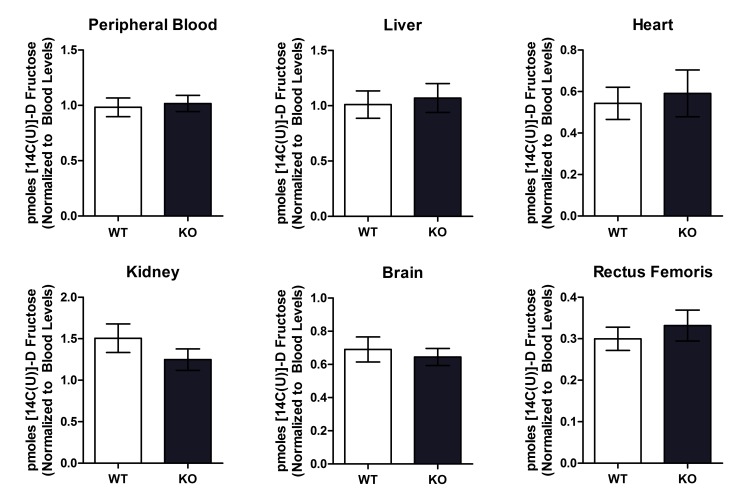
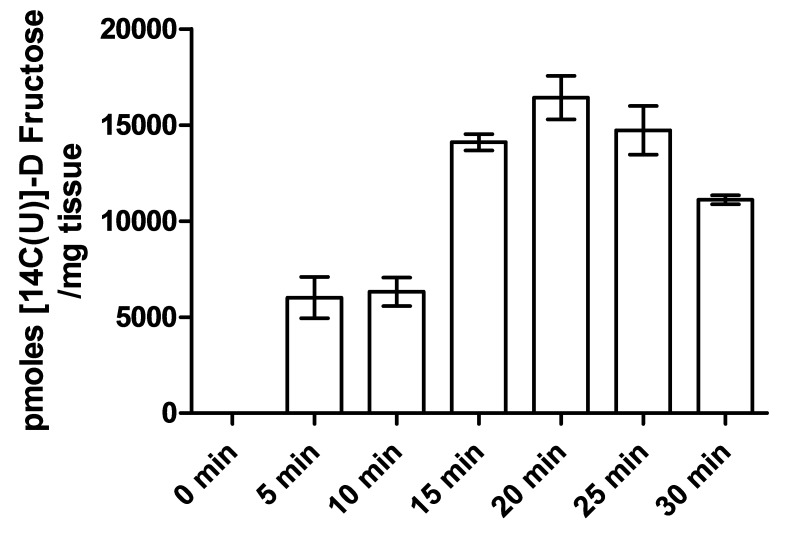
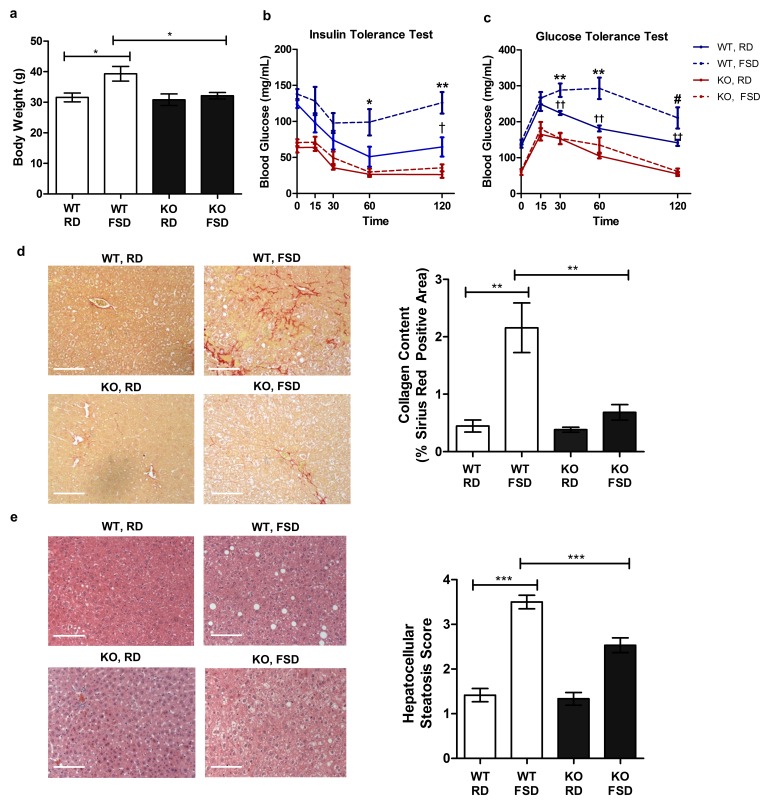
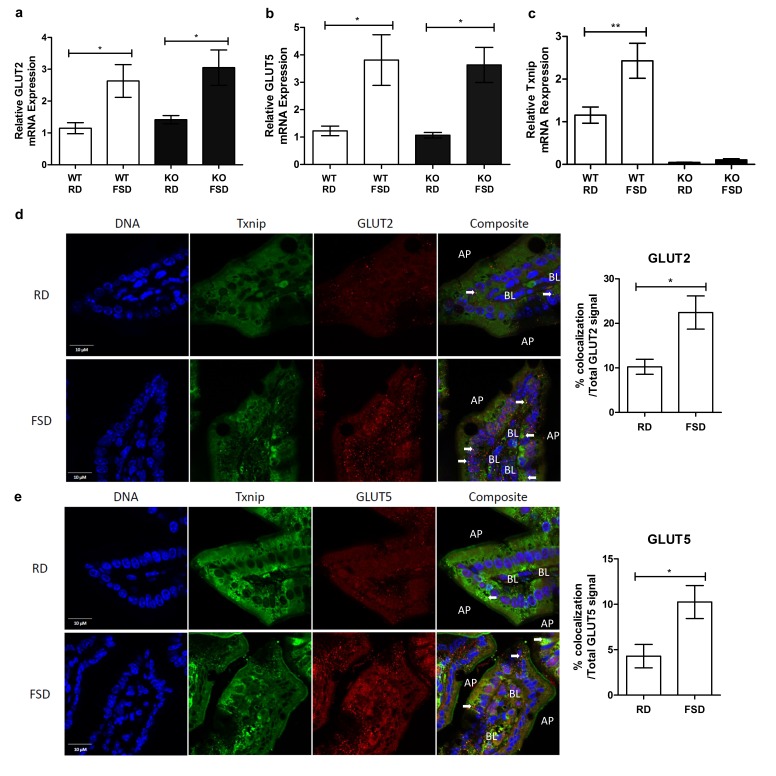
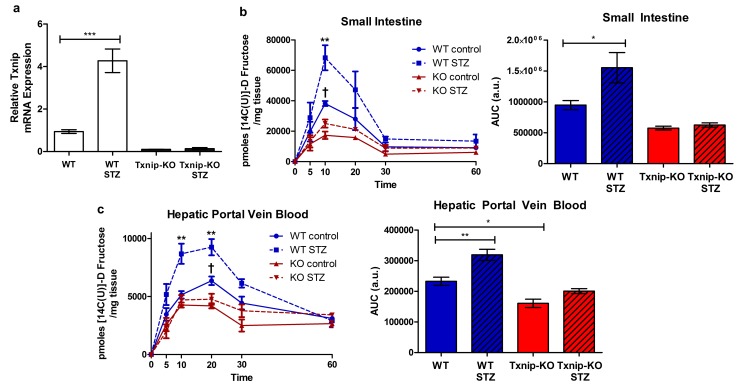
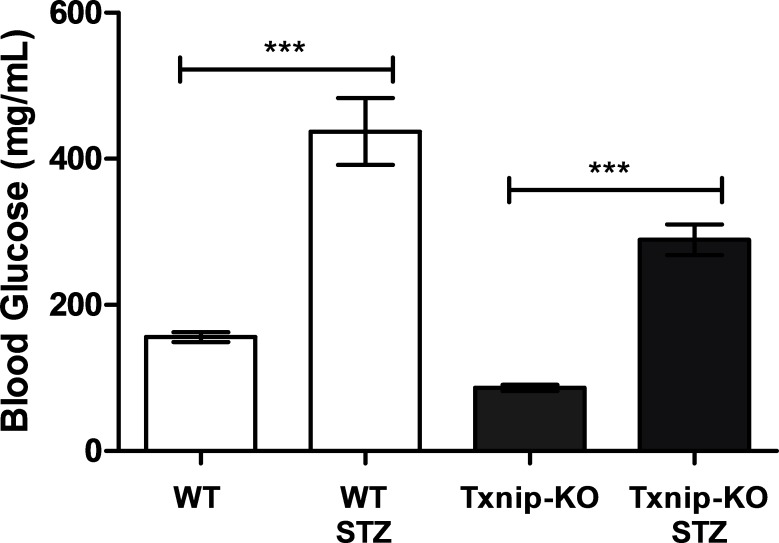
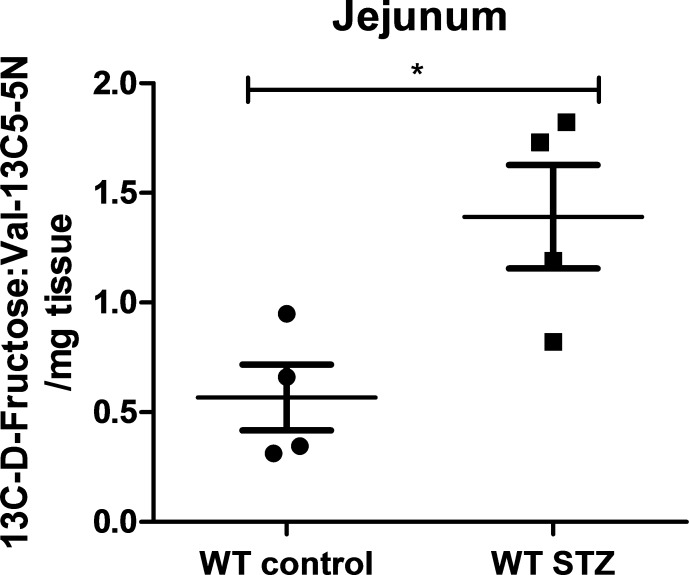
Metabolic studies suggest that the absorptive capacity of the small intestine for fructose is limited, though the molecular mechanisms controlling this process remain unknown. Here we demonstrate that thioredoxin-interacting protein (Txnip), which regulates glucose homeostasis in mammals, binds to fructose transporters and promotes fructose absorption by the small intestine. Deletion of Txnip in mice reduced fructose transport into the peripheral bloodstream and liver, as well as the severity of adverse metabolic outcomes resulting from long-term fructose consumption. We also demonstrate that fructose consumption induces expression of Txnip in the small intestine. Diabetic mice had increased expression of Txnip in the small intestine as well as enhanced fructose uptake and transport into the hepatic portal circulation. The deletion of Txnip in mice abolished the diabetes-induced increase in fructose absorption. Our results indicate that Txnip is a critical regulator of fructose metabolism and suggest that a diabetic state can promote fructose uptake.

Keywords: GLUT2; GLUT5; Txnip; biochemistry; cell biology; diabetes; fructose; metabolism; mouse.


Conflict of interest statement

The authors declare that no competing interests exist.

Figures

Figure 1.
Figure 1.. Txnip binds to GLUT2 and GLUT5 independently of its thioredoxin-interacting cysteine.
hTXNIP-V5 or its C247S-flag mutated form were co-expressed with either hGLUT5 or hGLUT2 in HEK293 cells. Cellular lysates were captured using antibodies that were then bound to Protein A/G agarose beads. The input and captured complexes were then immunoblotted for the proteins of interest. The results indicate that Txnip binds to both GLUT2 and GLUT5 and that the Txnip mutant C247S, which abolishes the molecular interaction between Txnip and thioredoxin, can still bind GLUT5 and GLUT2. DOI: http://dx.doi.org/10.7554/eLife.18313.003
Figure 2.
Figure 2.. Txnip promotes cellular fructose uptake and fructose absorption by the small intestine.
(a) Empty vector (EV) or TXNIP, with GLUT2 and/or GLUT5, was transiently transfected in Caco-2 cells. Simultaneous TXNIP-overexpression with either GLUT2 or GLUT5 overexpression induced an increase in cellular fructose uptake relative to EV-transfected cells while the greatest increase in uptake was observed in cells overexpressing TXNIP with both GLUT2 and GLUT5. There was no significant difference in uptake in cells overexpressing TXNIP with GLUT2 in comparison to cells overexpressing TXNIP with GLUT5 (n = 6). (b) High passage mouse embryonic fibroblasts (MEFs) from Txnip-KO animals had decreased cellular fructose uptake compared with cells from wild type mice, which was restored by transfecting TXNIP in the same cell line (n = 6). (c) Jejunum from Txnip-knockout mice is able to transport less fructose from intestinal lumen when exposed to [14C(U)]-D fructose compared to small intestine from wild type mice. (n = 4). (d) Following administration of a [14C(U)]-D fructose bolus via oral gavage, Txnip-knockout mice exhibit reduced 14C signal in the blood compared to wild type mice. Other organs, including the liver, kidney, and heart, showed the same trend of reduced 14C signal in Txnip-knockout mice relative to wild-type mice, though the signal in kidney and heart was lower than that of blood. There was no observed difference in the skeletal muscle or brain within the parameters of the experiment (n = 4). *p<0.05, **p<0.01, ***p<0.001. Data represent mean ± SEM. DOI: http://dx.doi.org/10.7554/eLife.18313.005
Figure 2—figure supplement 1.
Figure 2—figure supplement 1.. Wild type and Txnip-null mouse had no difference in organ 14C D-fructose uptake following intravenous injection.
Mice were injected with 14C D-fructose through tail-vein injection. Tissues were collected and measured for 14C signal 30 min after the injection, and 14C signal was normalized to levels found in the peripheral bloodstream. There was no observed difference in 14C D-fructose signal in any of the tissues. (n = 8 for all groups). DOI: http://dx.doi.org/10.7554/eLife.18313.008
Figure 2—figure supplement 2.
Figure 2—figure supplement 2.. Determination of oral gavage single time point.
Levels of 14C were measured in the peripheral blood collected from wild type mice following several time points after oral gavage. The maximum signal was observed in mice after 20 min, which was used in downstream oral gavage experiments. All points were significantly different from the 0 min time point (n = 3). DOI: http://dx.doi.org/10.7554/eLife.18313.009
Figure 3.
Figure 3.. Txnip-knockout mice exhibit less severe metabolic outcomes associated with chronic fructose consumption.
Mice were fed a moderate fat diet supplemented with 30% (wt/vol) fructose water for 25 weeks. (a) In comparison with the control diet, fructose induced significant increases in body weight in wild type (WT) but not in Txnip-KO mice. (b and c) Intraperitoneal glucose and insulin tests were performed. WT animals developed significant glucose and insulin intolerance following prolonged high fructose diet. Txnip-KO mice were resistant to these effects. (d and e) Histological analysis of the liver sections. (d) Txnip-KO liver had observably less fibrosis after fructose consumption compared with WT. (e) Fructose diet induced significant steatosis in WT mice that was reduced in Txnip-KO mice. (n = 5 per group). *p<0.05. For Glucose Tolerance Test and Insulin Tolerance Test: *p<0.05 and **p<0.01 WT, RD vs WT, FSD; †p<0.05 and ††p<0.01 WT, RD vs. KO, RD. #p<0.05 WT, RD vs. KO, FSD and p<0.01 vs WT, RD. Scale bar; 50 µm. Data represent mean ± SEM. DOI: http://dx.doi.org/10.7554/eLife.18313.010
Figure 4.
Figure 4.. Txnip expression is induced by fructose consumption and interacts with GLUT2 and GLUT5.
(ac) Quantitative RT-PCR analysis of jejunum isolated from mice used in the fructose supplemented diet experiment. (a and b) Mice on the FSD had significantly higher mRNA expression of GLUT2 and GLUT5 in the jejunum (n = 6 for WT, RD and WT, FDS groups; n = 5 for KO, RD and KO, FSD groups). (c) Mice on the FSD had higher relative mRNA expression of Txnip in the small intestine (n = 6 for WT, RD and WT, FDS groups; n = 5 for KO, RD and KO, FSD groups). (d) Confocal analysis of small intestine sections stained for Txnip and GLUT2 revealed co-localization of the two proteins, with more co-localizing signal in FSD mice (n = 4 for each group). (e) Confocal analysis of small intestine sections stained for Txnip and GLUT5 revealed co-localization of the two proteins, with more co-localizing signal in FSD mice (n = 4 for each group). *p<0.05, **p<0.01. AP = apical membrane, BL = basolateral membrane, white arrows point to co-localizing signal, scale bar represents 10 µM. Data represent mean ± SEM. DOI: http://dx.doi.org/10.7554/eLife.18313.012
Figure 5.
Figure 5.. Hyperglycemia promotes Txnip expression and fructose absorption by the small intestine.
(a) STZ-injected wild type mice have higher Txnip expression in the small intestine relative to control mice. (n = 4 for all groups). (b and c) 14C-radiolabeled D-fructose levels were measured in WT and Txnip-KO STZ-injected and buffer controls over time. Following an oral gavage, tissues were collected at 5, 10, 20, 30, 60 min post-gavage for analysis (n = 4 for all groups at each time point). (b) There was a significant increase in 14C fructose uptake by the whole small intestine in WT STZ-injected mice compared to the non-diabetic controls at 10 min post-gavage as well as a reduction in uptake in Txnip-KO non-diabetic mice compared to WT non-diabetic mice. There was no difference at any time point between Txnip-KO STZ-injected animals and their non-diabetic counterparts. Comparing overall levels of 14C fructose uptake, there was an increase in 14C fructose uptake in WT STZ-injected mice compared to the non-diabetic controls, while this increase was abolished in the Txnip-KO mice. (c) There was a significant increase in 14C fructose signal in the hepatic portal vein blood in WT STZ-injected mice relative to the non-diabetic controls at both 10 and 20 min post-gavage. There was also a decrease in 14C fructose signal in Txnip-KO non-diabetic mice compared to WT non-diabetic mice. When comparing overall levels of 14C fructose signal, there was a significant increase in WT STZ-injected mice compared to the non-diabetic controls; this difference was not observed between the Txnip-KO groups. ***p<0.001. For fructose absorption data: **p<0.01 WT control vs. WT STZ, †p<0.05 WT control vs. KO control. Data represent mean ± SEM. DOI: http://dx.doi.org/10.7554/eLife.18313.016
Figure 5—figure supplement 1.
Figure 5—figure supplement 1.. STZ-injection induces hyperglycemia in mice.
Wild type mice injected with streptozotocin had a higher blood glucose level relative to control mice. Even though Txnip-KO mice have a lower basal blood glucose level relative to wild type mice, STZ-injection induced an observable increase in blood glucose levels in Txnip-KO mice. (n = 8). ***p<0.001. Data represents mean ± SEM. DOI: http://dx.doi.org/10.7554/eLife.18313.020
Figure 5—figure supplement 2.
Figure 5—figure supplement 2.. 13C-labeled D-fructose measurements in wild-type non-diabetic and STZ-injected mice.
LC-MS analysis of 13C D-fructose in jejunum isolated from WT non-diabetic and STZ-injected mice. There was an increase in the normalized peak area of 13C D-fructose in jejunum isolated from STZ-injected mice in comparison to the non-diabetic controls. (n = 4 for each group). *p<0.05. Data represents mean ± SEM. DOI: http://dx.doi.org/10.7554/eLife.18313.021

Comment in

References

    1. Abdelmalek MF, Suzuki A, Guy C, Unalp-Arida A, Colvin R, Johnson RJ, Diehl AM, Nonalcoholic Steatohepatitis Clinical Research Network Increased fructose consumption is associated with fibrosis severity in patients with nonalcoholic fatty liver disease. Hepatology. 2010;51:1961–1971. doi: 10.1002/hep.23535. - DOI - PMC - PubMed
    1. Asano T, Katagiri H, Tsukuda K, Lin JL, Ishihara H, Yazaki Y, Oka Y. Upregulation of GLUT2 mRNA by glucose, mannose, and fructose in isolated rat hepatocytes. Diabetes. 1992;41:22–25. doi: 10.2337/diab.41.1.22. - DOI - PubMed
    1. Burant CF, Takeda J, Brot-Laroche E, Bell GI, Davidson NO. Fructose transporter in human spermatozoa and small intestine is GLUT5. Journal of Biological Chemistry. 1992;267:14523–14526. - PubMed
    1. Burgess K, Xu T, Brown R, Han B, Welle S. Effect of myostatin depletion on weight gain, hyperglycemia, and hepatic steatosis during five months of high-fat feeding in mice. PLoS One. 2011;6:e18313. doi: 10.1371/journal.pone.0017090. - DOI - PMC - PubMed
    1. Cha-Molstad H, Saxena G, Chen J, Shalev A. Glucose-stimulated expression of Txnip is mediated by carbohydrate response element-binding protein, p300, and histone H4 acetylation in pancreatic beta cells. Journal of Biological Chemistry. 2009;284:16898–16905. doi: 10.1074/jbc.M109.010504. - DOI - PMC - PubMed

Publication types