. 2016 Oct 11:7:13050.
doi: 10.1038/ncomms13050.

Cancer-associated fibroblast-secreted CXCL16 attracts monocytes to promote stroma activation in triple-negative breast cancers

Affiliations

Cancer-associated fibroblast-secreted CXCL16 attracts monocytes to promote stroma activation in triple-negative breast cancers

Roni Allaoui et al. Nat Commun. .

Abstract

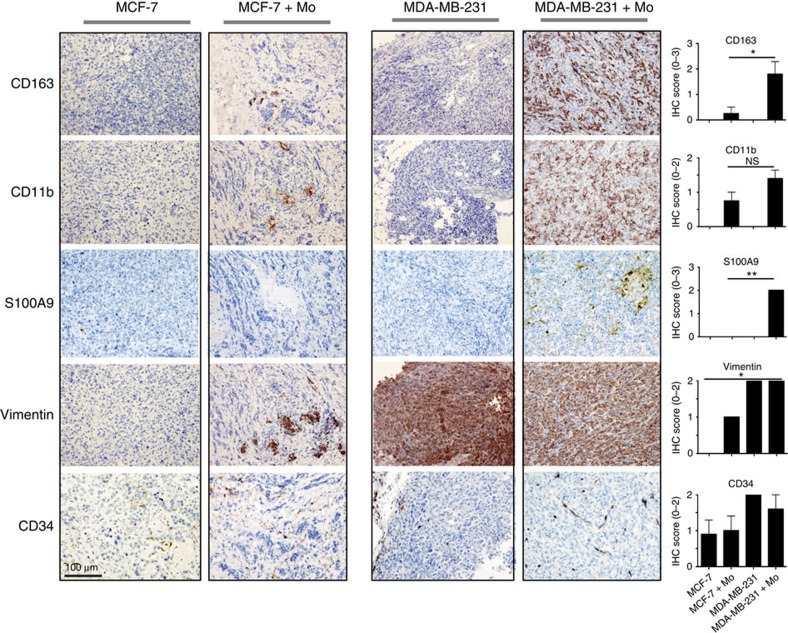
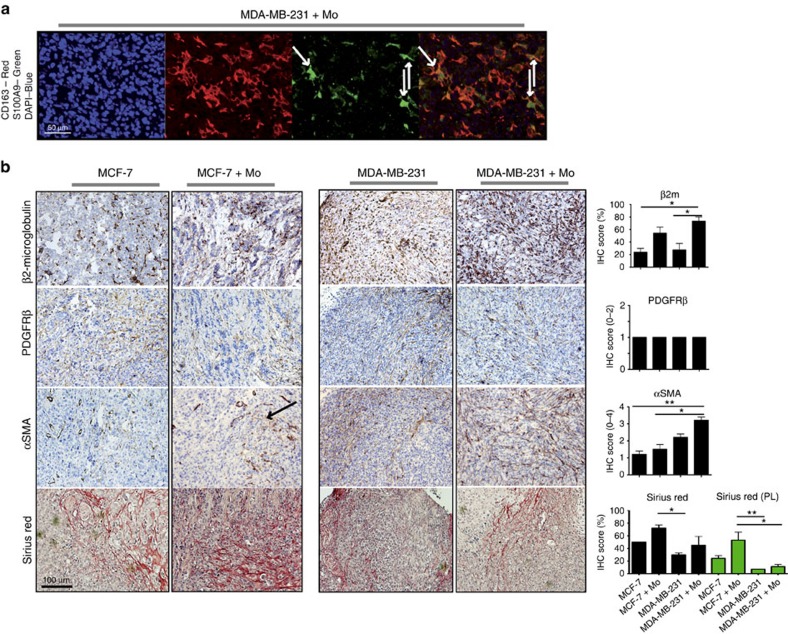
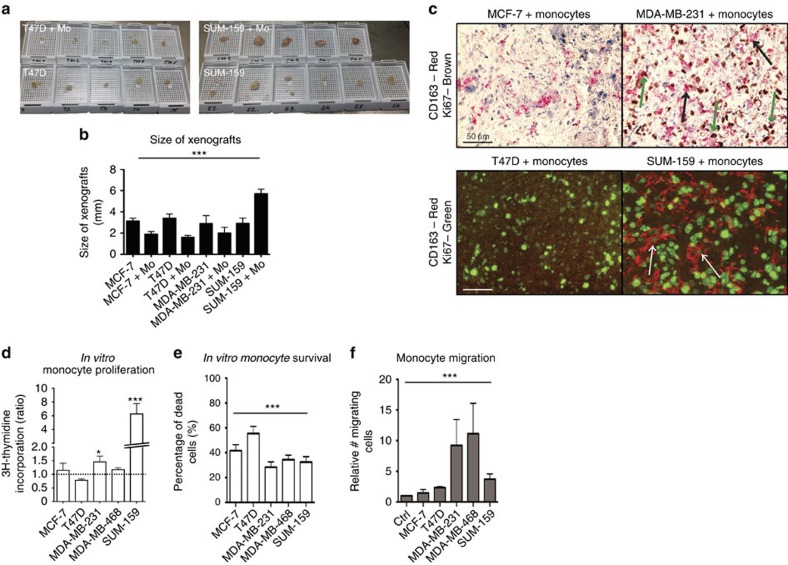
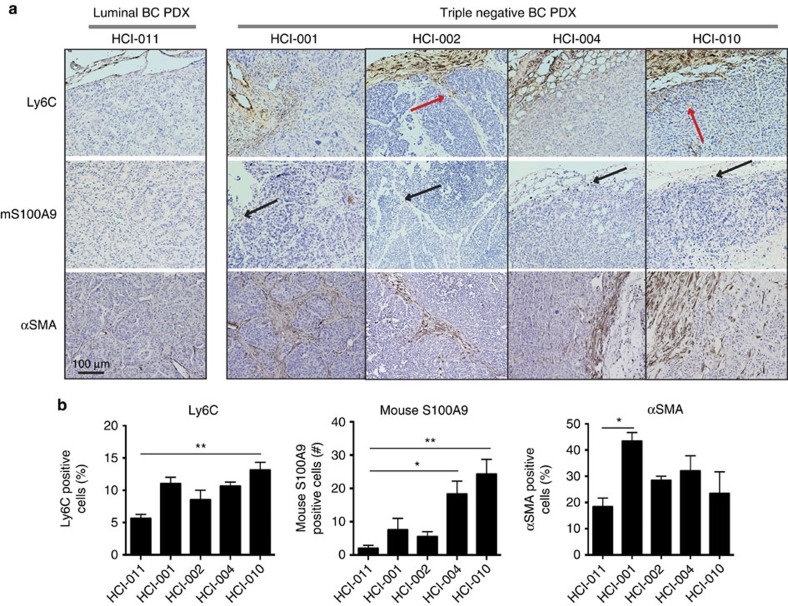
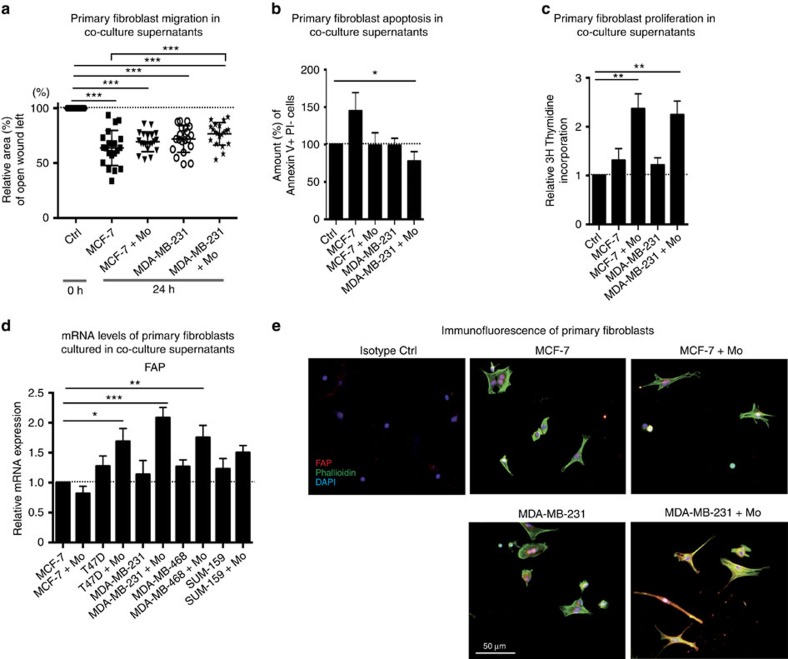
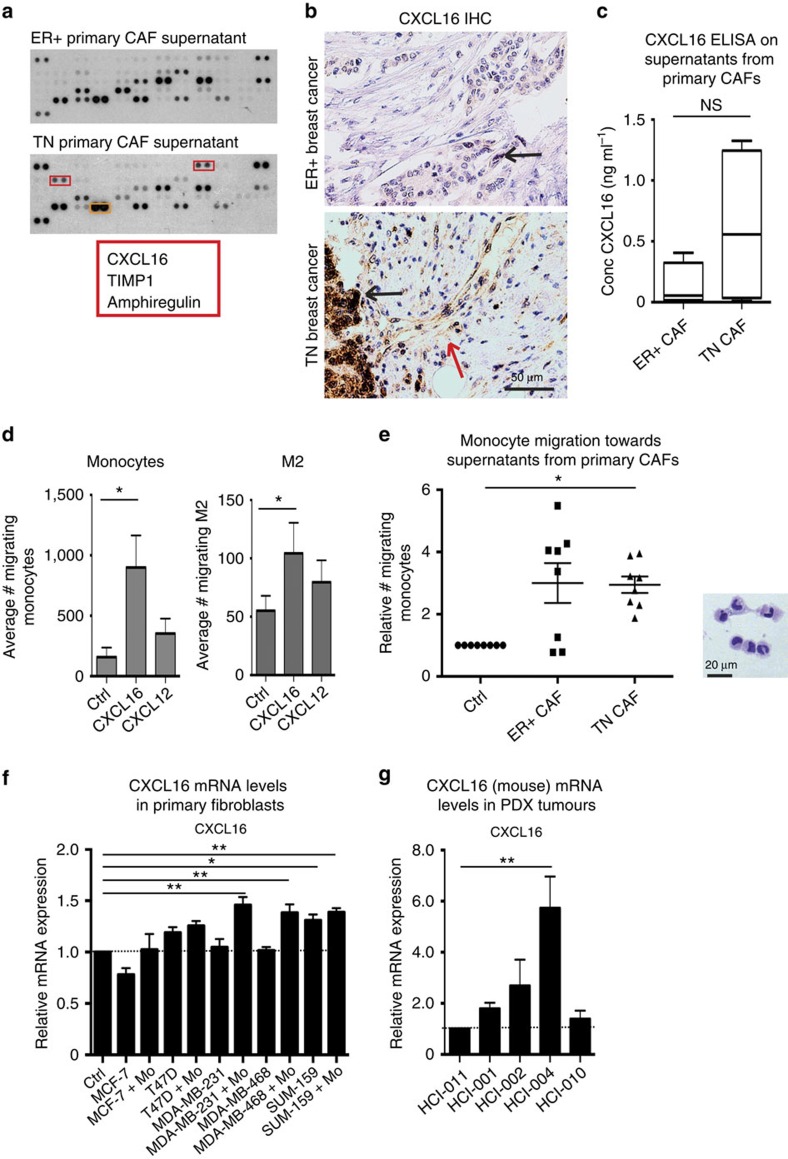
Triple-negative (TN) breast cancers (ER-PR-HER2-) are highly metastatic and associated with poor prognosis. Within this subtype, invasive, stroma-rich tumours with infiltration of inflammatory cells are even more aggressive. The effect of myeloid cells on reactive stroma formation in TN breast cancer is largely unknown. Here, we show that primary human monocytes have a survival advantage, proliferate in vivo and develop into immunosuppressive myeloid cells expressing the myeloid-derived suppressor cell marker S100A9 only in a TN breast cancer environment. This results in activation of cancer-associated fibroblasts and expression of CXCL16, which we show to be a monocyte chemoattractant. We propose that this migratory feedback loop amplifies the formation of a reactive stroma, contributing to the aggressive phenotype of TN breast tumours. These insights could help select more suitable therapies targeting the stromal component of these tumours, and could aid prediction of drug resistance.


Figures

Figure 1
Figure 1. IHC of xenografts.
Tumour xenografts consisting of TN MDA-MB-231 breast cancer cells co-transplanted with primary human monocytes, express more myeloid-related and immunosuppressive markers than luminal A MCF-7/monocyte xenografts. The xenografts were grown in highly immunodeficient NSG-mice (see ‘Methods' section), and sections from the tumours were stained with myeloid (CD163, CD11b, S100A9) tumour (vimentin) and endothelial markers (CD34). The two cell lines chosen are negative for S100A9 (ref. 21). IHC was performed using the indicated antibodies. All histological sections were counterstained with HE. N=5 mice were analysed for each group; MCF-7 grafts were analysed on day 21 and 90 post-graft with similar results—day 90 is shown here; TN MDA-MB-231 grafts were grown to day 21 only. The histograms show the mean value for each IHC score with statistical analyses. IHC scores are shown in Supplementary Table 1. *=P<0.05, **=P<0.01 ANOVA non-parametric Kruskal–Wallis test. N=5. Error bars indicate s.e.m.
Figure 2
Figure 2. IHC of xenografts.
Tumour xenografts consisting of TN MDA-MB-231 breast cancer cells co-transplanted with primary human monocytes, express more activated stromal markers than luminal A MCF-7/monocyte xenografts. Xenografts were grown in highly immunodeficient NSG-mice (see ‘Methods' section). (a) Immunofluorescence staining of CD163 (TRITC, red) and S100A9 (FITC, green) in sections from MDA-MB-231/monocytes xenograft tumours (day 21). DAPI (blue) shows nuclear staining. Overlay of colours is shown in lower right panel. S100A9 expression is located in the CD163+ human myeloid co-transplanted cells. White arrows indicate three cells with co-expression of CD163+ and S100A9. The cell lines are negative for S100A9 (ref. 21). (b) IHC was performed using the indicated antibodies and histological stains. All histological sections were counterstained with HE. N=5 mice were analyzed for each group; The black arrows indicate activated stroma. MCF-7 grafts were analysed on day 21 and 90 post-graft with similar results—day 90 is shown here; TN MDA-MB-231 grafts were grown to day 21 only. The histograms show the mean value for each IHC score with statistical analyses. IHC scores are shown in Supplementary Table 1. *=P<0.05, **=P<0.01 ANOVA non-parametric Kruskal–Wallis test. N=5. Error bars indicate s.e.m.
Figure 3
Figure 3. Characterization of primary monocytes in TNBC cultures.
Primary human monocytes show increased proliferation, survival and migration in a TNBC/monocyte environment than in a Luminal A/monocyte context. (a,b) The size of the xenografts differed between groups. Co-transplantation of monocytes generally decreased the tumour size slightly (b) except in the TN SUM-159/monocyte group, co-transplantation of monocytes (SUM-159+Mo) increased tumour growth significantly (a,b). ***=P<0.001 ANOVA. N=5. (c) Myeloid cells proliferate in vivo. Upper panel: Double staining IHC of CD163 and Ki67 in xenografts from MCF-7/monocytes co-transplant (left) or MDA-MB-231/monocyte co-transplants (right) tumours as indicated. Black arrows show single staining with only CD163 and green arrows show double staining. Lower panel: Double staining immunofluorescence of CD163 and Ki67 in xenografts from T47D/monocytes co-transplant (left) or SUM-159/monocyte co-transplants (right) tumours as indicated. White arrows show CD163+ cells with a clear nuclear Ki67 staining. (d) Proliferation of primary human monocyte cultured in control medium or in conditioned medium from different cell lines, was assessed using the thymidine incorporation assay. *=P<0.05 ANOVA. N=14. (e) Survival of isolated human primary monocytes in breast cancer cell conditioned medium, grown for 7 days, was assessed. Annexin V staining was performed to analyse the total content of apoptotic/dead cells. ***=P<0.001. ANOVA. N=5. Error bars indicate s.e.m. (f) Boyden chamber migration assay of primary human monocytes migrating towards control medium or MCF-7, T47D, MDA-MB-231, MDA-MB-468 or SUM-159 breast cancer cell conditioned medium. ***=P<0.001 ANOVA. N=5. Error bars indicate s.e.m.
Figure 4
Figure 4. IHC of PDXs.
PDXs from TN breast tumours show increased myeloid cell infiltration, expression of S100A9 and activated fibroblasts. PDXs from one luminal (HCI-011) and four TN (HCI-001, HCI-002, HCI-004 and HCI-010) breast cancers grown in non-obese diabetic-severe combined immunodeficiency (NOD-SCID) mice were analysed for presence of monocytes (Ly6C mouse specific), expression of mouse S100A9 (mouse specific) and activated fibroblast (αSMA; recognizes human and mouse). (a) Ly6C positive cells were present in the tumour borders, with some cells infiltrating the stromal areas in particular (red arrows). Mouse S100A9 positive cells were present in the tumour borders and areas where myeloid cells were also present, and importantly mainly in the TN PDX grafts (black arrows). αSMA was expressed in the stromal areas of the PDX grafts, representing activated fibroblasts. (b) Quantitation of the immunohistochemical stains as presented by the histograms showing the mean value for each protein. For each PDX graft, 2–4 sections were stained and scored (N=3–6). For αSMA and Ly6C the percentage (%) of positive cells was scored and for mouse S100A9 the numbers (n) of infiltrating cells expressing S100A9 was scored. A significantly higher level of Ly6C positive cells (left), of mouse S100A9 positive cells (center) and of αSMA (right) was seen in the TN PDX grafts as compared with the luminal PDX graft. *=P<0.05 ***=P<0.001. ANOVA non-parametric Kruskal–Wallis test. N=(3–6). Error bars indicate s.e.m.
Figure 5
Figure 5. Characterization of primary fibroblasts in TNBC cultures.
Primary mouse fibroblasts are activated by monocytes in the TNBC context in vitro. (a) Scratch wound assays showing mouse primary fibroblast migration in supernatants derived from co-cultures of human primary monocytes (Mo) and luminal A (MCF-7) or TN (MDA-MB-231) breast cancer cells. ***=P<0.001 ANOVA non-parametric Kruskal–Wallis test. N=20. (b) Survival analysis of mouse primary fibroblast grown in supernatants derived from co-cultures of human primary monocytes and luminal A (MCF-7) or TN (MDA-MB-231) breast cancer cells. Annexin V staining was used to analyse the percentage of apoptotic cells. *=P<0.05 ANOVA. N=10. (c) Proliferation of mouse primary fibroblasts grown in supernatants derived from co-cultures of human primary monocytes and luminal A (MCF-7) or TN (MDA-MB-231) breast cancer cells, measured using a thymidine incorporation proliferation assay. **=P<0.01. ANOVA Dunnett's multiple comparison test. N=14. (d) mRNA expression levels of FAP in mouse primary fibroblasts cultured in supernatants derived from co-cultures of human primary monocytes and luminal A (MCF-7 and T47D) or TN (MDA-MB-231, MDA-MB-468 and SUM-159) breast cancer cells, assessed by RT-QPCR analysis. *=P<0.05 **=P<0.01 ***=P<0.001 ANOVA Dunnett's multiple comparison test. N=4. (e) Immunofluorescence of anti-fibroblast activation protein (FAP; red), phalloidin to stain actin filaments (green) and DAPI (nuclear stain; blue) in primary mouse fibroblasts cultured in supernatants derived from co-cultures of primary human monocytes and luminal A (MCF-7) or TN (MDA-MB-231) breast cancer cells. Scale bar represents 50 μm. Error bars indicate s.e.m.
Figure 6
Figure 6. CXCL16 expression is induced in fibroblasts by myeloid cells.
(a) Human angiogenesis array proteome profiler of supernatants from primary CAFs derived from ER+ or ERPRHer2 (triple negative; TN) tumours. (b) IHC of CXCL16 in human primary breast cancers. Upper panel shows ER+PR+ breast cancer and lower panel one TNBC. Black arrow highlights CXCL16 expressing malignant cells and red arrow, CXCL16 expressing fibroblasts. (c) The levels of secreted CXCL16 were measured using a human CXCL16 ELISA performed on supernatants prepared from primary human CAFs isolated from TN or ER+ primary breast tumours. N=4 TN and N=8 ER+. Mann–Whitney U-test. (d) Migration of primary human monocytes (left) or M2 macrophages (right) was measured using Boyden migration chambers with 8 μm pore size towards control medium (Ctrl), recombinant CXCL16 or CXCL12 as a control. *=P<0.05. ANOVA Dunn's multiple comparisons test. N=5 and N=14. (e) Migration of primary human monocytes (left) or M2 macrophages (right) was measured using Boyden migration chambers with 8 μm pore size towards control medium (Ctrl), or towards conditioned medium from primary human CAFs derived from either ER+ or TN tumours. *=P<0.05 **=P<0.01. ANOVA Dunn's multiple comparisons test. N=8. The HE image (right) shows that the migrated cells are indeed monocytes and the scale bar represents 20 μm. (f) RT-QPCR analysis of CXCL16 levels in primary mouse fibroblasts cultured in either control medium (Ctrl) or supernatants derived from luminal A (MCF-7 and T47D) or TN (MDA-MB-231, MDA-MB-468 and SUM-159) breast cancer cells with or without co-culture with primary human monocytes (Mo). *=P<0.05 **=P<0.01. ANOVA Dunn's multiple comparisons test. N=4–8. Error bars indicate s.e.m. (g) RT-QPCR analysis of infiltrating mouse cell CXCL16 levels in human PDX tumours derived from one luminal (HCI-011; set to 1) and four TN (HCI-001, 002, 004, 010) breast tumours. **=P<0.01. ANOVA Dunn's multiple comparisons test. N=6–7. Error bars indicate s.e.m.
Figure 7
Figure 7. Gene expression profile in human breast cancers.
Human basal breast cancers have an immunosuppressive gene expression profile. (a) Box plots showing log2 gene expression levels of indicated genes in molecular breast cancer subtypes, using TCGA breast cancer RNAseq data. P values were calculated using a t-test comparing levels between basal-like tumours and luminal A tumours. The middle line demonstrates the median, the box illustrates the interquartile range, and the whiskers indicate the most extreme data point that is not >1.5 × the interquartile range away from the box. Data points beyond these values are individually shown. (b) Schematic to model the effects exerted by myeloid cells on stroma formation in TN breast tumours. Myeloid cells are recruited to TN breast tumours by proteins including CCL2, GM-CSF, IL-8, S100A9 and CXCL16, where they are induced to express CD163 and the immunosuppressive factors S100A9 and collagen VI. Furthermore, in a TN environment, the myeloid cells activate CAFs and induce expression of CXCL16 by the fibroblasts, which, in turn, can recruit more myeloid cells and fibroblasts. The activated stroma in combination with the presence of anti-inflammatory myeloid cells, will render the TN tumours a more aggressive behaviour.

References

    1. Sorlie T. et al. Gene expression patterns of breast carcinomas distinguish tumour subclasses with clinical implications. Proc. Natl Acad. Sci. USA 98, 10869–10874 (2001). - PMC - PubMed
    1. Gierach G. L., Burke A. & Anderson W. F. Epidemiology of triple negative breast cancers. Breast Dis. 32, 5–24 (2010). - PMC - PubMed
    1. de Kruijf E. M. et al. Tumor-stroma ratio in the primary tumour is a prognostic factor in early breast cancer patients, especially in triple-negative carcinoma patients. Breast Cancer Res. Treat. 125, 687–696 (2011). - PubMed
    1. Medrek C., Ponten F., Jirstrom K. & Leandersson K. The presence of tumour associated macrophages in tumour stroma as a prognostic marker for breast cancer patients. BMC Cancer 12, 306 (2012). - PMC - PubMed
    1. Moorman A. M., Vink R., Heijmans H. J., van der Palen J. & Kouwenhoven E. A. The prognostic value of tumour-stroma ratio in triple-negative breast cancer. Eur. J. Surg. Oncol. 38, 307–313 (2012). - PubMed

Publication types

MeSH terms