. 2016 Oct 11:7:13087.
doi: 10.1038/ncomms13087.

Increased global transcription activity as a mechanism of replication stress in cancer

Affiliations

Increased global transcription activity as a mechanism of replication stress in cancer

Panagiotis Kotsantis et al. Nat Commun. .

Abstract

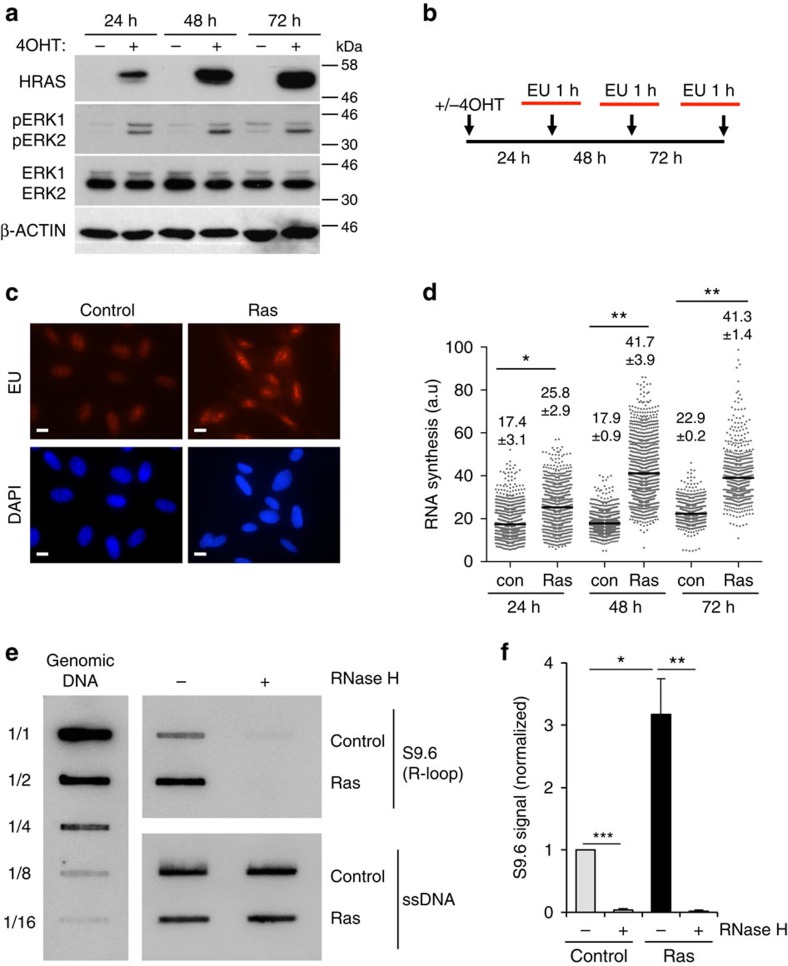
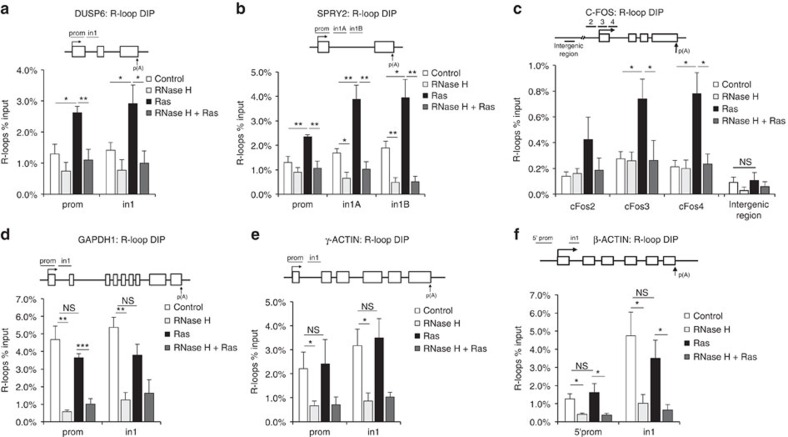
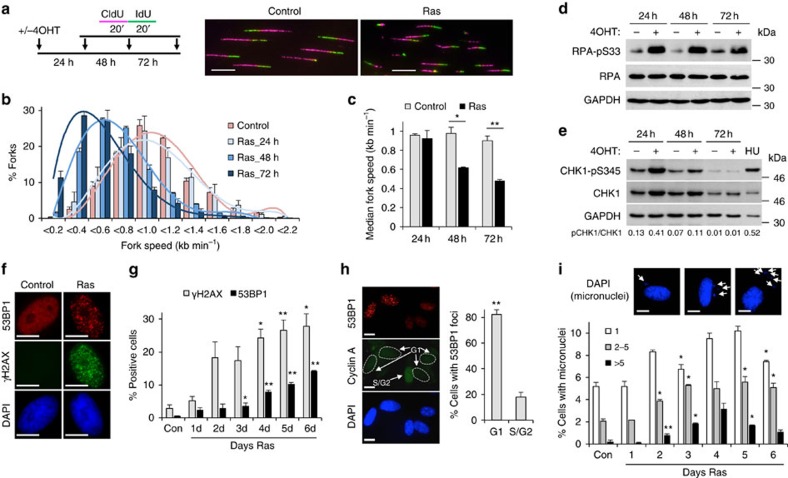
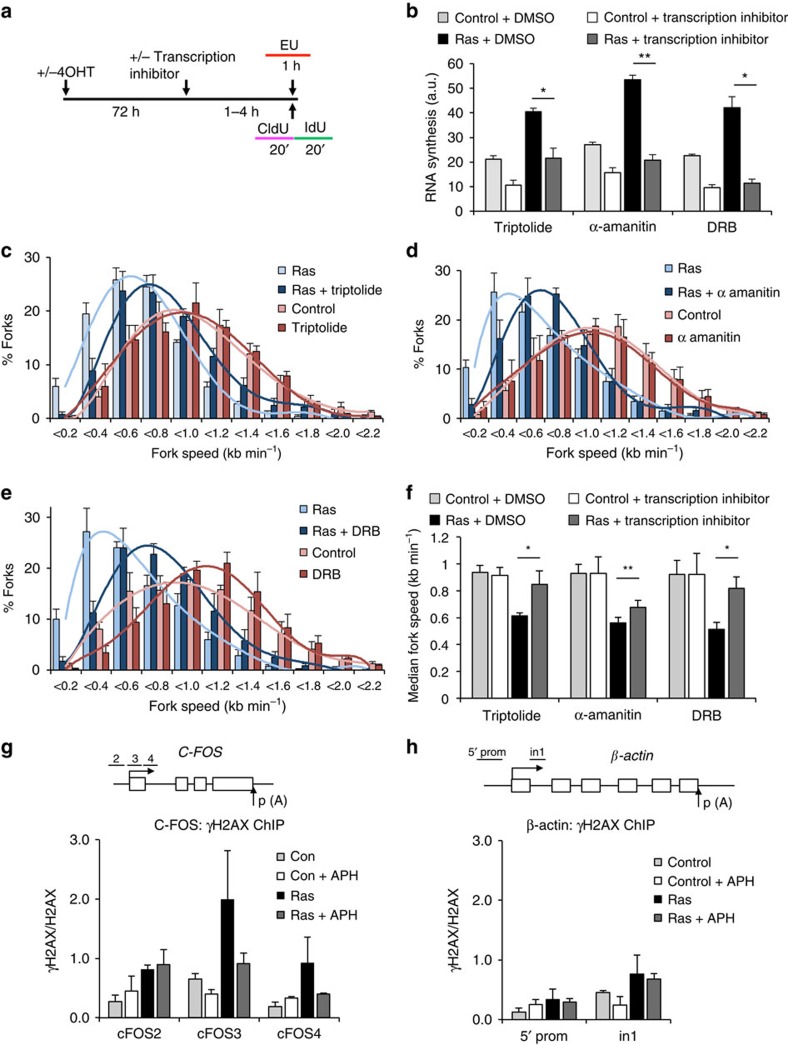
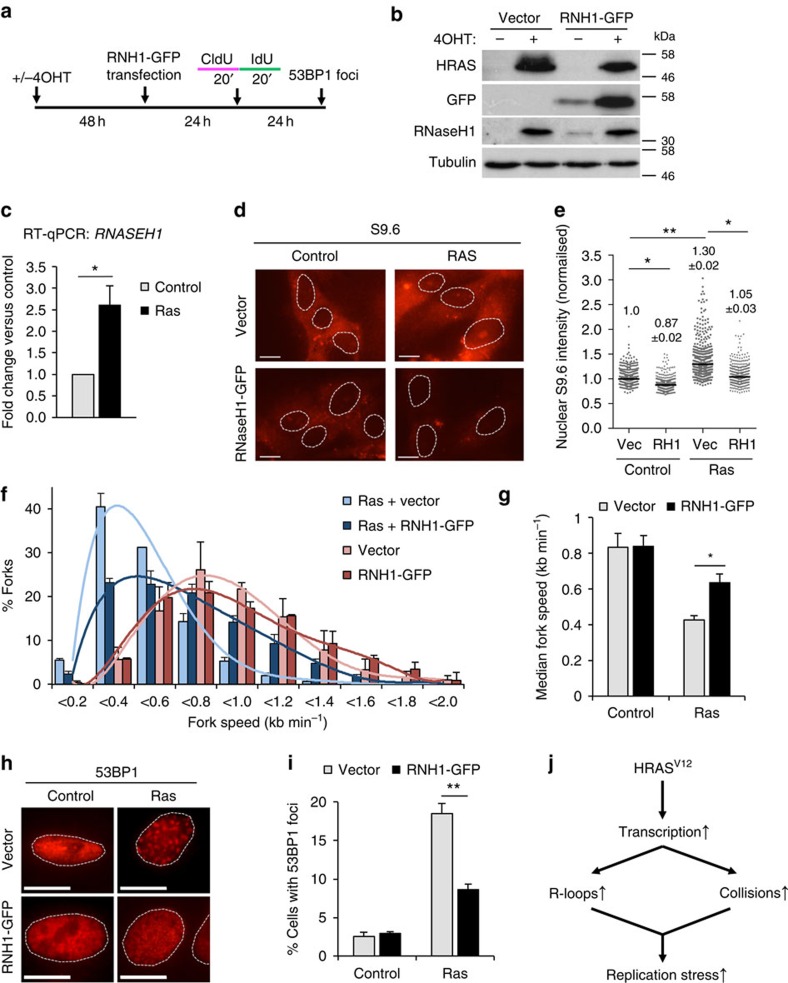
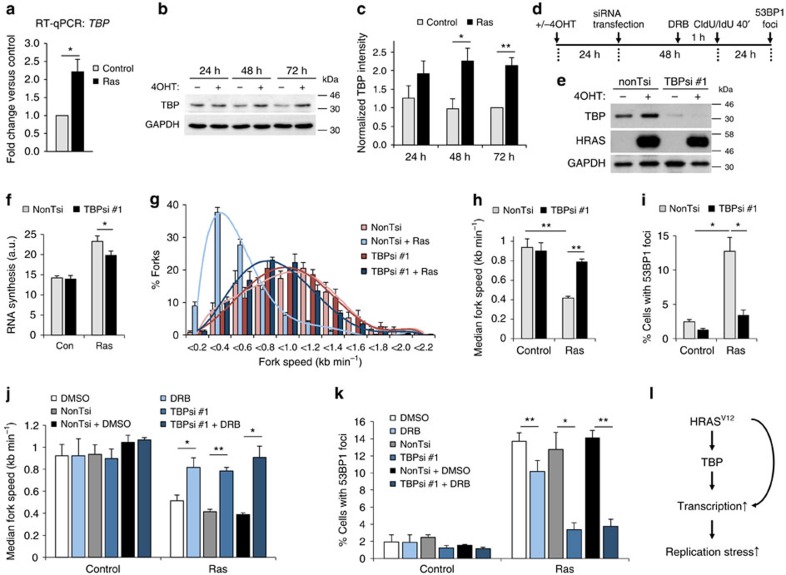
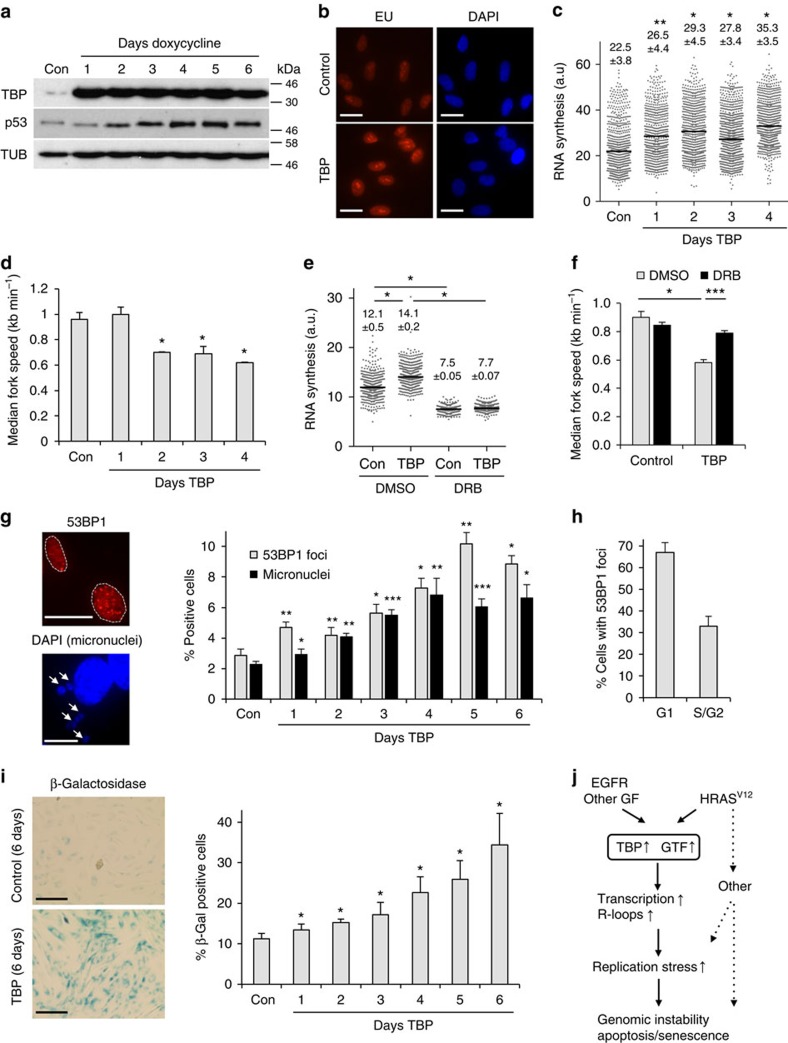
Cancer is a disease associated with genomic instability that often results from oncogene activation. This in turn leads to hyperproliferation and replication stress. However, the molecular mechanisms that underlie oncogene-induced replication stress are still poorly understood. Oncogenes such as HRASV12 promote proliferation by upregulating general transcription factors to stimulate RNA synthesis. Here we investigate whether this increase in transcription underlies oncogene-induced replication stress. We show that in cells overexpressing HRASV12, elevated expression of the general transcription factor TATA-box binding protein (TBP) leads to increased RNA synthesis, which together with R-loop accumulation results in replication fork slowing and DNA damage. Furthermore, overexpression of TBP alone causes the hallmarks of oncogene-induced replication stress, including replication fork slowing, DNA damage and senescence. Consequently, we reveal that increased transcription can be a mechanism of oncogene-induced DNA damage, providing a molecular link between upregulation of the transcription machinery and genomic instability in cancer.


Figures

Figure 1
Figure 1. HRASV12 overexpression increases transcription activity.
(a) Protein levels of HRAS, pERK1/2, ERK1/2 and β-ACTIN in BJ-HRASV12 cells after RAS induction for the times indicated. (b) EU incorporation (1 h) was used to measure nascent RNA synthesis after RAS induction for the times indicated. (c) Representative images of EU staining (red) after RAS induction for 72 h. (d) Quantification of nuclear EU intensity after RAS induction for the times indicated. N=4 (48 and 72 h), N=5 (24 h). (e) RNA/DNA hybrid slot blot of genomic DNA from BJ-HRASV12 cells after RAS induction for 72 h, ±RNase H. S9.6 antibody was used to detect RNA/DNA hybrids (top panel) with single-strand DNA antibody (bottom panel) as a loading control. Serial dilutions of genomic DNA (1/1=4 μg) were probed with S9.6 antibody for standards (left panel). (f) Fold enrichment in RNA/DNA hybrids compared with control. N=3. Means ±s.e.m. (bars) are shown. Student's t-test, *P<0.05, **P<0.01 and ***P<0.001. Scale bars, 10 μm.
Figure 2
Figure 2. HRASV12 overexpression increases R-loop formation.
DIP analysis of R-loop induction on the DUSP6 (a), SPRY2 (b), C-FOS (c), GAPDH (d), γ-ACTIN (e) and β-ACTIN (f) genes in BJ-HRASV12 cells after RAS induction for 72 h. Intergenic region upstream of C-FOS gene (c) served as a background control. Values are percentage of input. N=5. Primer positions are shown in upper panels of af (white boxes represent exons). Means ±s.e.m. (bars) are shown. Student's t-test, *P<0.05, **P<0.01 and ***P<0.001. NS, nonsignificant.
Figure 3
Figure 3. HRASV12 causes replication stress and genomic instability.
(a) Top: DNA fibre labelling was performed in BJ-HRASV12 cells after RAS induction for 24, 48 and 72 h. Bottom: representative images of DNA fibres after 72 h RAS induction. (b) Distributions of replication fork speeds after RAS induction. N=3. (c) Median replication fork speeds after RAS induction. N=3. (d) Protein levels of phospho-S33 RPA32, RPA32 and GAPDH after RAS induction. (e) Protein levels of phospho-S345 CHK1, CHK1 and GAPDH after RAS induction. Hydroxyurea (HU, 2 mM for 24 h) was used as a positive control. (f) Representative images of γH2AX and 53BP1 foci after RAS induction for 96 h. (g) Percentages of cells containing more than 8 γH2AX or 53BP1 foci after RAS induction for 96 h. N=2. Asterisks compare with control. (h) Cell cycle distribution of 53BP1-positive cells after 96 h RAS induction as determined by co-staining with Cyclin A. Right panel: representative images; left panel: quantification. N=3. (i) Representative images of cells with micronuclei and percentages of cells containing micronuclei after RAS induction for 1–6 days. N=2. Asterisks compare with control. Means ±s.e.m. (bars) are shown. Student's t-test, *P<0.05 and **P<0.01. Scale bars, 10 μm.
Figure 4
Figure 4. HRASV12-induced replication stress is promoted by ongoing transcription.
(a) Seventy-two hours after RAS induction, BJ-HRASV12 cells were incubated with transcription inhibitors triptolide, α-amanitin, DRB or dimethylsulfoxide (DMSO) for 100 min to 4 h before and during EU or DNA fibre labelling. (b) Quantification of nascent RNA synthesis by EU incorporation in cells treated with transcription inhibitors 72 h after RAS induction. N=2 (con + triptolide, con + DRB), N=3 (all other samples). (ce) Distributions of replication fork speeds in cells treated with transcription inhibitors 72 h after RAS induction. N=3 (DRB, control + α-amanitin, control + triptolide), N=5 (other samples). (f) Median replication fork speeds in cells treated with transcription inhibitors 72 h after RAS induction. (g) ChIP analysis of γH2AX versus total H2AX levels on the promoter of the C-FOS gene 72 h after RAS induction. + APH samples were treated with 0.5 μM Aphidicolin for 2 h before ChIP. N=3. (h) ChIP analysis of γH2AX versus total H2AX levels on the β-ACTIN gene 72 h after RAS induction as in g. N=3. qPCR primer positions are shown in upper panels. Means ±s.e.m. (bars) are shown. Student's t-test, *P<0.05 and **P<0.01.
Figure 5
Figure 5. HRASV12 induces replication stress through R-loop formation.
(a) After RAS induction for 48 h, BJ-HRASV12 cells were transfected with pCMV6-AC-RNaseH1-GFP or empty vector and processed for DNA fibre analysis or 53BP1 foci staining after 24 or 48 h. (b) Protein levels of HRAS, GFP, RNaseH1 and TUBULIN (loading control) 72 h after RAS induction and 24 h after transfection with pCMV6-AC-RNaseH1-GFP. (c) RNASEH1 mRNA quantification by quantitative reverse transcriptase–PCR after 72 h RAS induction. RNASEH1 mRNA levels were normalized to GAPDH and control. (d) Representative images of S9.6 immunostaining ±pCMV6-AC-RNaseH1-GFP 72 h after RAS induction. (e) Quantification of nuclear S9.6 intensity ±pCMV6-AC-RNaseH1-GFP 72 h after RAS induction. N=3. (f) Distribution of fork speeds ±pCMV6-AC-RNaseH1-GFP 72 h after RAS induction. N=3. (g) Median replication fork speeds ±pCMV6-AC-RNaseH1-GFP 72 h after RAS induction. N=3. (h) Representative images of cells with 53BP1 foci, ±pCMV6-AC-RNaseH1-GFP 96 h after RAS induction. (i) Percentage of cells displaying more than 8 53BP1 foci, ±pCMV6-AC-RNaseH1-GFP 96 h after RAS induction. N=3. (j) Model of how HRASV12 causes replication stress via increasing transcription. Means ±s.e.m. (bars) are shown. Student's t-test, *P<0.05 and **P<0.01. Scale bars, 10 μm.
Figure 6
Figure 6. TBP is an effector in HRASV12-induced replication stress.
(a) TBP mRNA quantification by quantitative reverse transcriptase–PCR in BJ-HRASV12 cells 72 h after RAS induction. TBP mRNA levels were normalized to GAPDH and control. (b) Protein levels of TBP and β-ACTIN after RAS induction for the times indicated. (c) Densitometry quantification of TBP levels based on western blotting as in b after RAS induction for the times indicated. Values were normalized to 72 h control. N=3 (24 and 48 h), N=6 (72 h). (d) Twenty-four hours after RAS induction, cells were transfected with TBP siRNA (TBPsi #1) or control siRNA (nonTsi). Cells were processed for DNA fibre analysis or western blotting 48 h later and for 53BP1 staining 24 h later. (e) Protein levels of TBP, HRAS and GAPDH (loading control) 72 h after RAS induction and 48 h after siRNA transfection. (f) Quantification of nascent RNA synthesis by EU incorporation ±TBPsi #1 72 h after RAS induction. N=3. (g) Distribution of replication fork speeds ±TBPsi #1 72 h after RAS induction. N=3. (h) Median replication fork speeds ±TBPsi #1 72 h after RAS induction. N=3. (i) Percentages of cells containing more than eight 53BP1 foci, ±TBPsi #1 96 h after RAS induction. N=3. (j) Median replication fork speeds in cells treated with TBPsi #1 and DRB 72 h after RAS induction, compared with TBPsi #1 or DRB alone. N=3. (k) Percentages of cells treated with TBPsi #1 and DRB containing more than eight 53BP1 foci after 96 h after RAS induction, compared with TBPsi #1 or DRB alone. N=3. (l) Model for the role of TBP in HRASV12-induced replication stress. Means ±s.e.m. (bars) are shown. Student's t-test, *P<0.05, **P<0.01 and ***P<0.001.
Figure 7
Figure 7. TBP overexpression causes replication stress and senescence.
(a) Protein levels of TBP, p53 and TUBULIN (loading control) in BJ-TBPind cells treated with doxycycline for 1–6 days, to induce TBP overexpression. No doxycycline was used as a control. (b) Nascent RNA synthesis as measured by EU incorporation after TBP induction for 3 days. Scale bars, 10 μm. (c). Quantification of nuclear EU intensity after TBP induction for 1–4 days. N=4 (con, day 1, 2 and 4), N=5 (day 3). (d) Median replication fork speeds in after TBP induction. N=2 (day 1, 2 and 4), N=4 (con, day 3). Asterisks compare with control. (e) Nascent RNA synthesis as measured by EU incorporation in cells treated with DRB or dimethylsulfoxide (DMSO) (control) for 100 min, 72 h after TBP induction. N=3. (f) Median replication fork speeds in BJ-TBPind cells treated with DRB 72 h after TBP induction. N=3. (g). Percentage of cells displaying more than eight 53BP1 foci or micronuclei after TBP induction. Right panel: representative images of cells with 53BP1 foci and micronuclei. Asterisks compare with control. N=2–7. (h) Cell cycle distribution of 53BP1-positive cells 96 h after TBP induction as determined by co-staining with Cyclin A. N=2. (i) Representative images and percentages of β-galactosidase staining after TBP induction for 1–6 days. Scale bars, 100 μm. (j) Model of how HRASV12 and other growth factor oncogenes such as epidermal growth factor receptor (EGFR) induce replication stress by increasing transcription through TBP and other transcription factors. Additional mechanisms, such as reactive oxygen species, may also contribute to HRASV12-induced DNA damage. Means ±s.e.m. (bars) are shown. Student's t-test, *P<0.05, **P<0.01 and ***P<0.001.

References

    1. McGranahan N., Burrell R. A., Endesfelder D., Novelli M. R. & Swanton C. Cancer chromosomal instability: therapeutic and diagnostic challenges. EMBO Rep. 13, 528–538 (2012). - PMC - PubMed
    1. Kotsantis P., Jones R. M., Higgs M. R. & Petermann E. Cancer therapy and replication stress: forks on the road to perdition. Adv. Clin. Chem. 69, 91–138 (2015). - PubMed
    1. Burrell R. A. et al.. Replication stress links structural and numerical cancer chromosomal instability. Nature 494, 492–496 (2013). - PMC - PubMed
    1. Bartkova J. et al.. Oncogene-induced senescence is part of the tumorigenesis barrier imposed by DNA damage checkpoints. Nature 444, 633–637 (2006). - PubMed
    1. Di Micco R. et al.. Oncogene-induced senescence is a DNA damage response triggered by DNA hyper-replication. Nature 444, 638–642 (2006). - PubMed

Publication types

MeSH terms