

Challenges and disparities in the application of personalized genomic medicine to populations with African ancestry
- PMID: 27725664
- PMCID: PMC5062569
- DOI: 10.1038/ncomms12521
Challenges and disparities in the application of personalized genomic medicine to populations with African ancestry
Abstract
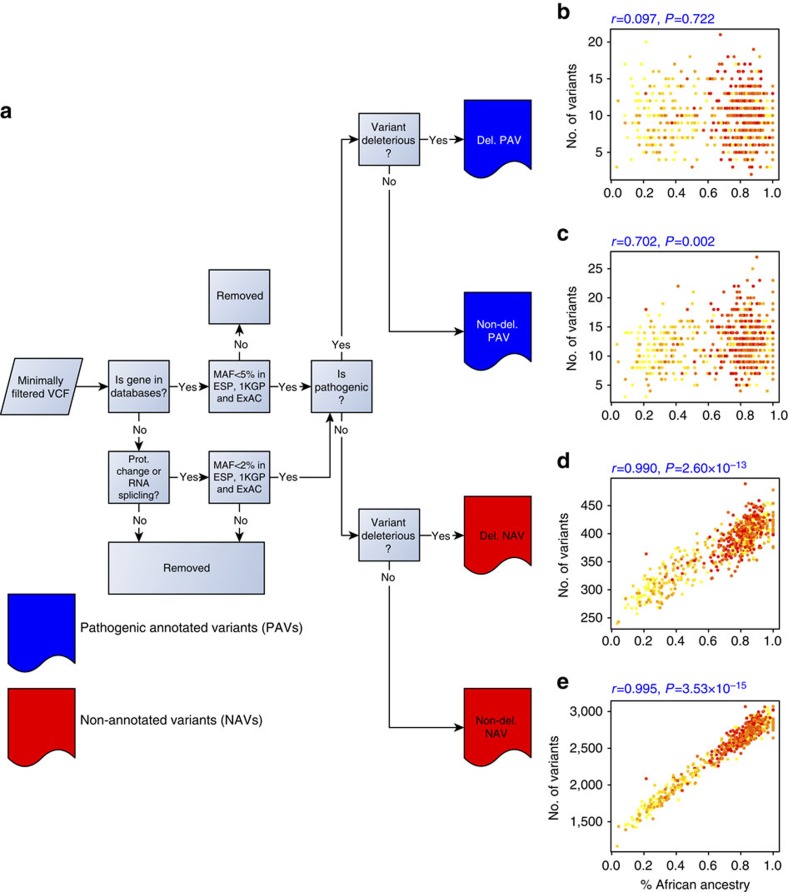
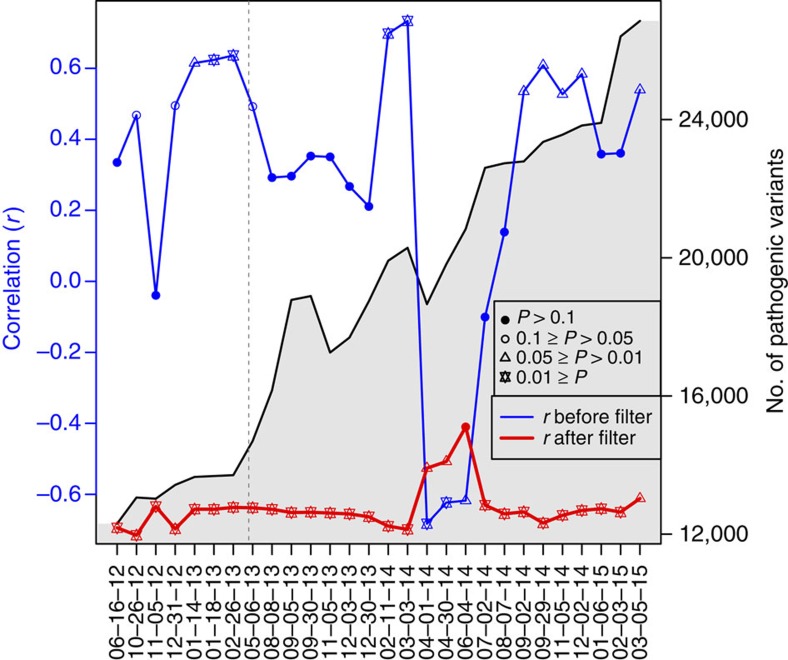
To characterize the extent and impact of ancestry-related biases in precision genomic medicine, we use 642 whole-genome sequences from the Consortium on Asthma among African-ancestry Populations in the Americas (CAAPA) project to evaluate typical filters and databases. We find significant correlations between estimated African ancestry proportions and the number of variants per individual in all variant classification sets but one. The source of these correlations is highlighted in more detail by looking at the interaction between filtering criteria and the ClinVar and Human Gene Mutation databases. ClinVar's correlation, representing African ancestry-related bias, has changed over time amidst monthly updates, with the most extreme switch happening between March and April of 2014 (r=0.733 to r=-0.683). We identify 68 SNPs as the major drivers of this change in correlation. As long as ancestry-related bias when using these clinical databases is minimally recognized, the genetics community will face challenges with implementation, interpretation and cost-effectiveness when treating minority populations.
Figures
References
Publication types
MeSH terms
Grants and funding
- R01 ES015794/ES/NIEHS NIH HHS/United States
- K24 AI077930/AI/NIAID NIH HHS/United States
- G12 RR003048/RR/NCRR NIH HHS/United States
- P50 CA125183/CA/NCI NIH HHS/United States
- U01 CA161032/CA/NCI NIH HHS/United States
- RC2 HL101543/HL/NHLBI NIH HHS/United States
- R01 AI079139/AI/NIAID NIH HHS/United States
- HHSN268201300048C/HL/NHLBI NIH HHS/United States
- R01 HL089856/HL/NHLBI NIH HHS/United States
- U01 HL089856/HL/NHLBI NIH HHS/United States
- R01 HL087699/HL/NHLBI NIH HHS/United States
- R21 HG004751/HG/NHGRI NIH HHS/United States
- U01 HL049596/HL/NHLBI NIH HHS/United States
- R37 HL068546/HL/NHLBI NIH HHS/United States
- P30 DK020595/DK/NIDDK NIH HHS/United States
- R01 HL069167/HL/NHLBI NIH HHS/United States
- R01 HL089897/HL/NHLBI NIH HHS/United States
- UL1 TR000445/TR/NCATS NIH HHS/United States
- R01 GM116065/GM/NIGMS NIH HHS/United States
- U54 MD007588/MD/NIMHD NIH HHS/United States
- K23 HL004464/HL/NHLBI NIH HHS/United States
- R21 HG007233/HG/NHGRI NIH HHS/United States
- U01 HL089897/HL/NHLBI NIH HHS/United States
- R21 CA178706/CA/NCI NIH HHS/United States
- U19 AI095230/AI/NIAID NIH HHS/United States
- R01 HG007644/HG/NHGRI NIH HHS/United States
- RC2 HL101651/HL/NHLBI NIH HHS/United States
- HHSN268201300049C/HL/NHLBI NIH HHS/United States
- HHSN268201300047C/HL/NHLBI NIH HHS/United States
- R01 HL104608/HL/NHLBI NIH HHS/United States
- HHSN268201300050C/HL/NHLBI NIH HHS/United States
- U10 HL109164/HL/NHLBI NIH HHS/United States
- T32 HG000044/HG/NHGRI NIH HHS/United States
- R01 HL117004/HL/NHLBI NIH HHS/United States
- P60 MD006902/MD/NIMHD NIH HHS/United States
- R01 HL072414/HL/NHLBI NIH HHS/United States
- UL1 RR024975/RR/NCRR NIH HHS/United States
- HHSN268201300046C/HL/NHLBI NIH HHS/United States
- S06 GM008016/GM/NIGMS NIH HHS/United States
- T32 CA154274/CA/NCI NIH HHS/United States
- U19 AI095227/AI/NIAID NIH HHS/United States
- K01 HL092601/HL/NHLBI NIH HHS/United States
- R21 HL112656/HL/NHLBI NIH HHS/United States
- R01 HL088133/HL/NHLBI NIH HHS/United States
- U01 HL081332/HL/NHLBI NIH HHS/United States
- T32 GM007175/GM/NIGMS NIH HHS/United States
- R01 HL118267/HL/NHLBI NIH HHS/United States
LinkOut - more resources
Full Text Sources
Other Literature Sources
Medical
Molecular Biology Databases
Miscellaneous
