. 2016 Oct 11:7:13023.
doi: 10.1038/ncomms13023.

Large-scale microfluidics providing high-resolution and high-throughput screening of Caenorhabditis elegans poly-glutamine aggregation model

Affiliations

Large-scale microfluidics providing high-resolution and high-throughput screening of Caenorhabditis elegans poly-glutamine aggregation model

Sudip Mondal et al. Nat Commun. .

Abstract

Next generation drug screening could benefit greatly from in vivo studies, using small animal models such as Caenorhabditis elegans for hit identification and lead optimization. Current in vivo assays can operate either at low throughput with high resolution or with low resolution at high throughput. To enable both high-throughput and high-resolution imaging of C. elegans, we developed an automated microfluidic platform. This platform can image 15 z-stacks of ∼4,000 C. elegans from 96 different populations using a large-scale chip with a micron resolution in 16 min. Using this platform, we screened ∼100,000 animals of the poly-glutamine aggregation model on 25 chips. We tested the efficacy of ∼1,000 FDA-approved drugs in improving the aggregation phenotype of the model and identified four confirmed hits. This robust platform now enables high-content screening of various C. elegans disease models at the speed and cost of in vitro cell-based assays.


Conflict of interest statement

A.B. and E.H. are co-founders of Newormics LLC. A.B., S.M., E.H., C.M., S.K.G., and N.G. are authors of a pending patent on high throughput imaging platform (Patent application PCT/US2015/057624).

Figures

Figure 1
Figure 1. The high-throughput screening (HTS) platform and assay details for C. elegans PolyQ aggregation model.
(a) Schematic of the HTS platform. The 96-well microfluidic chip is operated with a custom designed gasket system to immobilize C. elegans inside parallel trapping channels. Scale bar is 200 μm. (b) Steps of the new liquid culture (LC) protocol for high-throughput drug treatment and imaging of day 3 adult (D3) animals in the microfluidic chip. (c) Images of D3 stage healthy (PolyQ24) and degenerated (PolyQ35) animals immobilized inside microfluidic channels. The animal images are traced manually to show soluble Q24::YFP and punctate Q35::YFP expression present in their body wall muscle cells. Scale bar is 100 μm. (d) Frequency distribution of aggregate numbers per length for PolyQ24 (green) and PolyQ35 (orange) animals growing in LC and imaged using the HTS platform indicated on the left and the right axis (orange arrow), respectively (n>1,667 animals).
Figure 2
Figure 2. Multi-well microfluidic chip design for C. elegans trapping and imaging.
(a) Schematic of the 96-well chip design with two common exit lines (E1 and E2) along chip edges. (b) A repeating unit of 4 × 2 wells connected to the common exit port E1. (c) A single well and its immobilization channels with varying aspect ratios (formula image
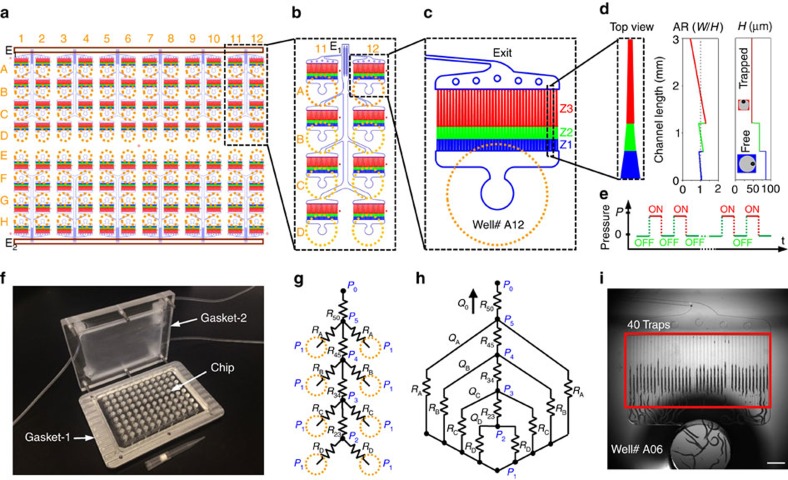
=width/height) in zone 1 (Z1), zone 2 (Z2), and zone 3 (Z3). (d) The top view of the trapping channel and its height (H) and formula image for all three zones as a function of the length. The schematic of the cross-sections of a free and trapped animal is shown at different regions of the trapping channel with the green dots showing the location of their ventral cord position. (e) Animals are pushed into the trapping channels using an on/off pressure cycle. (f) An image of 96-well chip with the gasket system. (g) The map of hydraulic resistances for 40 traps with varying exit channel widths (RA, RB, RC, and RD) and main exit channel sections (R23, R34, R45, and R50). (h) The equivalent resistance circuit under a common gasket pressure P1 and resulting flow rates (QA, QB, QC, QD, and Q0). The pressure at the exit port P0 is assumed to be an atmospheric pressure. (i) An image of 40 trapping channels with immobilized animals. Scale bar is 1 mm.
Figure 3
Figure 3. Automation for high-speed image acquisition from multi-well chip.
(a) Flow chart of the automated imaging. (b) Parallel traps are imaged with a large camera to capture a 1.5 × 1.5 mm2 portion of the chip with 10 parallel traps and moved in a synchronized manner to capture multiple image stacks at every location. (c) An image of well# A06 with all its 40 immobilization channels, showing trapped D3 adult animals and four 1.5 × 1.5 mm2 FOVs with 10 parallel traps each (black dotted rectangles). Scale bar is 1 mm. (d) Top view of the chip showing four corner markers (M1, M2, M3, and M4) and the rotational offset (θXY). (e) The schematic of the chip overall tilt (δXY and δXZ) when mounted on the stage. (f) Side view of chip mounted with XZ tilt (δXZ).
Figure 4
Figure 4. The automated image analysis for estimating the aggregate parameters using high-resolution image stacks and the resulting Z′-factor characterization.
(a) Workflow of the image analysis algorithms that score degeneration in terms of the aggregate parameters from the image stacks. (b) Stitched image of all 40 channels distributed over four FOVs and filled with PolyQ35 animals. (c) Normalized intensity profile across the channels. The red dots mark the channels with animals. (d) A cropped image of a single channel with an animal. (e) Image of the same animal after thresholding and filtering through a particle filter. The arrow indicates one of the aggregates. The scale bar is 100 μm. (f) Heat map of median aggregate number per unit length as measured from a whole 96-well chip loaded with a checker box pattern. (g) Median aggregate number per unit length of each well quantified using the automated algorithms. The panel on the right shows the Z′-factor for 1, 2, and 3-well average values. (h) Median aggregate number per unit length of each well analysed using the lower resolution images (0.13 NA, 4 × objective). The panel on the right shows the Z′-factor for 1, 2, and 3-well average values.
Figure 5
Figure 5. Assay validation with PolyQ aggregation model animals for drug screening.
We tested a total of 20 different populations of PolyQ35 animals grown in 10 different batches and treated at 2 different stages with 5 different compounds: 17-AAG, Geldanamycin (Geld), Celastrol (Cel), Radicicol (Rad), and MG132. (a) Median aggregate numbers per unit length of the animals treated at L1 stage and imaged on D3 stage. (b) Median aggregate numbers per unit length of the animals treated at L3 stage and imaged on D3 stage. The black lines represent the median value for vehicle treated (0.5% DMSO) animals. (c) Standard deviation is plotted against median of aggregate numbers per unit length for each treatment condition. The positive results, identified as wells with lower median aggregate numbers per length and lower standard deviation values, are marked as: (1) (20 μM Geld, L1 stage), (2) (50 μM Geld, L3 stage), (3) (50 μM 17-AAG, L3 stage), (4) (50 μM 17-AAG, L1 stage), (5) (20 μM Geld, L3 stage), and (6) (20 μM 17-AAG, L1 stage). (d) Images of animals treated with different conditions and imaged inside the microfluidic chip. Scale bar is 100 μm. (e) Frequency percentage plot for aggregate numbers per unit length of PolyQ35 animals treated with vehicle and 17-AAG at L1 and L3 stages and with 20 and 50 μM concentrations. (f) Frequency percentage plot for aggregate numbers per unit length of PolyQ35 animals treated with vehicle and Geld at L1 and L3 stages and with 20 and 50 μM concentrations. Error bars in (a,b) are standard error of the mean (n≥33 animals). Statistical significance for individual compound was calculated within same stage with respect to the vehicle control using two-tailed t-test and represented as P<0.01 (*) and P<0.001 (**).
Figure 6
Figure 6. High-throughput screening of FDA-approved compounds.
(a) An example heat map of median aggregate numbers per unit animal length and the loading map. (b) Summary plot of all 983 FDA-approved drug compounds as scored from 14 independent whole-chip experiments. The solid and dotted lines represent, respectively, the median and ±3 × standard deviation of the aggregate numbers per unit length of PolyQ35 animals treated with vehicle. (c) Summary of results from 17 drug compounds with reduced aggregate numbers having median values lower than the 3 × standard deviations of the vehicle control. (d) Statistical significance of these 17 drug compounds as calculated with respect to the vehicle control using two-tailed t-test (n≥33 animals except n=20, 25, and 15 for S1397, S1377, and SAM002589929, respectively). Four of the compounds (S2114, SAM002564216, SAM002264598, and SAM002264597) exhibited statistically significant lower median aggregate numbers per unit length (P<0.005) and are indicated by the arrows. (e) Results of hit validation experiments for these four compounds for animals treated at L1 stage at four different concentrations (0.5, 5, 25, and 50 μM). The blue bars represent the values obtained from the original screen as reference points. Error bars are standard error of the mean. Statistical significance for all different doses for individual compounds was calculated with respect to the lowest concentration using two-tailed, t-test (n≥70 animals except n=37 for Geld 25 μM). The statistical significance values are represented as P<0.05 (*) and P<0.005 (**).

References

    1. Delvecchio C., Tiefenbach J. & Krause H. M. The zebrafish: a powerful platform for in vivo, HTS drug discovery. Assay Drug. Dev. Technol. 9, 354–361 (2011). - PubMed
    1. Artal-Sanz M., de Jong L. & Tavernarakis N. Caenorhabditis elegans: a versatile platform for drug discovery. Biotechnol. J. 1, 1405–1418 (2006). - PubMed
    1. O'Reilly L. P., Luke C. J., Perlmutter D. H., Silverman G. A. & Pak S. C. C. elegans in high-throughput drug discovery. Adv. Drug. Deliv. Rev. 69–70, 247–253 (2014). - PMC - PubMed
    1. Pandey U. B. & Nichols C. D. Human disease models in Drosophila melanogaster and the role of the fly in therapeutic drug discovery. Pharmacol. Rev. 63, 411–436 (2011). - PMC - PubMed
    1. Kaletta T. & Hengartner M. O. Finding function in novel targets: C. elegans as a model organism. Nat. Rev. Drug. Discov. 5, 387–398 (2006). - PubMed

Publication types