

Optimal control of complex atomic quantum systems
- PMID: 27725688
- PMCID: PMC5057100
- DOI: 10.1038/srep34187
Optimal control of complex atomic quantum systems
Abstract
Quantum technologies will ultimately require manipulating many-body quantum systems with high precision. Cold atom experiments represent a stepping stone in that direction: a high degree of control has been achieved on systems of increasing complexity. However, this control is still sub-optimal. In many scenarios, achieving a fast transformation is crucial to fight against decoherence and imperfection effects. Optimal control theory is believed to be the ideal candidate to bridge the gap between early stage proof-of-principle demonstrations and experimental protocols suitable for practical applications. Indeed, it can engineer protocols at the quantum speed limit - the fastest achievable timescale of the transformation. Here, we demonstrate such potential by computing theoretically and verifying experimentally the optimal transformations in two very different interacting systems: the coherent manipulation of motional states of an atomic Bose-Einstein condensate and the crossing of a quantum phase transition in small systems of cold atoms in optical lattices. We also show that such processes are robust with respect to perturbations, including temperature and atom number fluctuations.
Figures
 with
with  and
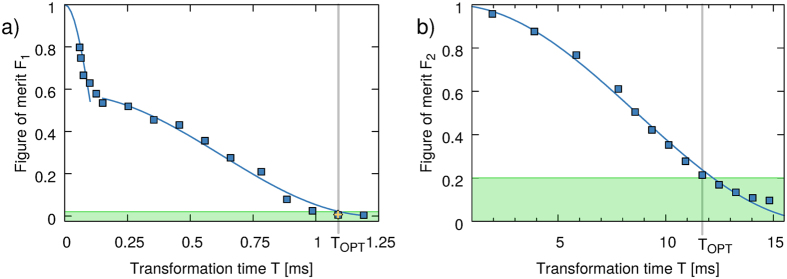
and  (left and right curve respectively), determining the QSL. The green region represents the smallest measurable infidelity in the experiment. Its intercept with the blue line defines the optimal time TOPT = 1.09 ms (gray vertical line), which is the fastest time compatible with both the QSL and the experimental limitations. The yellow cross marks the experimental result performed at TOPT. (b) Theoretical prediction of the optimal figure of merit F2 (averaged atom number fluctuations in each site at the center of the trap, see Eq. (4)) as a function of the control field duration T (blue squares) for the crossing of the SF-MI crossover. The blue solid line is a fit determining the QSL, the crossing point between the numerical result. The green region (estimated experimental limitations) defines the optimal time TOPT = 12.0(2) (gray vertical line).
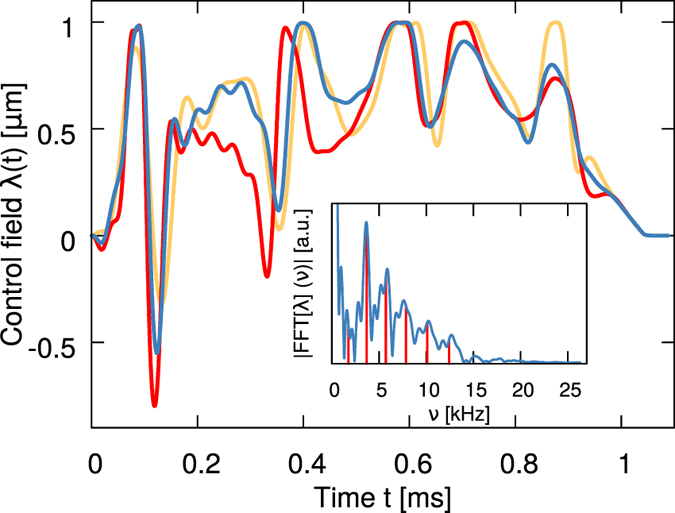
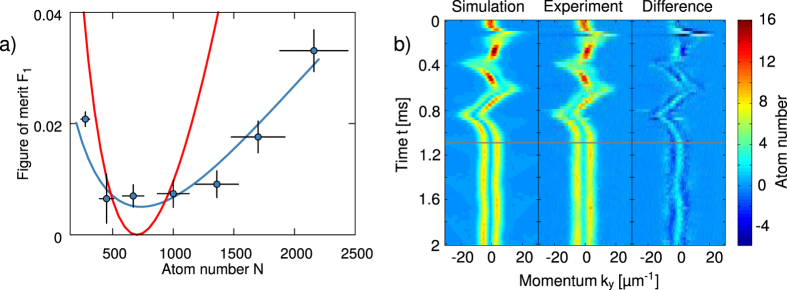
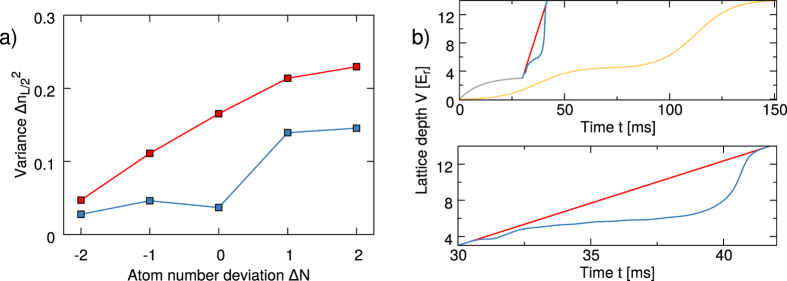
 for different atom numbers N for the linear (red) and optimal (blue) control fields. The optimized control field works best for 16 atoms, but a small deviation only slightly decreases the figure of merit (blue). The linear ramp results in a higher figure of merit for all atom numbers (red). (b) Lattice ramps used in the experiment. Top: the lattice is first slowly ramped to 3 Er (grey) before either the fast linear control field (red) or fast optimized control field (blue) is applied. The typical adiabatic control field (yellow) is much longer. Bottom: magnification of the comparison between the linear (red) and the optimal control field (blue).
References
-
- Rosi G., Sorrentino F., Cacciapuoti L., Prevedelli M. & Tino G. M. Precision measurement of the Newtonian gravitational constant using cold atoms. Nature 510, 518–521 (2014). - PubMed
-
- Poli N. et al.. Precision Measurement of Gravity with Cold Atoms in an Optical Lattice and Comparison with a Classical Gravimeter. Phys. Rev. Lett. 106, 038501 (2011). - PubMed
-
- Neumann P. et al.. High-Precision Nanoscale Temperature Sensing Using Single Defects in Diamond. Nano Lett. 13, 2738- 2742 (2013). - PubMed
-
- Bloom B. J. et al.. An optical lattice clock with accuracy and stability at the 10−18 level. Nature 506, 71–75 (2014). - PubMed
-
- Bloch I., Dalibard J. & Nascimbène S. Quantum simulations with ultracold quantum gases. Nat. Phys. 8, 267–276 (2012).
Publication types
LinkOut - more resources
Full Text Sources
Other Literature Sources
Miscellaneous
