. 2016 Oct 11:6:34845.
doi: 10.1038/srep34845.

Bioprinting of 3D Convoluted Renal Proximal Tubules on Perfusable Chips

Affiliations

Bioprinting of 3D Convoluted Renal Proximal Tubules on Perfusable Chips

Kimberly A Homan et al. Sci Rep. .

Abstract

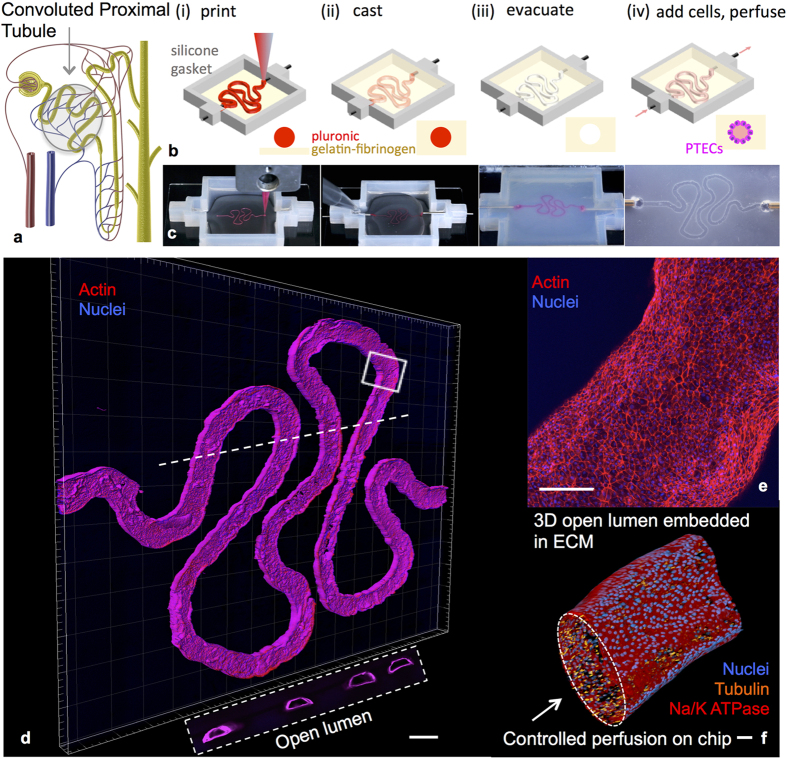
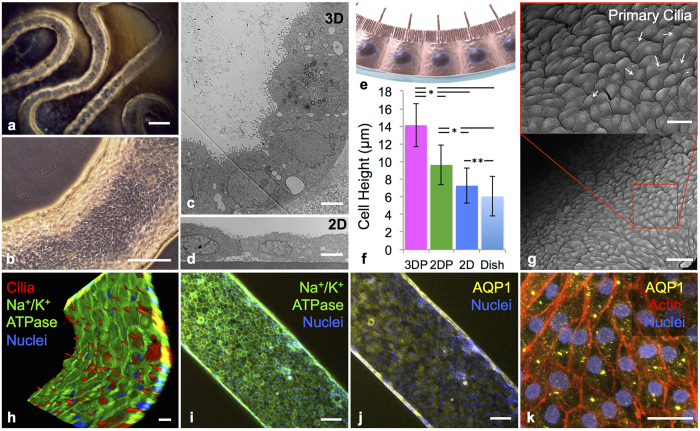
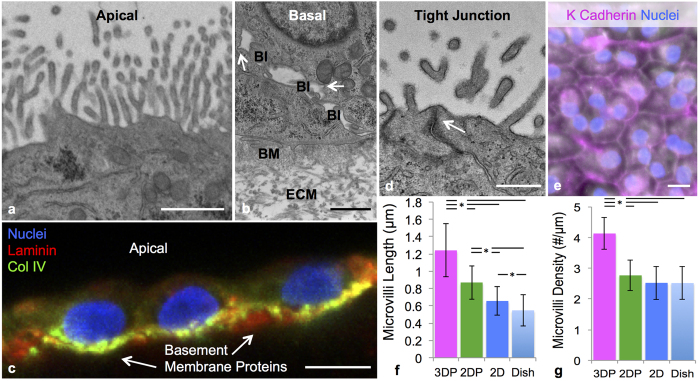
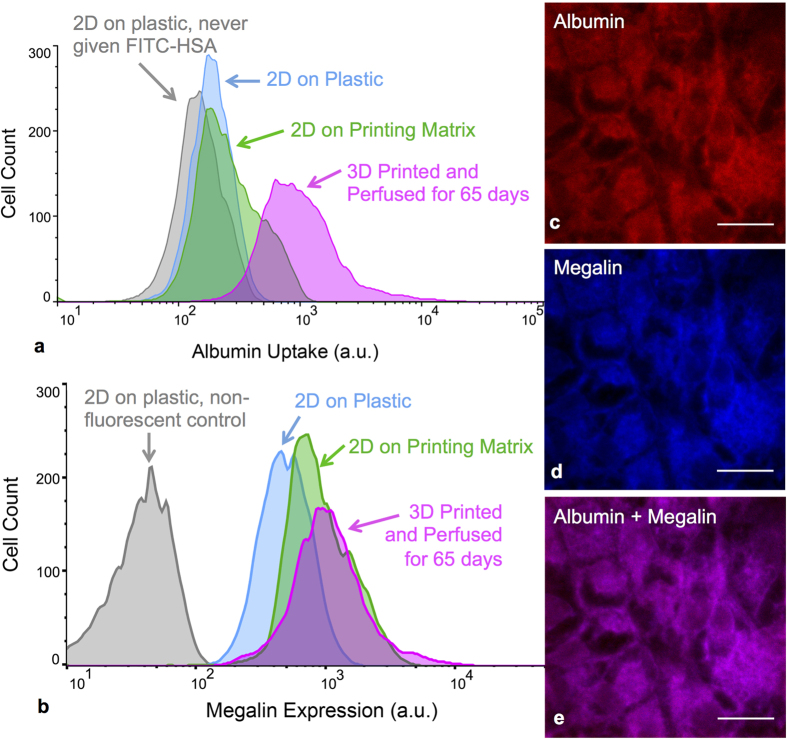
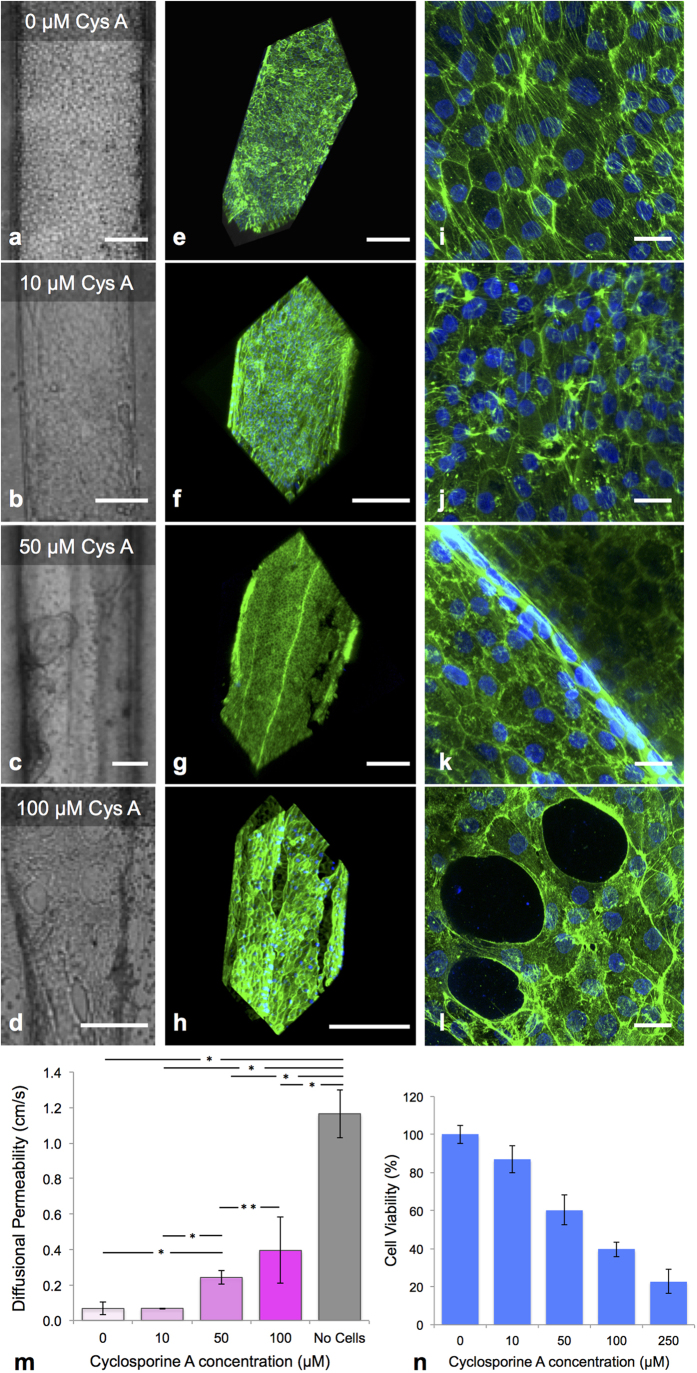
Three-dimensional models of kidney tissue that recapitulate human responses are needed for drug screening, disease modeling, and, ultimately, kidney organ engineering. Here, we report a bioprinting method for creating 3D human renal proximal tubules in vitro that are fully embedded within an extracellular matrix and housed in perfusable tissue chips, allowing them to be maintained for greater than two months. Their convoluted tubular architecture is circumscribed by proximal tubule epithelial cells and actively perfused through the open lumen. These engineered 3D proximal tubules on chip exhibit significantly enhanced epithelial morphology and functional properties relative to the same cells grown on 2D controls with or without perfusion. Upon introducing the nephrotoxin, Cyclosporine A, the epithelial barrier is disrupted in a dose-dependent manner. Our bioprinting method provides a new route for programmably fabricating advanced human kidney tissue models on demand.


Conflict of interest statement

K.A.H., D.B.K., M.S.S. and J.A.L. are named as co-inventors on patent applications WO2015069619 and 62157239, which are based, in part, on the research reported herein. A.M. works for Roche Pharmaceutical Sciences, who provided partial funding for this work. The other authors declare that they have no competing interests.

Figures

Figure 1
Figure 1. 3D convoluted renal proximal tubule on chip.
(a) Schematic of a nephron highlighting the convoluted proximal tubule, (b,c) corresponding schematics and images of different steps in the fabrication of 3D convoluted, perfusable proximal tubules, in which a fugitive ink is first printed on a gelatin-fibrinogen extracellular matrix (ECM) (i), additional ECM is cast around the printed feature (ii), the fugitive ink is evacuated to create an open tubule (iii), and PTEC cells are seeded within the tubule and perfused for long time periods (iv); (d) a 3D rendering of the printed convoluted proximal tubule acquired by confocal microscopy, where actin is stained in red and nuclei are blue; the white dotted line denotes the location of the cross-sectional view shown below in which PTEC cells circumscribe the open lumens in 3D, scale bar = 500 μm, (e) higher magnification view of the region in (d) denoted by the white rectangle, scale bar = 200 μm, (f) 3D rendering of the convoluted renal proximal tubule where an open lumen circumscribed with an epithelial lining is directionally perfused on chip and Na/K ATPase is stained in red, acetylated tubulin is orange highlighting the primary cilia, and nuclei are blue, scale bar = 50 μm.
Figure 2
Figure 2. 3D proximal tubule morphology and molecular markers.
(a) A phase contrast image of a mature 3D PT construct taken at 6 weeks, scale bar = 500 μm, (b) phase contrast image of the 3D PT construct at 6 weeks, scale bar = 250 μm, (c) TEM image of the PTECs within the tubule at 5 weeks, scale bar = 5 μm, (d) TEM image of the PTECs grown on a 2D dish coated with ECM with no perfusion, scale bar = 5 μm, (e) schematic view of the columnar epithelium seen in native tissue, in which PTECs pack together closely and exhibit a dense brush border on the apical side, tight junctions, and a solid basement membrane, (f) PTEC cell height as measured from TEM images of the 3D PT constructs (3DP) as well as three 2D controls (2DP = PTECs on ECM in 2D with perfusion, 2D = PTECs on ECM in 2D not perfused, Dish = bare tissue culture dish not perfused), *p < 0.001, **p < 0.02, (g) SEM images at low (scale bar = 50 μm) and higher (scale bar = 20 μm) magnifications showing a confluent layer of PTECs within the 3D PT, white arrows highlight the presence of primary cilia at a density of one per cell, (h) 3D rendering of a partial tubule showing the apical side, which highlights the primary cilia (red), scale bar = 20 μm, (i) image of the PT highlighting the presence of Na/K ATPase in green, scale bar = 100 μm, (j) image of the 3D PT highlighting the presence of AQP1 in yellow, scale bar = 100 μm, (k) high magnification view of the image in (j) highlighting actin in red and showing AQP1 in yellow, scale bar = 20 μm.
Figure 3
Figure 3. 3D proximal tubules form a tissue-like polarized epithelium.
(a) TEM image of the brush border on the apical side of PTECs at 6 weeks, scale bar = 1 μm, (b) TEM image of the basal side of PTECs at 6 weeks highlighting the presence of the engineered extracellular matrix (ECM), basement membrane proteins secreted by the cells (BM), basolateral interdigitations (BI), and circular invaginations in the membrane marked with white arrows, scale bar = 1 μm, (c) PTECs at 6 weeks showing the basement membrane proteins the cells secreted, namely laminin (predominant protein in red) and collagen IV (green), scale bar = 10 μm, (d) tight junction (white arrow) between PTECs in the bioprinted tubule, scale bar = 500 nm, (e) the cell junction protein K Cadherin (magenta) stained in the PT, scale bar = 10 μm, (f) microvilli length and (g) microvilli density quantified through TEM images of the 3D PT constructs (3DP) as well as three 2D controls (2DP = PTECs on ECM in 2D with perfusion, 2D = PTECs on ECM in 2D without perfusion, Dish = bare tissue culture dish without perfusion), p < 0.001.
Figure 4
Figure 4. Improved functionality of printed and perfused 3D proximal tubules.
(a) Albumin uptake assay in 3D proximal tubules. Flow cytometry data comparing the fluorescence intensity of PTECs fed FITC-labeled human serum albumin for 2 h under several conditions, including 2D controls on bare (blue) and ECM-coated (green) plastic dishes and in 3D PTs perfused for 65 days (magenta). (b) Flow cytometry data comparing the fluorescence intensity of megalin for the same PTEC samples as shown in (a,c) fluorescence image of the 3D PT constructs stained for FITC-labeled albumin (red), (d) megalin (blue), and (e) combined, scale bars = 20 μm.
Figure 5
Figure 5. Cyclosporine A-induced cytotoxicity.
(a–d) Brightfield images, (e–h) 3D renderings, and (i–l) high magnification images of printed and perfused 3D PTs dosed with varying concentrations of Cyclosporine A for 24 h, where actin (green) and nuclei (blue) are stained, scale bars = 200 μm (ah) and scale bars = 20 μm (il), respectively, (m) Diffusional permeability measurements taken after dosing with Cyclosporine A, *p < 0.003, **p < 0.02, (n) Cell viability measured for the 2D control (on bare dish) after dosing with Cyclosporine A (all populations shown are statistically significantly different with a p < 0.005).

References

    1. Tiong H. Y. et al. Drug-induced nephrotoxicity: clinical impact and preclinical in vitro models. Mol Pharm 11, 1933–1948, 10.1021/mp400720w (2014). - DOI - PubMed
    1. Deccloedt E. Drug-induced renal injury. Continuing Medical Education 29, 252–255 (2011).
    1. Choudhury D. & Ahmed Z. Drug-associated renal dysfunction and injury. Nat Clin Pract Nephrol 2, 80–91, 10.1038/ncpneph0076 (2006). - DOI - PubMed
    1. Naughton C. A. Drug-induced nephrotoxicity. Am. Fam. Physician 78, 743–750 (2008). - PubMed
    1. Redfern W. S. et al. Impact and prevalence of safety pharmacology-related toxicities throughout the pharmaceutical life cycle. J. Pharmacol. Toxicol. Methods 62, e29, doi: http://dx.doi.org/10.1016/j.vascn.2010.11.098 (2010). - DOI

Publication types