. 2016 Oct 11;12(10):e1006339.
doi: 10.1371/journal.pgen.1006339. eCollection 2016 Oct.

High-Throughput Identification of Adaptive Mutations in Experimentally Evolved Yeast Populations

Affiliations

High-Throughput Identification of Adaptive Mutations in Experimentally Evolved Yeast Populations

Celia Payen et al. PLoS Genet. .

Abstract

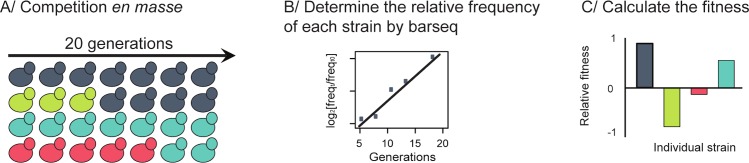
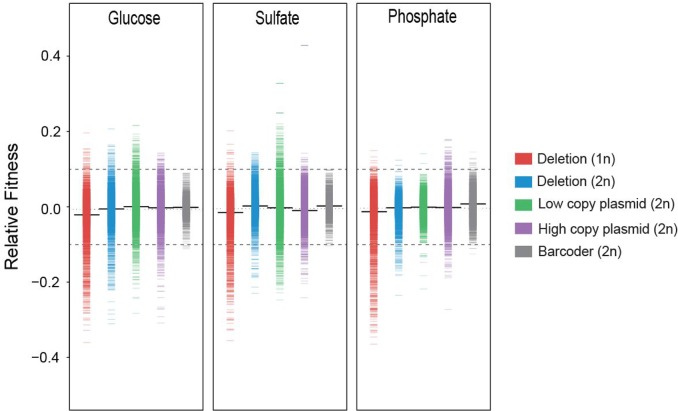
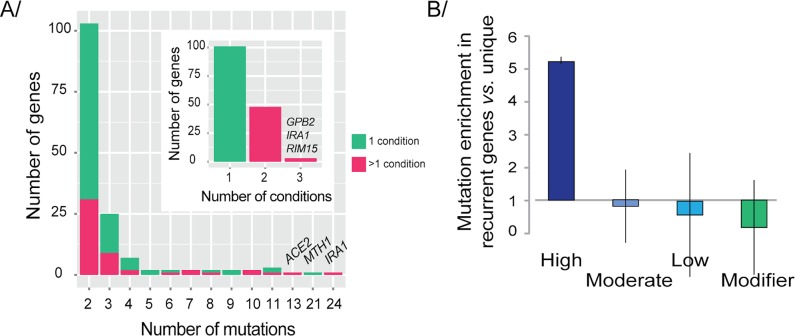
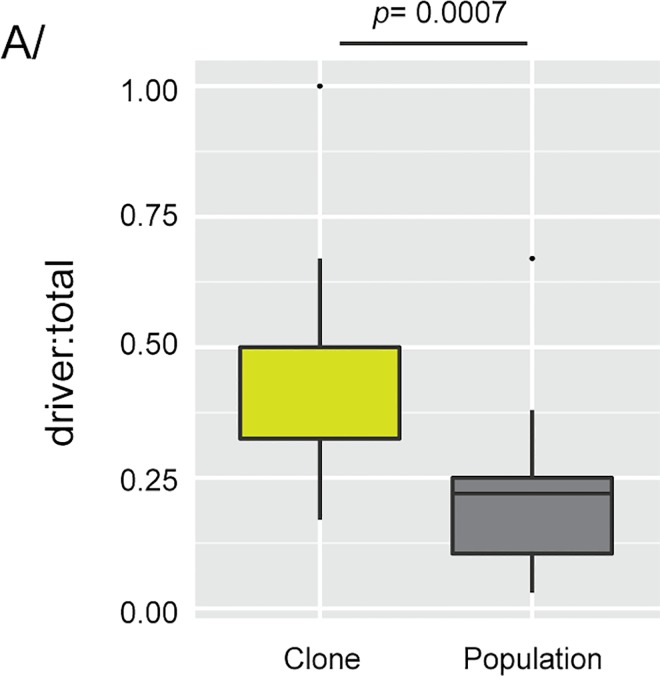
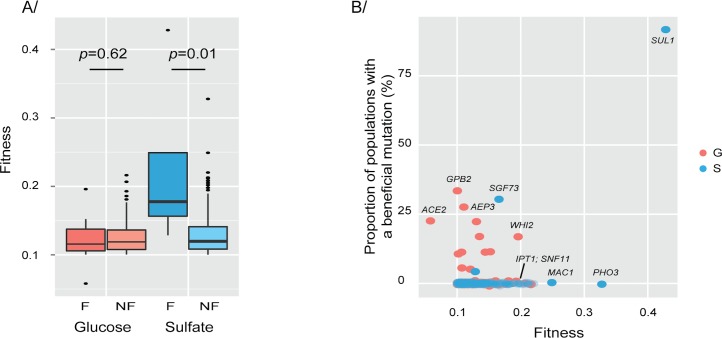
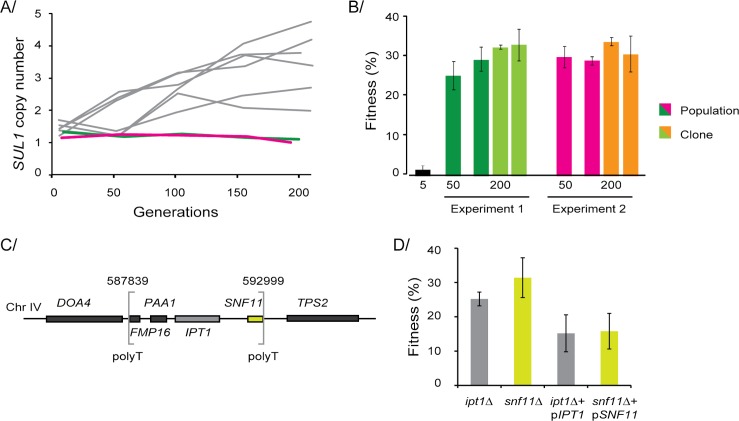
High-throughput sequencing has enabled genetic screens that can rapidly identify mutations that occur during experimental evolution. The presence of a mutation in an evolved lineage does not, however, constitute proof that the mutation is adaptive, given the well-known and widespread phenomenon of genetic hitchhiking, in which a non-adaptive or even detrimental mutation can co-occur in a genome with a beneficial mutation and the combined genotype is carried to high frequency by selection. We approximated the spectrum of possible beneficial mutations in Saccharomyces cerevisiae using sets of single-gene deletions and amplifications of almost all the genes in the S. cerevisiae genome. We determined the fitness effects of each mutation in three different nutrient-limited conditions using pooled competitions followed by barcode sequencing. Although most of the mutations were neutral or deleterious, ~500 of them increased fitness. We then compared those results to the mutations that actually occurred during experimental evolution in the same three nutrient-limited conditions. On average, ~35% of the mutations that occurred during experimental evolution were predicted by the systematic screen to be beneficial. We found that the distribution of fitness effects depended on the selective conditions. In the phosphate-limited and glucose-limited conditions, a large number of beneficial mutations of nearly equivalent, small effects drove the fitness increases. In the sulfate-limited condition, one type of mutation, the amplification of the high-affinity sulfate transporter, dominated. In the absence of that mutation, evolution in the sulfate-limited condition involved mutations in other genes that were not observed previously-but were predicted by the systematic screen. Thus, gross functional screens have the potential to predict and identify adaptive mutations that occur during experimental evolution.


Conflict of interest statement

The authors have declared that no competing interests exist.

Figures

Fig 1
Fig 1. Experimental design for the pooled competition experiments.
The proportion of each strain was measured every three to four generations during pooled competition assays, in which all the strains from a single collection were mixed together in equal proportions and grown in continuous culture for 20 generations (A). The frequency of each barcode at each time point was measured using the barseq method (B). The fitness of each strain was computed based on the measured frequencies (C).
Fig 2
Fig 2. Distribution of the fitness effects of single-gene amplifications and deletions.
Fitness distributions of the five yeast collections in glucose-limited, sulfate-limited, and phosphate-limited continuous-growth conditions. The fitness of each strain is shown as a small line. The fitness distribution of the control collection is shown in grey. The thick black line represents the mean. Dashed grey lines indicate the cutoff of ±10% measured using the control collection.
Fig 3
Fig 3. Recurrently mutated genes reveal how evolution is constrained.
(A) Repeatability of adaptation and parallelism at the gene level. Genes were classified by the number of mutations detected during Evolve and Resequence studies: 154 genes were mutated in more than one sample; 48 genes with recurrent mutations were mutated in more than one condition (small panel). (B) Enrichment of recurrently mutated genes with high-impact mutations compared with genes mutated in only one sample. Enrichment is not observed for moderate or low impact mutations, or modifiers. Error bars are 95% CIs.
Fig 4
Fig 4. Driver mutations.
(A) Boxplot representing the ratio of driver to total mutations detected in evolved clones and populations. The significance of the difference between clones and populations was estimated using a Wilcoxon-ranked test.
Fig 5
Fig 5. Alternative accessible evolutionary paths.
(A) The fitness of beneficial mutations found (F) in Evolve and Resequence studies is significantly higher than the fitness of beneficial mutations not found (NF) in sulfate-limitation but not in glucose-limitation. The significance of the difference between the two boxplots for each condition was estimated using a Wilcoxon-ranked test. (B) Each point represents the fitness of a strain and the proportion of Evolve and Resequence samples with the corresponding gene mutated. SUL1 dominates the fitness and mutational spectrum. Several mutations have a high fitness but have never been detected in Evolve and Resequence studies and might correspond to potential drivers of adaptation.
Fig 6
Fig 6. Alternative beneficial mutations are selected in the absence of the main driver.
(A) The copy number of SUL1 was assessed using qPCR of samples taken from two independent experiments in which SUL1 was not amplified (green and pink) and compared with previously published data from wild-type strains (in grey) [40]. (B) The fitness coefficient as compared to the ancestral strain of population samples at generations 5, 50, and 200 and the fitness of two clones isolated at generation 200. (C) A small deletion (~5kb) encompassing four genes on chromosome IV was detected in a population from one experiment (between brackets); polyT sequences are present at the breakpoints. The colors of the boxes represent the orientation of the genes (yellow: gene on the Watson strand, grey: genes on the Crick strand). (D) Fitness coefficients of the deletion strains ipt1Δ and snf11Δ and those of both deletion strains complemented with IPT1 or SNF11 on a low-copy plasmid grown in sulfate limitation.

References

    1. Turner TL, Stewart AD, Fields AT, Rice WR, Tarone AM. Population-based resequencing of experimentally evolved populations reveals the genetic basis of body size variation in Drosophila melanogaster. PLoS Genet. 2011;7(3):e1001336 10.1371/journal.pgen.1001336 - DOI - PMC - PubMed
    1. Lang GI, Rice DP, Hickman MJ, Sodergren E, Weinstock GM, Botstein D, et al. Pervasive genetic hitchhiking and clonal interference in forty evolving yeast populations. Nature. 2013. 10.1038/nature12344 - DOI - PMC - PubMed
    1. Kvitek D, Sherlock G. Whole genome, whole population sequencing reveals that loss of signaling networks is the major adaptive strategy in a constant environment. PLoS Genet. 2013;9(11):e1003972 10.1371/journal.pgen.1003972 - DOI - PMC - PubMed
    1. Hong J, Gresham D. Molecular specificity, convergence and constraint shape adaptive evolution in nutrient-poor environments. PLoS Genet. 2014;10(1):e1004041 10.1371/journal.pgen.1004041 - DOI - PMC - PubMed
    1. Zhu YO, Siegal ML, Hall DW, Petrov DA. Precise estimates of mutation rate and spectrum in yeast. Proc Natl Acad Sci U S A. 2014;2014. June 3;111(22):E2310–8. 10.1073/pnas.1323011111 - DOI - PMC - PubMed

LinkOut - more resources