Randomized Controlled Trial
. 2016 Oct 11;13(10):e1002139.
doi: 10.1371/journal.pmed.1002139. eCollection 2016 Oct.

Regulatory T Cell Responses in Participants with Type 1 Diabetes after a Single Dose of Interleukin-2: A Non-Randomised, Open Label, Adaptive Dose-Finding Trial

Affiliations
Randomized Controlled Trial

Regulatory T Cell Responses in Participants with Type 1 Diabetes after a Single Dose of Interleukin-2: A Non-Randomised, Open Label, Adaptive Dose-Finding Trial

John A Todd et al. PLoS Med. .

Abstract

Background: Interleukin-2 (IL-2) has an essential role in the expansion and function of CD4+ regulatory T cells (Tregs). Tregs reduce tissue damage by limiting the immune response following infection and regulate autoreactive CD4+ effector T cells (Teffs) to prevent autoimmune diseases, such as type 1 diabetes (T1D). Genetic susceptibility to T1D causes alterations in the IL-2 pathway, a finding that supports Tregs as a cellular therapeutic target. Aldesleukin (Proleukin; recombinant human IL-2), which is administered at high doses to activate the immune system in cancer immunotherapy, is now being repositioned to treat inflammatory and autoimmune disorders at lower doses by targeting Tregs.

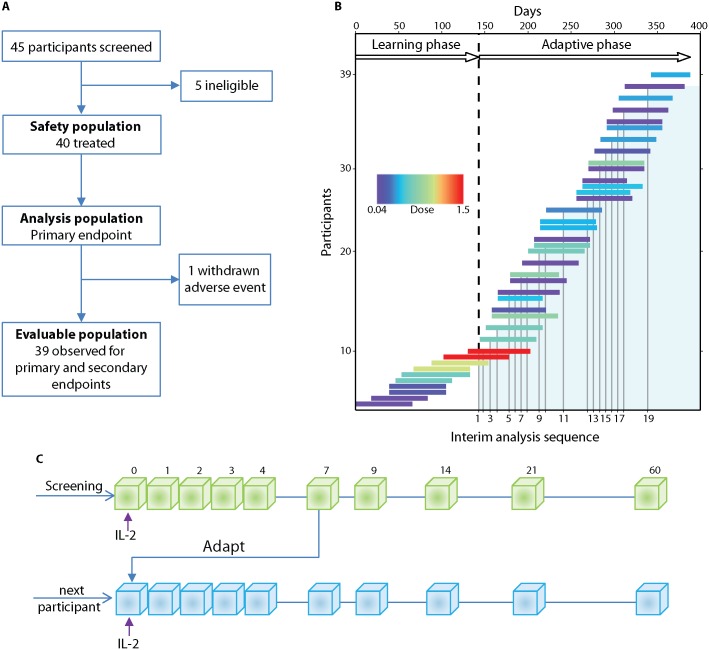
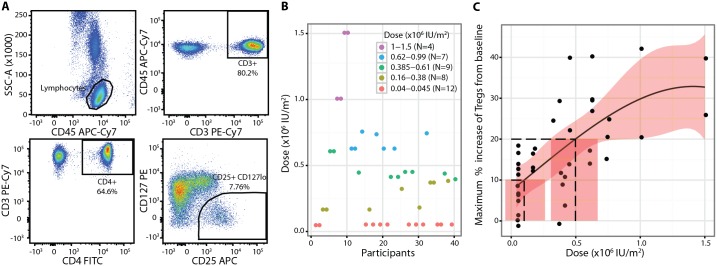
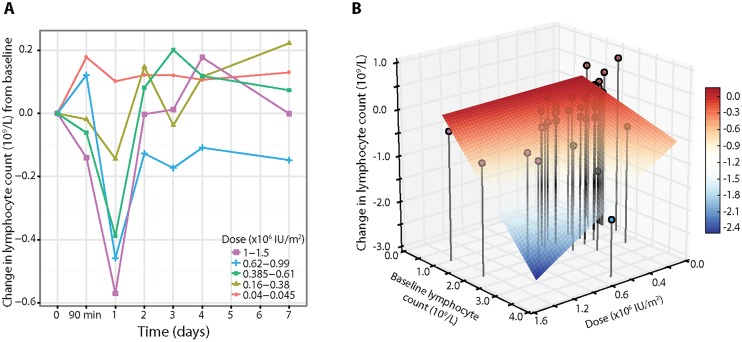
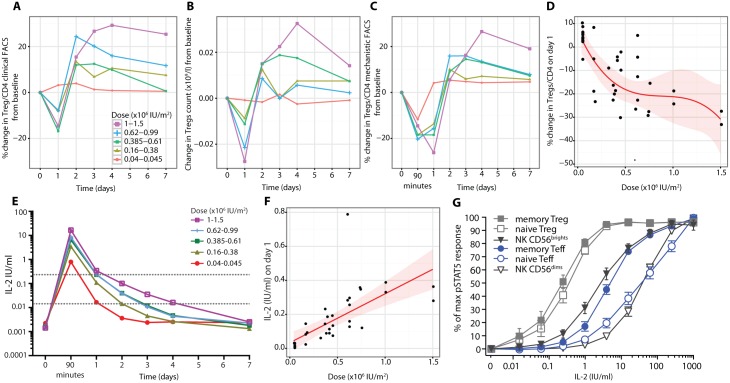
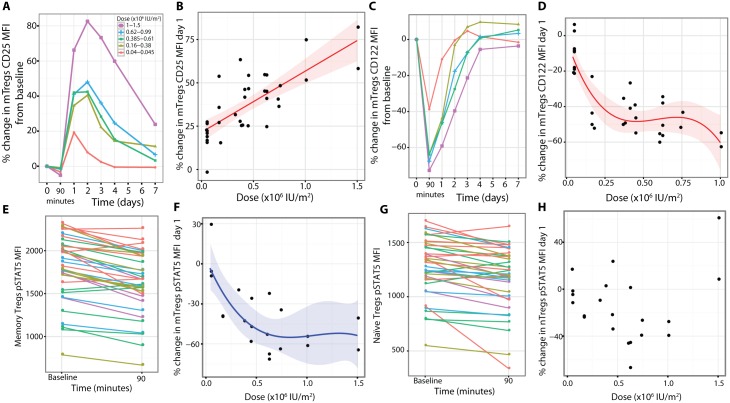
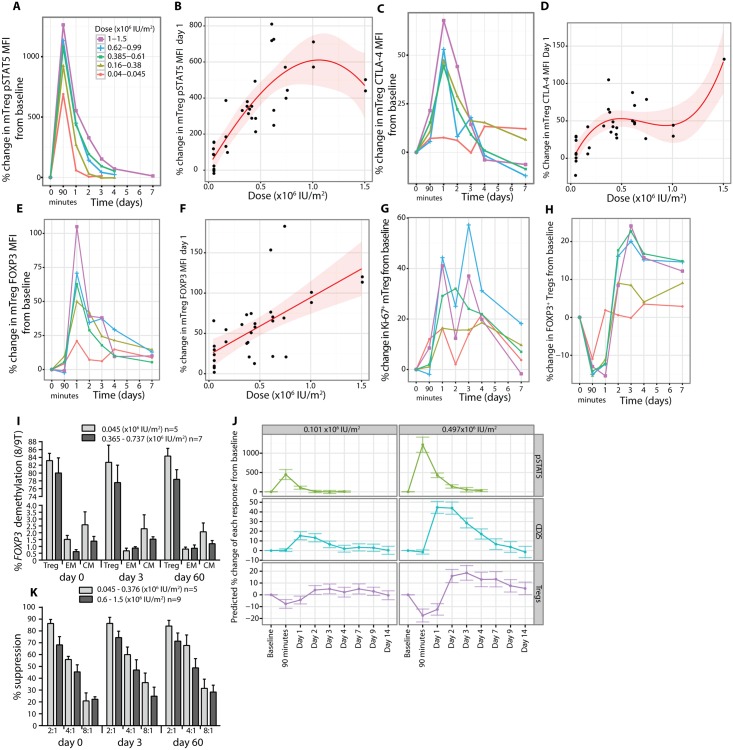
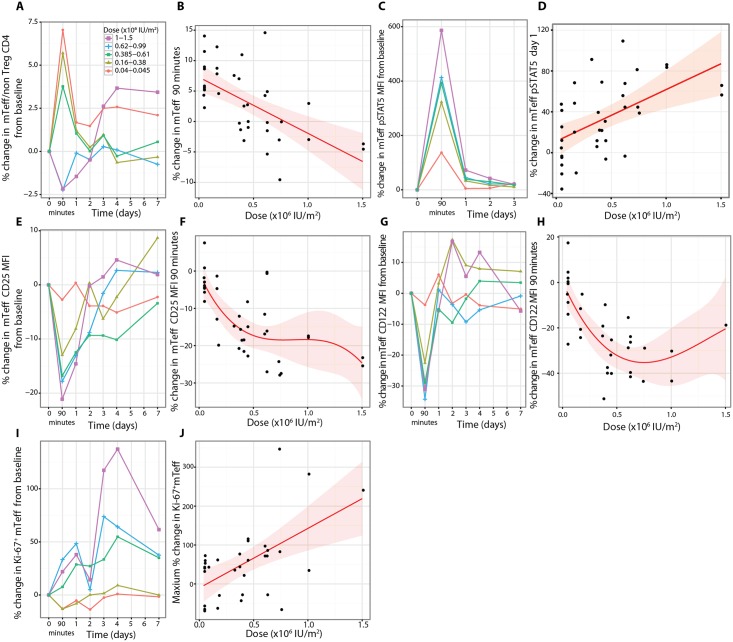
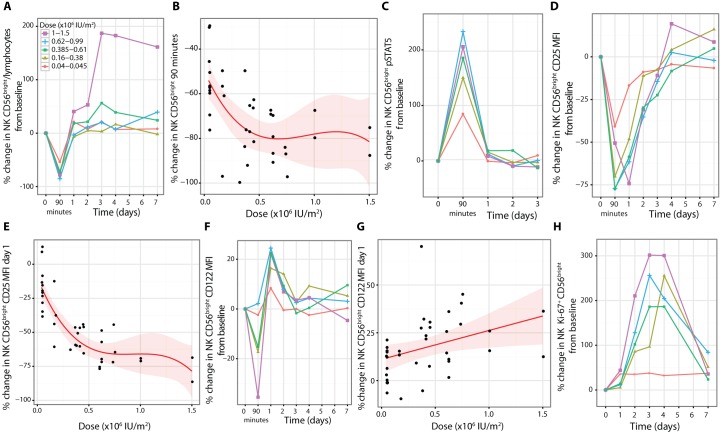
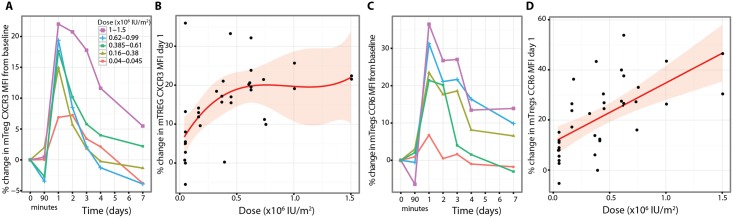
Methods and findings: To define the aldesleukin dose response for Tregs and to find doses that increase Tregs physiologically for treatment of T1D, a statistical and systematic approach was taken by analysing the pharmacokinetics and pharmacodynamics of single doses of subcutaneous aldesleukin in the Adaptive Study of IL-2 Dose on Regulatory T Cells in Type 1 Diabetes (DILT1D), a single centre, non-randomised, open label, adaptive dose-finding trial with 40 adult participants with recently diagnosed T1D. The primary endpoint was the maximum percentage increase in Tregs (defined as CD3+CD4+CD25highCD127low) from the baseline frequency in each participant measured over the 7 d following treatment. There was an initial learning phase with five pairs of participants, each pair receiving one of five pre-assigned single doses from 0.04 × 10⁶ to 1.5 × 10⁶ IU/m2, in order to model the dose-response curve. Results from each participant were then incorporated into interim statistical modelling to target the two doses most likely to induce 10% and 20% increases in Treg frequencies. Primary analysis of the evaluable population (n = 39) found that the optimal doses of aldesleukin to induce 10% and 20% increases in Tregs were 0.101 × 10⁶ IU/m2 (standard error [SE] = 0.078, 95% CI = -0.052, 0.254) and 0.497 × 10⁶ IU/m2 (SE = 0.092, 95% CI = 0.316, 0.678), respectively. On analysis of secondary outcomes, using a highly sensitive IL-2 assay, the observed plasma concentrations of the drug at 90 min exceeded the hypothetical Treg-specific therapeutic window determined in vitro (0.015-0.24 IU/ml), even at the lowest doses (0.040 × 10⁶ and 0.045 × 10⁶ IU/m2) administered. A rapid decrease in Treg frequency in the circulation was observed at 90 min and at day 1, which was dose dependent (mean decrease 11.6%, SE = 2.3%, range 10.0%-48.2%, n = 37), rebounding at day 2 and increasing to frequencies above baseline over 7 d. Teffs, natural killer cells, and eosinophils also responded, with their frequencies rapidly and dose-dependently decreased in the blood, then returning to, or exceeding, pretreatment levels. Furthermore, there was a dose-dependent down modulation of one of the two signalling subunits of the IL-2 receptor, the β chain (CD122) (mean decrease = 58.0%, SE = 2.8%, range 9.8%-85.5%, n = 33), on Tregs and a reduction in their sensitivity to aldesleukin at 90 min and day 1 and 2 post-treatment. Due to blood volume requirements as well as ethical and practical considerations, the study was limited to adults and to analysis of peripheral blood only.

Conclusions: The DILT1D trial results, most notably the early altered trafficking and desensitisation of Tregs induced by a single ultra-low dose of aldesleukin that resolves within 2-3 d, inform the design of the next trial to determine a repeat dosing regimen aimed at establishing a steady-state Treg frequency increase of 20%-50%, with the eventual goal of preventing T1D.

Trial registration: ISRCTN Registry ISRCTN27852285; ClinicalTrials.gov NCT01827735.


Conflict of interest statement

FWL has received fees for consulting and speaking on type 1 diabetes and immunotherapeutics from Epidarex Capital, GlaxoSmithKline, Novo Nordisk, Eli Lilly, and Hoffmann-La Roche. LSW has received funds to support research from Hoffmann-La Roche and has received consultancy fees from Kymab Access Limited. JAT has received ad hoc consultancy fees from GlaxoSmithKline, AstraZeneca, Pfizer, Janssen and Kymab Limited and is Director of the JDRF/Wellcome Trust Diabetes and Inflammation Laboratory that has received research grant funds from F Hoffmann-La Roche, AstraZeneca and Eli Lilly. SB has a non-financial competing interests as a member of the board for the NIHR Efficacy and Mechanism Evaluation Programme board. APM has received payments for consulting with GSK, Danone and grants from EU IMI scheme, MRC, BHF and CRUK. SN has had his research salary partly funded by Senseonics.

Figures

Fig 1
Fig 1. DILT1D study profile and adaptive design.
(A) Flow chart showing the allocation of participants to the three predefined study populations: evaluable, safety, and analysis. (B) The study was conducted in two phases, a learning phase (140 d) and an adaptive phase (240 d). Individual participants are represented by a horizontal line, the length corresponding to the time from treatment until their final visit. In the learning phase, the first ten participants received a 0.04 × 10⁶, 0.16 × 10⁶, 0.60 × 10⁶, 1.00 × 10⁶, or 1.50 × 10⁶ IU/m2 dose of aldesleukin (colour represents dose allocated) in ascending order, with each dose being administered to two participants before escalation. In the adaptive phase, the DDC (S3 Materials) met on 19 occasions to review the interim safety data and allocate doses based on the analysis of the accumulated Treg data (shaded area) from all treated participants at that time. (C) Schematic of the study design illustrating that each participant who passed screening was administered a single dose of aldesleukin and followed for 60 d. During the adaptive phase, Treg data for every participant up to day 7 was included in an interim analysis and then further doses were allocated to the next participants. Treg, regulatory T cell; DDC, Dose Determining Committee.
Fig 2
Fig 2. Regulatory T cell primary endpoint.
(A) Percentage of Tregs was defined as the percentage of CD3+CD4+CD25highCD127low cells within the CD3+CD4+ gate measured. (B) Individual participant dose allocations and dose groups showing convergence of the study to doses that achieve the two defined Treg targets. (C) A cubic model described the Treg dose response to aldesleukin best, with dashed lines showing the 10% and 20% Treg targets and doses. The shaded areas represent 95% CIs. Baseline, or pretreatment, Treg (percent of CD4+ T cells): 6.60% (SE = 0.25%, range 3.50%–10.70%, n = 39). SSC-A, side-scattered light-A; Treg, regulatory T cell.
Fig 3
Fig 3. Lymphocyte responses to a dose of aldesleukin.
(A) Average response curves of the absolute change in lymphocyte count across the five dose groups (average baseline lymphocyte count 1.78 × 10⁹/l, SE = 0.08, range 0.95–3.84, n = 39). (B) Three-dimensional plot of dose, baseline lymphocyte count, and change in lymphocyte count on day 1, with lines representing the vertical projections of points (coloured by dose) on the dose/baseline lymphocyte count axis. The surface grid represents the regression model for change in lymphocyte count on day 1 (colour scale), showing that the decrease in lymphocytes depends both on dose and pretreatment count.
Fig 4
Fig 4. Eosinophil response depends on baseline counts and aldesleukin dose.
(A) Eosinophil counts showed an initial transient decrease at 90 min in a hyperacute response to aldesleukin followed by a dose-dependent increase on day 1, with a return to baseline by day 3–4 (average baseline eosinophil count 0.15 × 10⁹/l, SE = 0.03, range 0.04–0.86, n = 39). (B) Three-dimensional plot of dose, baseline eosinophil count, and change in eosinophil count on day 1, with lines representing the vertical projections of points (coloured by dose) on the dose/baseline eosinophil count axis. The change in eosinophil count is affected by both dose and baseline eosinophil count using a linear dose-response model, with the grid showing the regression model (colour scale) for increase in eosinophils on day 1 (colour scale) (absolute change in eosinophil count on day 1 = −0.0058 + [0.0693 × dose] + [0.1748 × baseline]).
Fig 5
Fig 5. Hyperacute regulatory T cell response to aldesleukin.
(A) Treg proportions as a percent of CD4+ T cells (average Treg level 6.6%, SE = 0.2%, range 3.5%–10.7%, n = 39) and (B) Treg counts following injection of aldesleukin as measured by the clinical grade FACS assay in conjunction with the BD Multitest TBNK assay are shown (average baseline Treg count 0.06 × 10⁹/l, SE = 0.01, range 0.02–0.14, n = 39). (C) Tregs as a percent of CD4+ T cells were measured in the mechanistic FACS assay (average Treg level 6.99%, SE = 0.27%, range 3.93%–10.74%, n = 37). (D) The decline of Tregs in blood on day 1 fits a cubic model (shaded area presents the 95% CI, n = 37). (E) Plasma IL-2 levels following aldesleukin dosing. The dotted grey lines mark the 0.015 and 0.24 IU/ml concentrations that are the threshold levels of aldesleukin at which Tregs, and Teffs and NK CD56bright cells, respond, respectively. (F) Relationship between the dose of aldesleukin administered and the plasma concentration of IL-2 at day 1 in vivo. (G) Aldesleukin dose-response curves generated in whole blood from DILT1D participants for pSTAT5 responses within individual cell populations on day 60 post-treatment (mean with bars showing 95% CI, n = 39). (A–C) show averaged response plots across the five dose groups. (D) and (F) show the best fitted models with 95% CI. Teff, effector T cell; Treg, regulatory T cell.
Fig 6
Fig 6. Phenotypes of the residual circulating regulatory T cells at day 1.
(A and B) CD25 expression was increased on mTregs (average baseline CD25 MFI on mTreg = 7,412, SE = 181, range 5,119–9,393, n = 37). (C and D) Concurrently, there was a dose-dependent reduction in CD122 on mTregs in blood (baseline CD122 MFI on mTreg = 444.2, SE = 14.0, range 288.0–616.0, n = 33). (E) There was a reduction in pSTAT5 levels in mTregs incubated with a saturating concentration of aldesleukin (1,000 IU/ml) in vitro when assessing blood obtained 90 min after dosing of aldesleukin. (F) At day 1 post-dosing, there was a dose-dependent reduction in the percentage of mTregs that were pSTAT5+ following incubation with 0.4 IU/ml aldesleukin in vitro (percent of pretreatment time point mTregs that were pSTAT5+ following aldesleukin incubation: 56.25%, SE = 1.60%, range 43.23%–71.03%, n = 22). (G) There was a reduction in pSTAT5 levels in nTregs assessed 90 min post-dosing when the cells were incubated with a saturating dose of aldesleukin (1,000 IU/ml) in vitro. (H) At day 1 post-dosing, there was not a consistent change from baseline in the percentage of nTregs that were pSTAT5+ following incubation with 0.4 IU/ml aldesleukin in vitro (baseline percent of nTregs that were pSTAT5+ following incubation with 0.4 IU/ml aldesleukin: 58.01%, SE = 1.65%, range 40.83%–69.88%, n = 21). (A) and (C) show averaged response plots across the five dose groups. (B), (D), and (E) show the best fitted models with 95% CIs. MFI, mean fluorescence intensity; mTreg, memory regulatory T cell; nTreg, naïve regulatory T cell.
Fig 7
Fig 7. In vivo regulatory T cell phenotypes and functional responses to aldesleukin.
(A and B) mTregs had their maximum pSTAT5 response to treatment at 90 min, and a detectable response was sustained for up to 4 d at the higher doses and was dose dependent on day 1 with a cubic dose response (average baseline pSTAT5 MFI = 7.36, SE = 0.33, range 4.64–12.53, n = 36). (C–F) Following activation, mTregs had a dose-dependent increase in CTLA-4 and FOXP3 expression, returning to baseline by day 3–4 post-dosing (mTreg CTLA-4 MFI = 1,539, SE = 65, range 877–2,411, n = 32; and mTreg FOXP3 MFI = 1,174, SE = 68, range 580–2,009, n = 34). (G) Concurrent with these changes on day 1, there was an increase in proliferation of mTregs in blood (baseline Ki-67+ mTreg = 15.27%, SE = 0.86%, range 7.10%–30.20%, n = 33). (H) Intracellular staining of Tregs from whole blood for FOXP3 showed an increase in FOXP3+ Tregs on day 3 (FOXP3+ Tregs/CD4+ T cells = 6.44%, SE = 0.25%, range 4.03%–10.30%, n = 37). (I) Analysis of FOXP3 gene demethylation on total Tregs and CD62Llow (effector memory) and CD62Lhigh (central memory) CD4+ memory T cells sorted from whole blood at pretreatment, post-treatment (day 3), and the last visit (day 60) showing stability of this Treg phenotype. (K) Tregs expanded in vivo at day 3 post-aldesleukin suppressed in vitro proliferation of autologous Teffs equivalently to Tregs at day in a suppression assay across the dose range (Treg:Teff ratio) tested. Error bars in (I) and (K) represent SEs. (J) Predictive cubic models based on the study data for CD25, pSTAT5, and Treg responses at the doses identified to increase Tregs by 10% and 20%. The error bars present the 95% confidence intervals around the predictions by these models. CM, central memory; EM, effector memory; MFI, mean fluorescent intensity; mTreg, memory regulatory T cell.
Fig 8
Fig 8. Effects of aldesleukin on effector T cell number, phenotypes, and proliferation.
(A) mTeffs were responsive to aldesleukin, with their frequencies as a percentage of non-regulatory CD4+ T cells altered in circulation (B), resulting in opposing effects, with lower doses leading to higher mTeff frequencies and higher doses leading to reduced frequencies (average baseline mTeff percent of non-regulatory CD4+ T cells: 61.1%, SE = 1.9%, range 38.6%–87.4%, n = 37). (C and D) There was increased pSTAT5 in mTeffs (mTeff pSTAT5 MFI = 7, SE = 0.3, range 4–13, n = 36). Concurrently there was a dose-dependent decrease in CD25 (average baseline mTeff CD25 MFI = 1,005, SE = 31, range 676–1,436, n = 37) (E and F) and in CD122 (MFI = 137, SE = 7, range 59–248, n = 33) (G and H). (I and J) There was a dose-dependent increase in proliferation of mTeffs as measured by an increase in Ki-67+ mTeffs over the 7 d following treatment (baseline Ki-67+ Teffs = 2.92%, SE = 0.32%, range 0.75%–10.40%, n = 33). MFI, mean fluorescence intensity; mTeff, memory effector T cell; Treg, regulatory T cell.
Fig 9
Fig 9. Effects of aldesleukin on NK CD56bright cell number, phenotypes, and proliferation.
(A and B) NK CD56bright cells showed a rapid dose-dependent decline, with the majority of cells not in circulation at 90 min (NK CD56bright cells percent of lymphocytes: 0.41%, SE = 0.03%, range 0.09%–0.96%, n = 38). (C) Concurrent with this decline is a dose-dependent increase in NK CD56bright cell pSTAT5 levels (baseline pSTAT5 MFI = 16.55, SE = 0.70, range 9.51–27.87, n = 37). (D and E) There was a sustained dose-dependent reduction in expression of CD25 (MFI = 642, SE = 32, range 255–1,148, n = 38) on NK CD56bright cells and (F) a transient reduction in CD122 at 90 min (G) followed by a linear dose-dependent increase on day 1 (baseline CD122 MFI = 6,605, SE = 213, range 3,786–9,554, n = 38). (H) The outcome of treatment was increased proliferation of NK CD56bright cells (baseline percentage of Ki-67+ NK CD56bright cells = 9.9%, SE = 0.9%, range 3.35%–25.9%, n = 30). MFI, mean fluorescence intensity; NK, natural killer.
Fig 10
Fig 10. Aldesleukin upregulates CXCR3 and CCR6 on regulatory T cells.
(A and B) Dose-dependent sustained increase in expression of CXCR3 on mTregs (CXCR3 average baseline MFI 2252 (45.08; 1783–3193) n = 35). (C and D) The increase in CCR6 expression by mTregs was maximal and dose dependent on Day 1 (CCR6 MFI 1523 (31; 1106–1973) n = 37). MFI, mean fluorescence intensity; Treg, regulatory T cell.

References

    1. Atkinson MA, Eisenbarth GS, Michels AW. Type 1 diabetes. Lancet. 2014;383:69–82. 10.1016/S0140-6736(13)60591-7 - DOI - PMC - PubMed
    1. McKnight JA, Wild SH, Lamb MJ, Cooper MN, Jones TW, Davis EA, et al. Glycaemic control of Type 1 diabetes in clinical practice early in the 21st century: an international comparison. Diabet Med. 2015;32:1036–1050. 10.1111/dme.12676 - DOI - PubMed
    1. Miller KM, Foster NC, Beck RW, Bergenstal RM, DuBose SN, DiMeglio LA, et al. Current state of type 1 diabetes treatment in the U.S.: updated data from the T1D Exchange clinic registry. Diabetes Care. 2015;38:971–978. 10.2337/dc15-0078 - DOI - PubMed
    1. Herold KC, Gitelman SE, Willi SM, Gottlieb PA, Waldron-Lynch F, Devine L, et al. Teplizumab treatment may improve C-peptide responses in participants with type 1 diabetes after the new-onset period: a randomised controlled trial. Diabetologia. 2013;56:391–400. 10.1007/s00125-012-2753-4 - DOI - PMC - PubMed
    1. Pescovitz MD, Greenbaum CJ, Krause-Steinrauf H, Becker DJ, Gitelman SE, Goland R, et al. Rituximab, B-lymphocyte depletion, and preservation of beta-cell function. N Engl J Med. 2009;361:2143–2152. 10.1056/NEJMoa0904452 - DOI - PMC - PubMed

Publication types

MeSH terms

Associated data

LinkOut - more resources