. 2016 Oct 11;11(10):e0164533.
doi: 10.1371/journal.pone.0164533. eCollection 2016.

Microbiome and Exudates of the Root and Rhizosphere of Brachypodium distachyon, a Model for Wheat

Affiliations

Microbiome and Exudates of the Root and Rhizosphere of Brachypodium distachyon, a Model for Wheat

Akitomo Kawasaki et al. PLoS One. .

Abstract

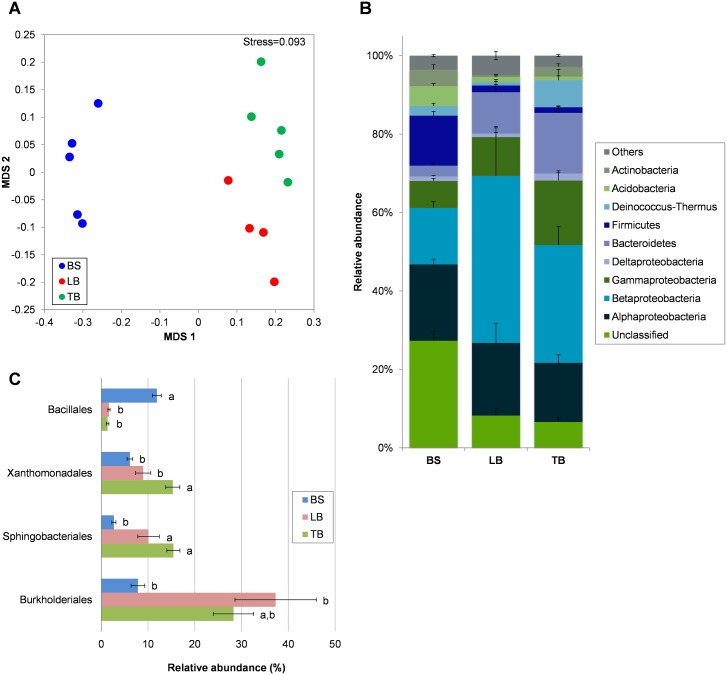
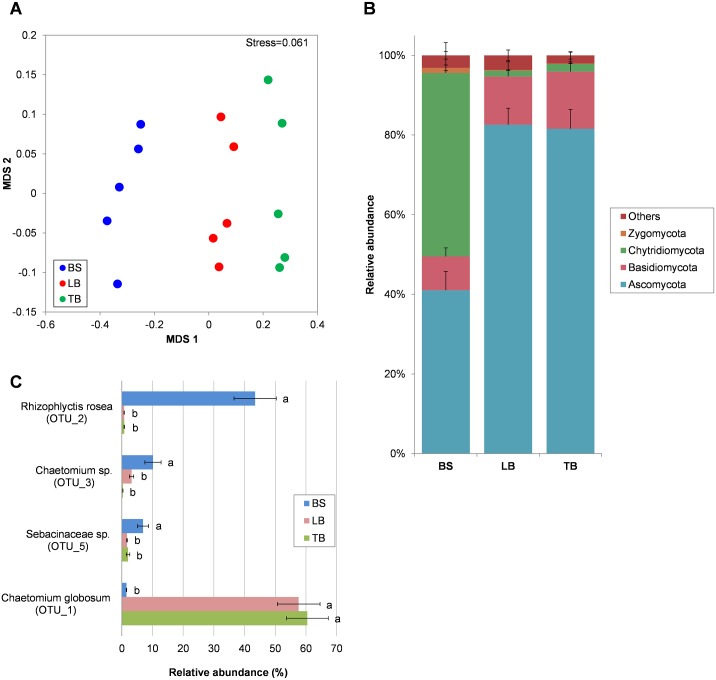
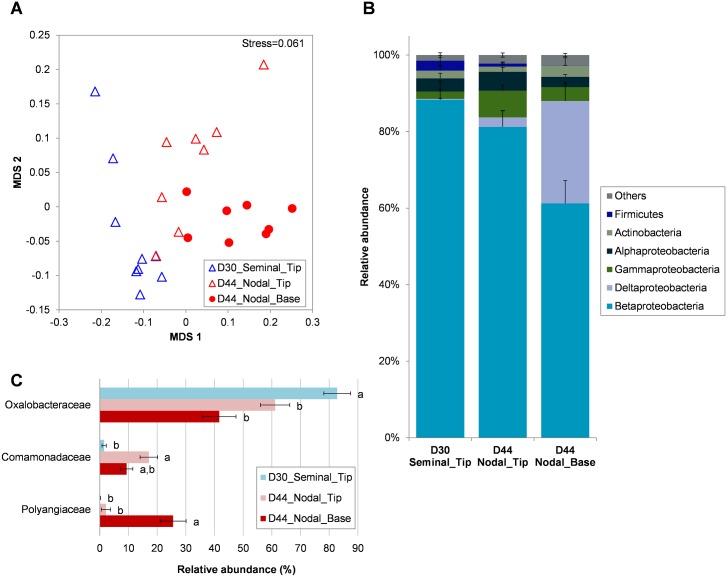
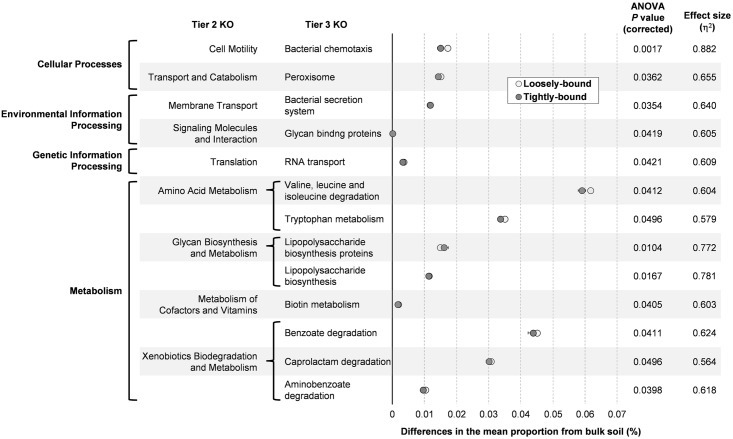
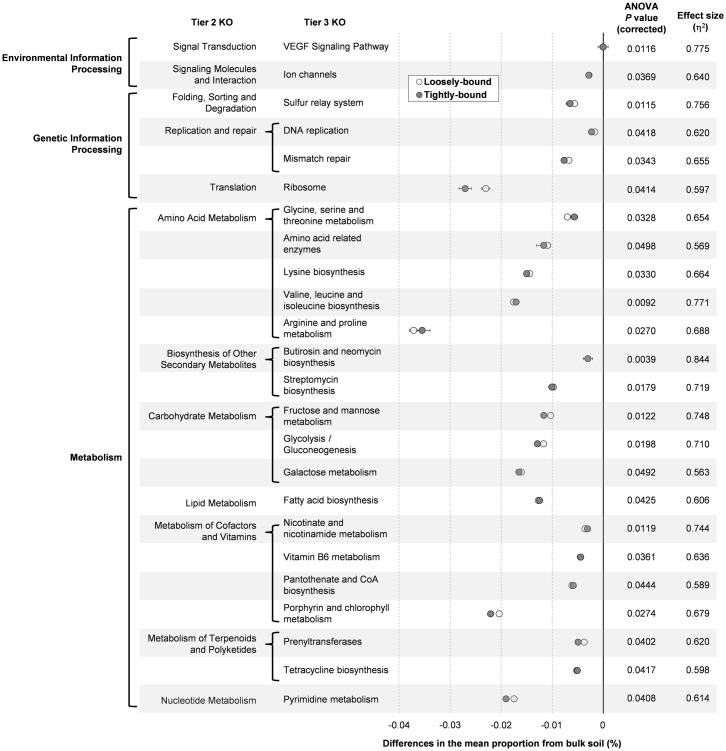
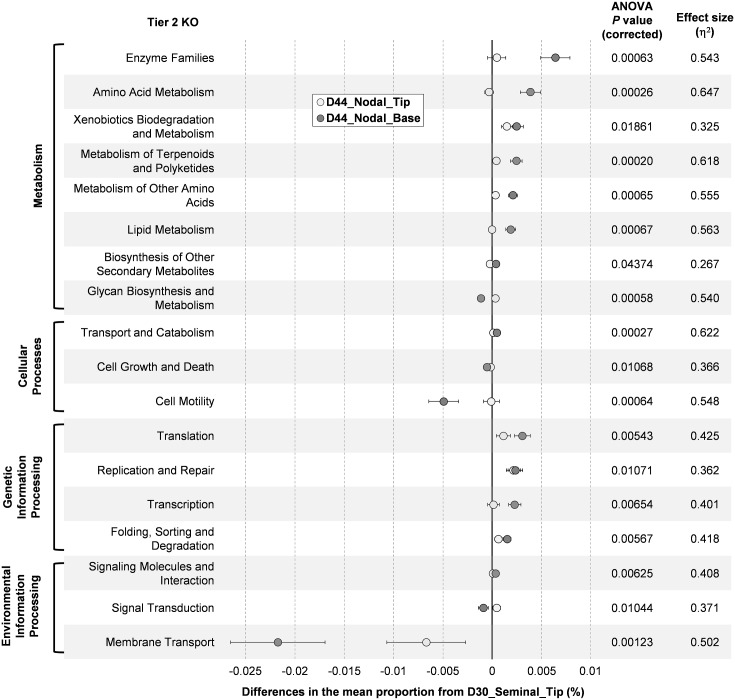
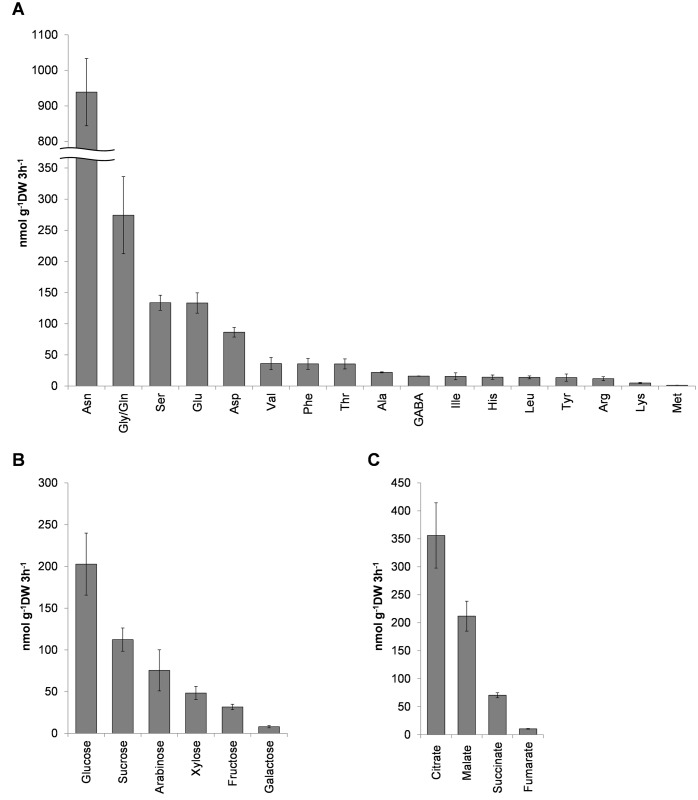
The rhizosphere microbiome is regulated by plant genotype, root exudates and environment. There is substantial interest in breeding and managing crops that host root microbial communities that increase productivity. The eudicot model species Arabidopsis has been used to investigate these processes, however a model for monocotyledons is also required. We characterized the rhizosphere microbiome and root exudates of Brachypodium distachyon, to develop it as a rhizosphere model for cereal species like wheat. The Brachypodium rhizosphere microbial community was dominated by Burkholderiales. However, these communities were also dependent on how tightly they were bound to roots, the root type they were associated with (nodal or seminal roots), and their location along the roots. Moreover, the functional gene categories detected in microorganisms isolated from around root tips differed from those isolated from bases of roots. The Brachypodium rhizosphere microbiota and root exudate profiles were similar to those reported for wheat rhizospheres, and different to Arabidopsis. The differences in root system development and cell wall chemistry between monocotyledons and eudicots may also influence the microorganism composition of these major plant types. Brachypodium is a promising model for investigating the microbiome of wheat.


Conflict of interest statement

The authors have declared that no competing interests exist. Please note that the Forschungszentrum Juelich is not a private entity. It is a public, not-for-profit research centre focusing on societal research needs (with majority public funds, and these from German Federal Government (90%) and State Government (10%)) (http://www.fz-juelich.de/portal/EN/AboutUs/FactsFigures/_node.html), and is a member of the Helmholtz Association of German research centres, Germany's largest public research association dedicated to research for state and society (https://www.helmholtz.de/en/about_us/).

Figures

Fig 1
Fig 1. Bacterial community in the bulk soil (BS) and in the loosely-bound (LB) and tightly-bound (TB) fractions of the Brachypodium Bd21-3 rhizosphere, revealed with 16S pyrosequencing.
(A) NMDS ordination plot (based on Bray-Curtis similarity), where each point represents the bacterial community in a soil/rhizosphere fraction for one plant. (B) Abundance of bacterial phyla in the bulk soil and rhizosphere (Proteobacteria is further classified into classes). (C) Bacterial Orders that are significantly different in abundance between the sample groups (different lower case letters indicate ANOVA P<0.05). Only Orders with >10% relative abundance in any sample type are shown. Means are shown ± SE (n = 4–5).
Fig 2
Fig 2. Fungal community in the bulk soil (BS) and in the loosely-bound (LB) and tightly-bound (TB) fractions of the Brachypodium Bd21-3 rhizosphere, revealed with ITS Illumina sequencing.
(A) NMDS ordination plot (based on Bray-Curtis similarity, data were 4th root transformed) where each point represents the fungal community in a soil/rhizosphere fraction for one plant. (B) Abundance of fungal phyla in the bulk soil and rhizosphere. (C) Fungal OTUs that are significantly different in abundance between the sample groups (different lower case letters indicate ANOVA P<0.05). Only OTUs with >5% relative abundance in any sample type are shown. Means are shown ± SE (n = 5).
Fig 3
Fig 3. 16S pyrosequencing revealed the bacterial communities colonizing the seminal root tip at day 30, and the root tip and base of nodal roots at day 44.
(A) NMDS ordination plot (based on Bray-Curtis similarity) where each point represents the bacterial community in one root sample. (B) Abundance of bacterial phyla in each root type (Proteobacteria further classified into classes). (C) Bacterial families significantly different in abundance between root types (different lower case letters indicate ANOVA P<0.05). Only Orders with >10% relative abundance in any root type are shown. Data are means ± SE (n = 8–9).
Fig 4
Fig 4. PICRUSt predicted bacterial functional gene content that was increased in the Brachypodium rhizosphere.
Differences in the abundance of categorized gene functions (tier 3 KO) in the loosely-bound and tightly-bound rhizospheres are plotted against the bulk soil (= 0 on the x-axis). Only categories that were significantly more abundant in the rhizospheres (both loosely-bound and tightly-bound) compared to bulk soil are shown (ANOVA, Benjamini-Hochberg FDR corrected P < 0.05). Data are means ± SE (n = 4–5).
Fig 5
Fig 5. PICRUSt predicted bacterial functional gene content that was decreased in the Brachypodium rhizosphere.
Differences in the abundance of categorized gene functions (tier 3 KO) in the loosely-bound and tightly-bound rhizospheres are plotted against the bulk soil (= 0 on the x-axis). Only categories that were significantly decreased in the rhizospheres (both loosely-bound and tightly-bound) compared to bulk soil are shown (ANOVA, Benjamini-Hochberg FDR corrected P < 0.05). Data are means ± SE (n = 4–5).
Fig 6
Fig 6. Bacterial functional gene content in the Brachypodium seminal and nodal roots inferred by PICRUSt.
Differences in the abundance of categorized gene functions (tier 2 KO) between the nodal roots (D44_Nodal_Tip and D44_Nodal_Base) are plotted against seminal roots (D30_Seminal_Tip) (= 0 on the x-axis). Only categories that were significantly different in abundance are shown (ANOVA, Benjamini-Hochberg FDR corrected P < 0.05). Data are means ± SE (n = 8–9).
Fig 7
Fig 7. Root exudates composition of Brachypodium.
Amount of (A) amino acids, (B) sugars, and (C) organic anions released from Brachypodium roots in 3h root exudate collection period. Data are means ± SE (n = 4 (A and B) or 9 (C)).

References

    1. Draper J, Mur LAJ, Jenkins G, Ghosh-Biswas GC, Bablak P, Hasterok R, et al. Brachypodium distachyon. A new model system for functional genomics in grasses. Plant Physiol. 2001;127(4):1539–55. 10.1104/pp.010196 WOS:000172824500032. - DOI - PMC - PubMed
    1. Vogel JP, Garvin DF, Leong OM, Hayden DM. Agrobacterium-mediated transformation and inbred line development in the model grass Brachypodium distachyon. Plant Cell Tissue Organ Cult. 2006;84(2):199–211. 10.1007/s11240-005-9023-9. WOS:000237967000008. - DOI
    1. Vogel J, Hill T. High-efficiency Agrobacterium-mediated transformation of Brachypodium distachyon inbred line Bd21-3. Plant Cell Rep. 2008;27(3):471–8. 10.1007/s00299-007-0472-y WOS:000253202100007. - DOI - PubMed
    1. Budak H, Hernandez P, Schulman HA. Analysis and exploitation of cereal genomes with the aid of Brachypodium In: Tuberosa R, Graner A, Frison E, editors. Genomics of plant genetic resources: Volume 1 Managing, sequencing and mining genetic resources. Dordrecht: Springer Netherlands; 2014. p. 585–613. 10.1007/978-94-007-7572-5_24 - DOI
    1. Unver T, Budak H. Conserved microRNAs and their targets in model grass species Brachypodium distachyon. Planta. 2009;230(4):659–69. 10.1007/s00425-009-0974-7 WOS:000269209600006. - DOI - PubMed

MeSH terms

LinkOut - more resources