

Between-Batch Pharmacokinetic Variability Inflates Type I Error Rate in Conventional Bioequivalence Trials: A Randomized Advair Diskus Clinical Trial
- PMID: 27727445
- PMCID: PMC5324827
- DOI: 10.1002/cpt.535
Between-Batch Pharmacokinetic Variability Inflates Type I Error Rate in Conventional Bioequivalence Trials: A Randomized Advair Diskus Clinical Trial
Abstract
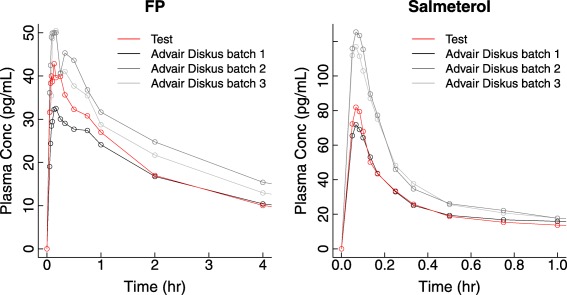
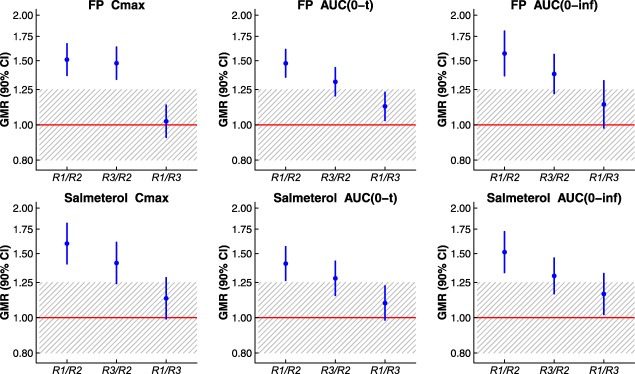
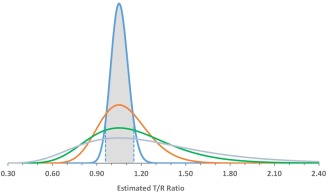
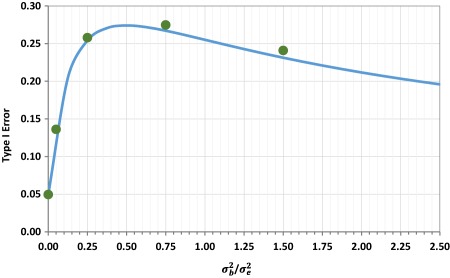
We previously demonstrated pharmacokinetic differences among manufacturing batches of a US Food and Drug Administration (FDA)-approved dry powder inhalation product (Advair Diskus 100/50) large enough to establish between-batch bio-inequivalence. Here, we provide independent confirmation of pharmacokinetic bio-inequivalence among Advair Diskus 100/50 batches, and quantify residual and between-batch variance component magnitudes. These variance estimates are used to consider the type I error rate of the FDA's current two-way crossover design recommendation. When between-batch pharmacokinetic variability is substantial, the conventional two-way crossover design cannot accomplish the objectives of FDA's statistical bioequivalence test (i.e., cannot accurately estimate the test/reference ratio and associated confidence interval). The two-way crossover, which ignores between-batch pharmacokinetic variability, yields an artificially narrow confidence interval on the product comparison. The unavoidable consequence is type I error rate inflation, to ∼25%, when between-batch pharmacokinetic variability is nonzero. This risk of a false bioequivalence conclusion is substantially higher than asserted by regulators as acceptable consumer risk (5%).
© 2016 The Authors Clinical Pharmacology & Therapeutics published by Wiley Periodicals, Inc. on behalf of The American Society for Clinical Pharmacology and Therapeutics.
Figures
References
-
- British Thoracic Society, Scottish Intercollegiate Guidelines Network . British guideline on the management of asthma. Thorax 63 (suppl. 4), iv1–iv121 (2008). - PubMed
-
- Global Initiative for Asthma (GINA) . Global strategy for asthma management and prevention. <www.ginasthma.org> (2009).
-
- National Institute of Health (NIH) . Guidelines for the Diagnosis and Management of Asthma–Expert Panel Report 3. US Department of Health and Human Services, Bethesda, MD: NIH Publication No. 07‐4051. <www.nhlbi.nih.gov/files/docs/guidelines/asthgdln.pdf> (2007).
-
- Draft Guidance on Fluticasone Propionate ; Salmeterol Xinafoate. U.S. Department of Health and Human Services, Food and Drug Administration, Center for Drug Evaluation and Research (CDER), September 2013.
-
- Evans, C. et al Equivalence considerations for orally inhaled products for local action—ISAM/IPAC‐RS European workshop report. J. Aerosol Med. Pulm. Drug Deliv. 25, 117–139 (2012). - PubMed
Publication types
MeSH terms
Substances
LinkOut - more resources
Full Text Sources
Other Literature Sources
Molecular Biology Databases
