. 2016 Oct 10;30(4):533-547.
doi: 10.1016/j.ccell.2016.09.003.

Distinct Functions of Senescence-Associated Immune Responses in Liver Tumor Surveillance and Tumor Progression

Affiliations

Distinct Functions of Senescence-Associated Immune Responses in Liver Tumor Surveillance and Tumor Progression

Tobias Eggert et al. Cancer Cell. .

Abstract

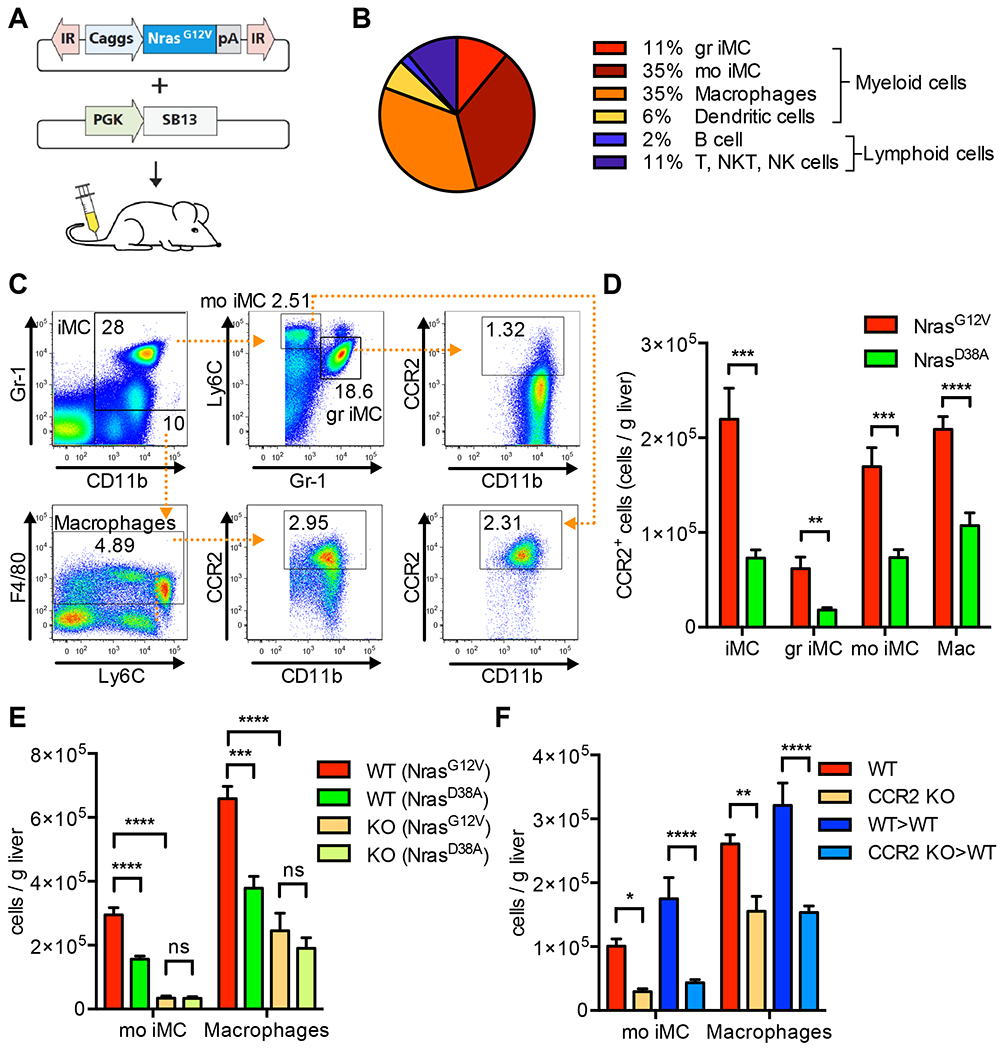
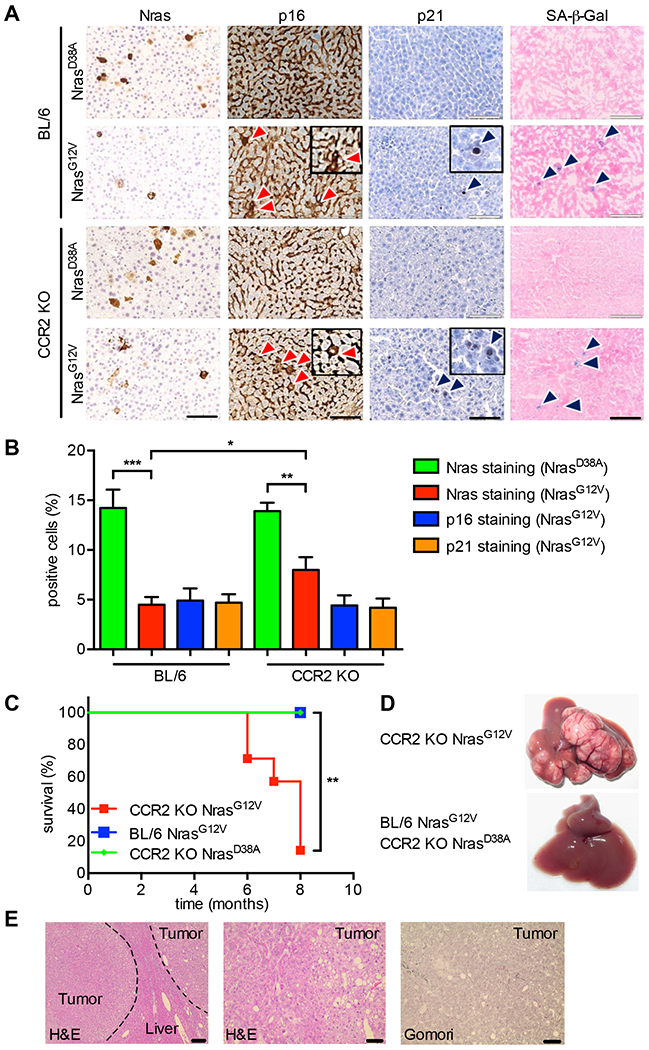
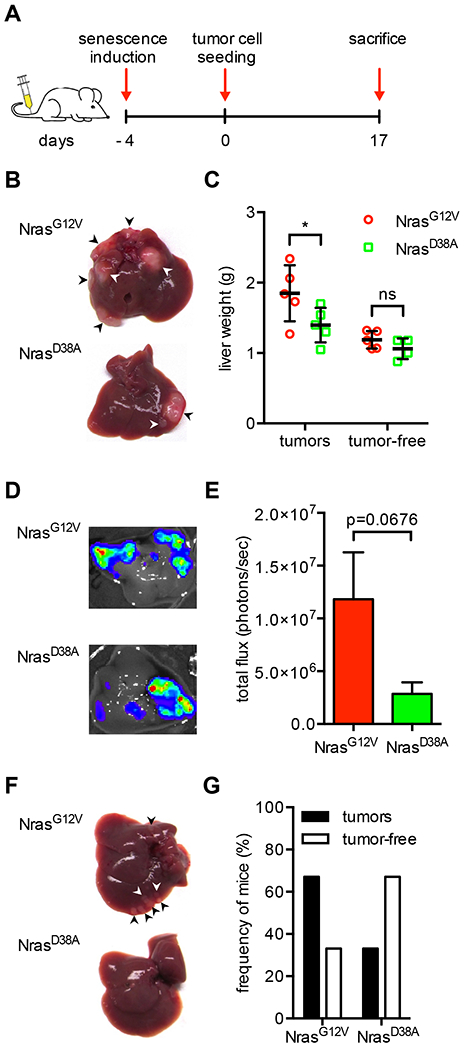
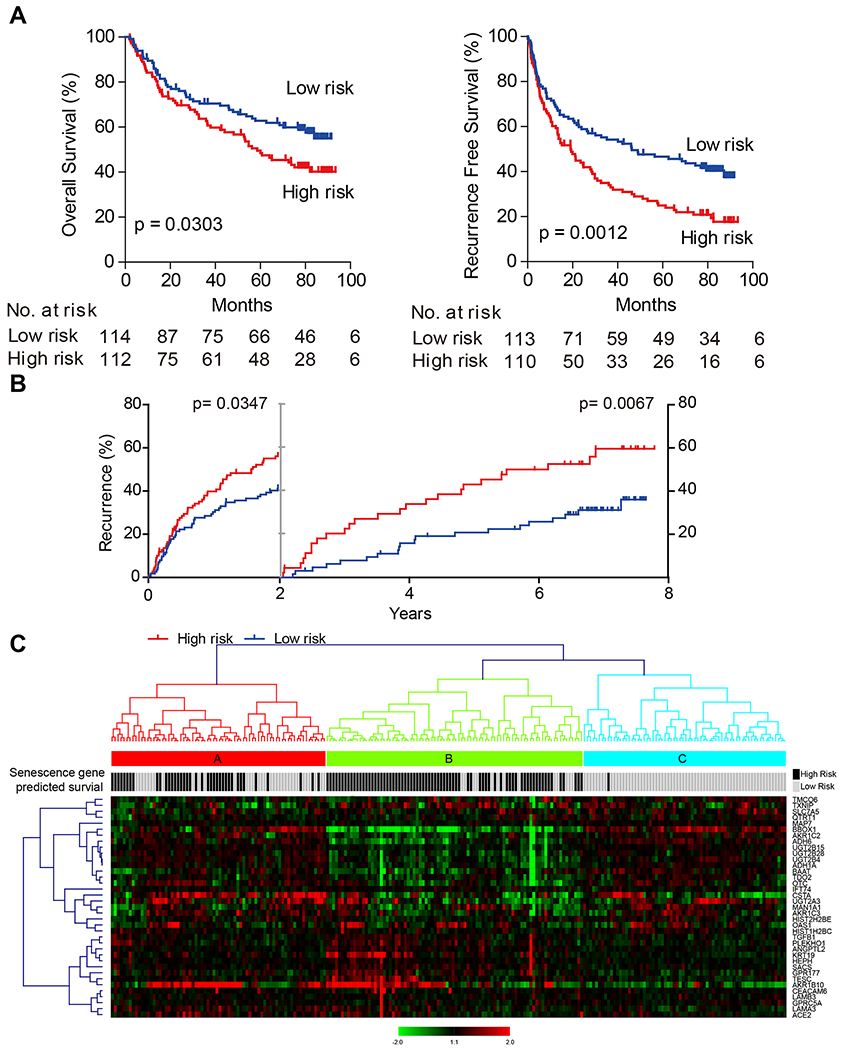
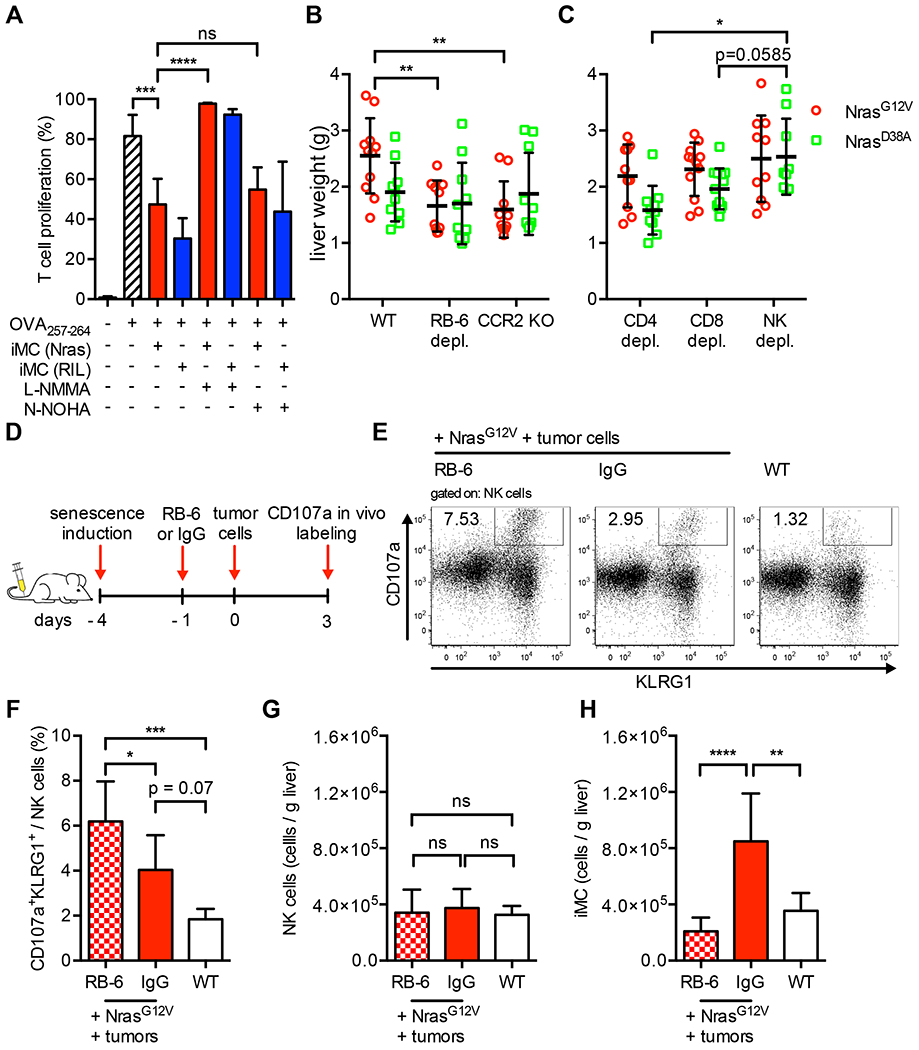
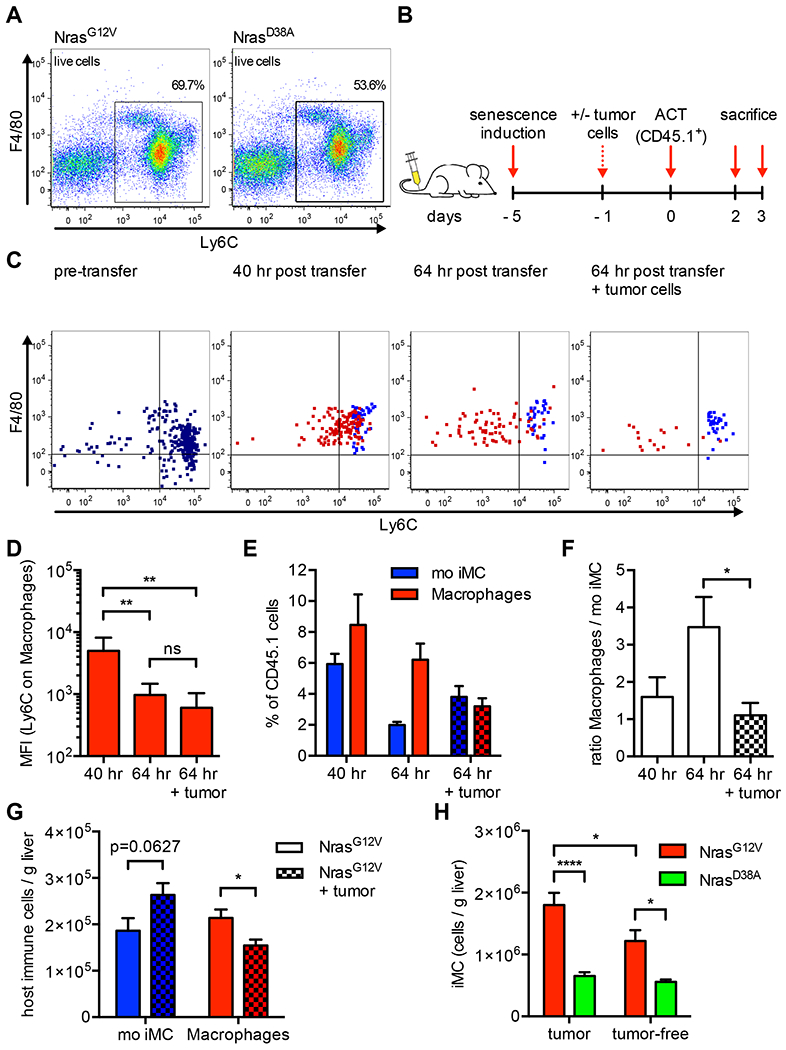
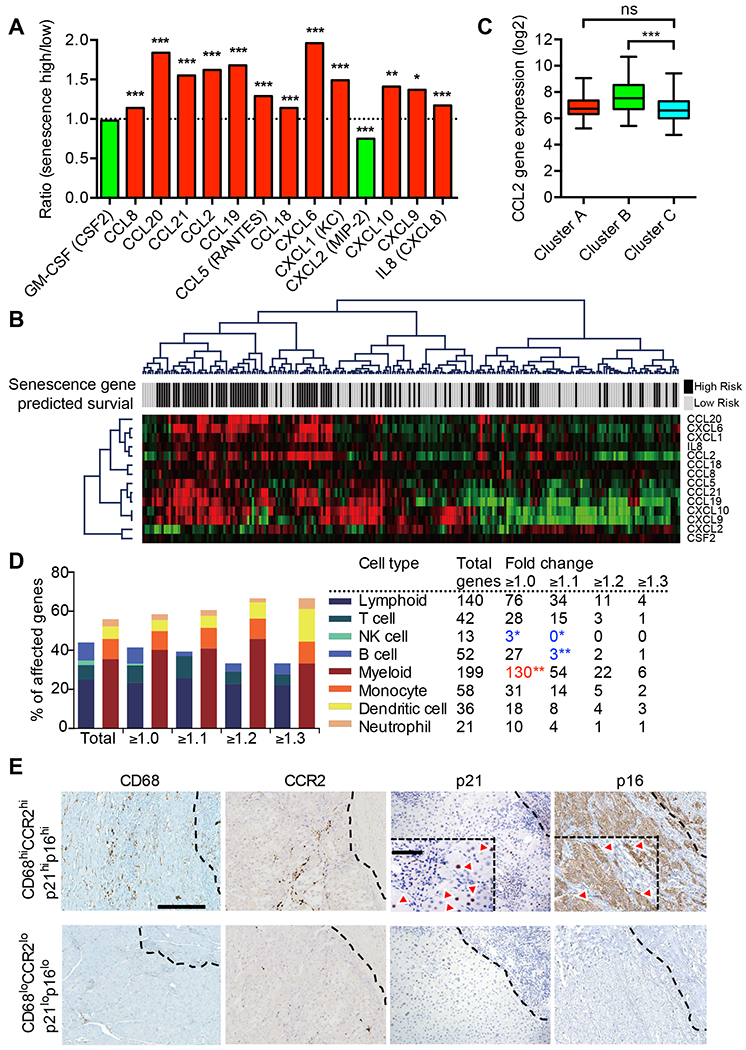
Oncogene-induced senescence causes hepatocytes to secrete cytokines, which induce their immune-mediated clearance to prevent tumor initiation, a process termed "senescence surveillance." However, senescent hepatocytes give rise to hepatocellular carcinomas (HCCs), if the senescence program is bypassed or if senescent cells are not cleared. Here, we show context-specific roles for CCR2+ myeloid cells in liver cancer. Senescence surveillance requires the recruitment and maturation of CCR2+ myeloid cells, and CCR2 ablation caused outgrowth of HCC. In contrast, HCC cells block the maturation of recruited myeloid precursors, which, through NK cell inhibition, promote growth of murine HCC and worsen the prognosis and survival of human HCC patients. Thus, while senescent hepatocyte-secreted chemokines suppress liver cancer initiation, they may accelerate the growth of fully established HCC.

Keywords: CCL2; CCR2; HCC; MDSC; NK cells; hepatocellular carcinoma; liver cancer; macrophages; myeloid cells; senescence.


Figures

Figure 1.
Figure 1.
The CCL2-CCR2 axis mediates myeloid cell accumulation in senescent livers. (A) Schematic representation of cellular senescence induction in mouse livers. (B) CCR2+ hepatic immune cells (NrasG12V). Distribution of CCR2-expressing immune cell subsets among liver infiltrating immune cells in NrasG12V injected mice analyzed by flow cytometry. (C and D) Quantification of CCR2+ myeloid cell subsets by flow cytometry 6 days after delivery of indicated genes in livers of C57BL/6 mice. iMC: immature myeloid cells; gr iMC: granulocytic iMC; mo iMC: monocytic iMC; Mac: macrophages. (C) Representative dot plots and gating of monocytic and granulocytic iMC and macrophages. Numbers within dot plots indicate frequency of gated cells among live cells. (D) The total cell number per g liver tissue of CCR2+ myeloid cell subsets 6 days after delivery of indicated genes. (E) Quantification of the total cell number of mo iMC and macrophages by flow cytometry 5 days after delivery of indicated genes in livers of C57BL/6 or CCR2 KO mice. (F) Quantification of the total cell number of hepatic mo iMC and macrophages by flow cytometry 5 days after hydrodynamic delivery of NrasG12V into C57BL/6, CCR2 KO mice and WT→T and CCR2 KO→WT chimeric mice. Values are mean ± SEM; *p ≤ 0.05, **p ≤ 0.01, ***p ≤ 0.001, ****p ≤ 0.0001, ns = not statistically significant, Student’s t-test was used in Figure 1D, Two-way ANOVA was used in Figure 1E and 1F to calculate statistical significance. Each experiment was performed 2 or 3 times with n ≥ 6 mice per group. See also Figures S1 and S2.
Figure 2.
Figure 2.
‘Senescence surveillance’ is inhibited in CCR2 KO mice and results in development of aggressive HCCs. (A and B) Quantification of Nras-, p16-, p21-, and SA-β-Gal positive, cells 12 days after intrahepatic delivery of NrasG12V or NrasD38A on liver sections from C57BL/6 wild-type or CCR2 KO mice, with (A) showing representative liver sections. Arrow heads in (A) indicating positive staining. (C) Kaplan-Meier survival curve of C57BL/6 wild-type or CCR2 KO mice after NrasG12V (both strains) or NrasD38A (CCR2 KO only) delivery. (D) Representative macroscopic images of livers from C57BL/6 wild-type or CCR2 KO mice 7 months after NrasG12V (both strains) or NrasD38A (CCR2 KO only) delivery. (E) H&E staining (left: 1x40, scale bar: 200 μm; middle: 1x100, scale bar: 100 μm) and Gomori staining (right: 1x100, scale bar: 100 μm) of liver tumors isolated from a CCR2 KO mouse six months after stable intrahepatic delivery of oncogenic NrasG12V via transposable elements. Explanted liver tumors were diagnosed as multinodular HCC (G2) with nodule-in-nodule growth and steatohepatitic features; focal dense portal lymphoid infiltrates suggestive of incipient lymphoma. Each experiment was performed 2 times with n = 4-6 mice per group. Scale bars represent 100 μm. Values are mean ± SEM; *p ≤ 0.05, **p ≤ 0.01, ***p ≤ 0.001. Student’s t-test was used in Figure 2B to calculate statistical significance. See also Figure S3.
Figure 3.
Figure 3.
Peritumoral senescence promotes tumor growth of murine liver carcinomas. (A) Schematic representation of the experimental protocol. 4 days after hydrodynamic injection, either 1x10⁵ or 3x10⁵ RIL175 cells were seeded into the liver via intrasplenic injection and mice were sacrificed 17 days after tumor cell seeding. (B) Macroscopic images of mouse livers after 3x10 RIL175 cells were seeded into NrasG12V or NrasD38A injected mice. Arrowheads indicate tumor nodules. (C) Liver weight of NrasG12V or NrasD38A injected mice with or without tumor cell seeding depicted in Figure 3B, n=5 mice per group. (D) Representative bioluminescence images of livers 17 days after tumor cell seeding in NrasG12V or NrasD38A injected mice. (E) Relative luminescence of liver tumors depicted in Figure 3D, n=15 mice per group. (F) Representative images of livers from mice that received 1x10⁵ RIL175 cells, n=6 mice per group. Arrowheads indicate macroscopically detected tumor nodules. (G) Frequency of livers that did (black bars) or did not (white bars) show macroscopically visible tumors in Nras or Nras injected mice depicted in Figure 3F. Values in Figure 3C are mean ± SD and in Figure 3E mean ± SEM; *p ≤ 0.05, ns = not statistically significant, Two-way ANOVA was used in Figure 3C and Student’s t-test was used in Figure 3E to calculate statistical significance. Each experiment was performed ≥ 3 times with a total of n ≥ 5 mice per group. See also Figure S4.
Figure 4.
Figure 4.
Senescence in peritumoral tissue is associated with poor survival in HCC patients. (A) Kaplan-Meier survival analyses of 226 Chinese HCC cases based on survival risk prediction results of the senescence-associated gene signature in non-tumor tissue. Overall survival of 226 patients and recurrence free survival of 223 HCC patients are shown. (B) Tumor recurrence in 223 Chinese HCC cases described in panel A. (C) Hierarchical clustering of 37 senescence-associated genes that are significantly associated with HCC survival. Each column represents an individual tissue sample. Genes were ordered by centered correlation and complete linkage. The scale represents gene expression levels from −2.0 to 2.0 in log 2 scale. Each case status is categorized by the senescence-associated gene signature described in Figure 4A. See also Figure S5 and Tables S1 and S2.
Figure 5.
Figure 5.
Senescence-recruited CCR2+ immunosuppressive myeloid cells induce liver tumor growth promotion via NK cell inhibition. (A) T cell proliferation inhibition by iMC assessed with flow cytometry. Hepatic CD11b+Gr-1+ cells were purified from NrasG12V injected (“Nras”) or subcutaneous RIL175 tumor bearing mice (“RIL”), which served as positive controls, and co-incubated with 105 OT-I cells at 1:1 ratio, in the presence of 0.1 μg/ml OVA257-264 peptide. 0.5 mM N-NOHA or 0.5 mM L-NMMA were used to block activity of arginase and iNOS, respectively. (B) Liver weight after gene delivery and tumor cell seeding with or without immature myeloid cell depletion in C57BL/6 wild-type (WT) mice or CCR2 KO mice. iMC were depleted 24 hours before RIL175 seeding by one time administration of anti-Gr-1 antibody (clone: RB6-8C5), n ≥ 10 mice per group. (C) Liver weight after hydrodynamic gene delivery and tumor cell seeding in C57BL/6 mice with depleted immune cells. CD4+ cells or CD8+ cells were depleted by i.p. administration of 200 μg GK1.5 antibody or 2.43 antibody 24 hours before and 7 days after RIL175 seeding, respectively. NK cells were depleted by i.v. injection of 600 μg of PK136 antibody 24 hours before and 1 and 4 days after RIL175 seeding, n ≥ 10 mice per group. (D) Schematic representation of the experimental protocol for the NK cell degranulation assay with results depicted in Figure 5E-5H. 3 days after NrasG12V injection, mice received either iMC-depleting anti-Gr-1 antibody (clone: RB6-8C5, “RB-6”) or IgG antibody i.p., followed by seeding of 3x10⁵ RIL175 tumor cells into the liver 24 hr later. 3 Days after tumor cell seeding, anti-CD107a PE antibody was injected i.v. and 4 hours later, mice were euthanized and liver leukocytes isolated for analysis by flow cytometry, n = 9 mice per group. Untreated wild-type mice served as controls, n = 4 mice. (E and F) Representative dot plot of CD107a and KLRG1 staining on NK cells (E) and quantification of CD107a+KLRG1+ NK cells among all hepatic NK cells (F). Absolute number of cells per gram liver tissue of NK cells (G) and iMC (H) quantified by flow cytometry. Values are mean ± SD ; *p ≤ 0.05, **p ≤ 0.01, ***p ≤ 0.001, ****p ≤ 0.0001, ns = not statistically significant, One-way ANOVA was used in Figure 5A, 5F, 5G and 5H and Two-way ANOVA was used in Figure 5B and 5C to calculate statistical significance. Each experiment was performed 2 or 3 times. See also Figure S6.
Figure 6.
Figure 6.
Tumor cells inhibit maturation of monocytic iMC to macrophages in senescent livers. (A) Quantification of Ly6C+ monocytes by flow cytometry from bone marrows after hydrodynamic delivery of indicated genes in C57BL/6 mice. Gated on live cells. (B) Schematic representation of the experimental protocol for results depicted in Figure 6C-6G. 5 days after hydrodynamic NrasG12V delivery, CD45.1+ bone marrow monocytes from untreated wild-type mice were i.v. injected into mice with or without 3x10⁵ RIL175 tumor cell seeding 24 hours prior. Mice were euthanized 40 (2 days) or 64 hours (3 days) after adoptive monocyte transfer and hepatic myeloid cells were analyzed by flow cytometry. ACT: adoptive cell transfer. (C) Representative dot plot analysis of hepatic CD45.1+ cells in experimental setup depicted in Figure 6B. Dot plot color code illustrates cell gate: Purple dots: CD45.1+ live cells (post bone marrow monocyte isolation); blue dots: CD45.1+ mo iMC; red dots: CD45.1+ macrophages. (D) Mean fluorescent intensity (MFI) of Ly6C expression on macrophages. (E) Quantification of CD45.1+ mo iMC and CD45.1+ macrophages via flow cytometry. (F) Ratio of CD45.1+ Macrophages/ CD45.1+ mo iMC calculated from results depicted in Figure 6E. (G) The total cell number per g liver tissue of host (CD45.2+) mo iMC and macrophages 64 hours after adoptive cell transfer into mice receiving indicated treatment. (H) Quantification of immature myeloid cell accumulation by flow cytometry 7 days after delivery of indicated genes with or without RIL175 seeding on day 4. These mice did not receive adoptively transferred monocytes. Values are mean ± SEM; *p ≤ 0.05, **p ≤ 0.01, ****p ≤ 0.0001, ns = not statistically significant, One-way ANOVA was used in Figure 6D and 6F, Two-way ANOVA was used in Figure 6H and Student’s t-test was used in Figure 6G to calculate statistical significance. Each experiment was performed 2 or 3 times with n = 4 (40 hr group), n ≥ 6 (64 hr groups) and n ≥ 9 (Figure 6H) mice per group.
Figure 7.
Figure 7.
Increased chemokine expression and myeloid cell accumulation in senescent peritumoral tissue of HCC patients. (A) Results of a class comparison analysis between senescence high and low risk groups reported in Figure 4A revealed significant differential expression of 14 chemokine genes (p<0.01, FDR<0.01). (B) Hierarchical clustering of 14 chemokine genes reported in Figure 7A and senescence gene signature predicted survival. Each column represents an individual tissue sample. Genes were ordered by centered correlation and complete linkage. The scale represents gene expression levels from −2.0 to 2.0 in log 2 scale. Each case status is categorized by the senescence-associated gene signature described in Figure 4A. (C) Expression of the CCL2 gene in 3 patient groups identified by hierarchical clustering shown in Figure 4B. (D) Immune cell gene expression profiles based on senescence high and low risk subgroups defined by the senescence-associated gene signature. Among 1,622 immune cell genes defined by IRIS, 535 genes unique for each cell type were used to calculate % of affected genes. The total number of significantly expressed genes (adjusted p<0.05) with different fold changes is indicated. Blue numbers indicate significant gene depletion. Red number indicates significant gene enrichment. (E) Immunohistochemistry staining for myeloid cells (CD68), CCR2+ cells and senescent cells (p21 and p16) in peritumoral tissue of patients with HCC. Red arrows indicate p21 or p16 positive cells, respectively (scale bar: 100 μm; scale bar within rectangular inlay in p21 and p16 stainings: 25 μm). Representative images are shown for one patient each with either high or low abundance of peritumoral myeloid and senescent cells. Dotted lines represent the tumor margin, with tumor tissue shown in the upper right corner of each image. Values are mean ± SD; *p ≤ 0.05, **p ≤ 0.01, ***p ≤ 0.001, ns = not statistically significant. See also Figure S7.

Comment in

Similar articles

Cited by

References

    1. Acosta JC, Banito A, Wuestefeld T, Georgilis A, Janich P, Morton JP, Athineos D, Kang TW, Lasitschka F, Andrulis M, et al. (2013). A complex secretory program orchestrated by the inflammasome controls paracrine senescence. Nat Cell Biol 15, 978–990. - PMC - PubMed
    1. Acosta JC, and Gil J (2012). Senescence: a new weapon for cancer therapy. Trends in cell biology 22, 211–219. - PubMed
    1. Acosta JC, O’Loghlen A, Banito A, Guijarro MV, Augert A, Raguz S, Fumagalli M, Da Costa M, Brown C, Popov N, et al. (2008). Chemokine signaling via the CXCR2 receptor reinforces senescence. Cell 133, 1006–1018. - PubMed
    1. Cai L, Zhang Z, Zhou L, Wang H, Fu J, Zhang S, Shi M, Zhang H, Yang Y, Wu H, et al. (2008). Functional impairment in circulating and intrahepatic NK cells and relative mechanism in hepatocellular carcinoma patients. Clinical immunology 129, 428–437. - PubMed
    1. Conti I, and Rollins BJ (2004). CCL2 (monocyte chemoattractant protein-1) and cancer. Seminars in cancer biology 14, 149–154. - PubMed

Publication types