. 2016 Oct 10;30(4):563-577.
doi: 10.1016/j.ccell.2016.09.005.

N-Myc Induces an EZH2-Mediated Transcriptional Program Driving Neuroendocrine Prostate Cancer

Affiliations

N-Myc Induces an EZH2-Mediated Transcriptional Program Driving Neuroendocrine Prostate Cancer

Etienne Dardenne et al. Cancer Cell. .

Abstract

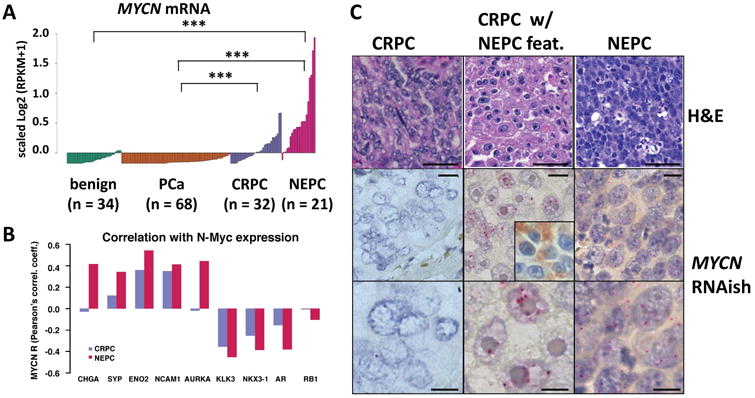
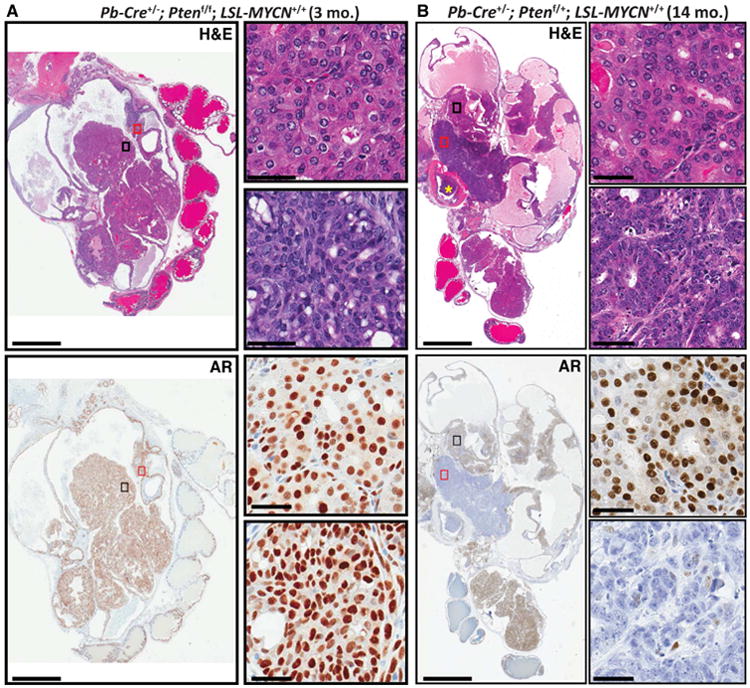
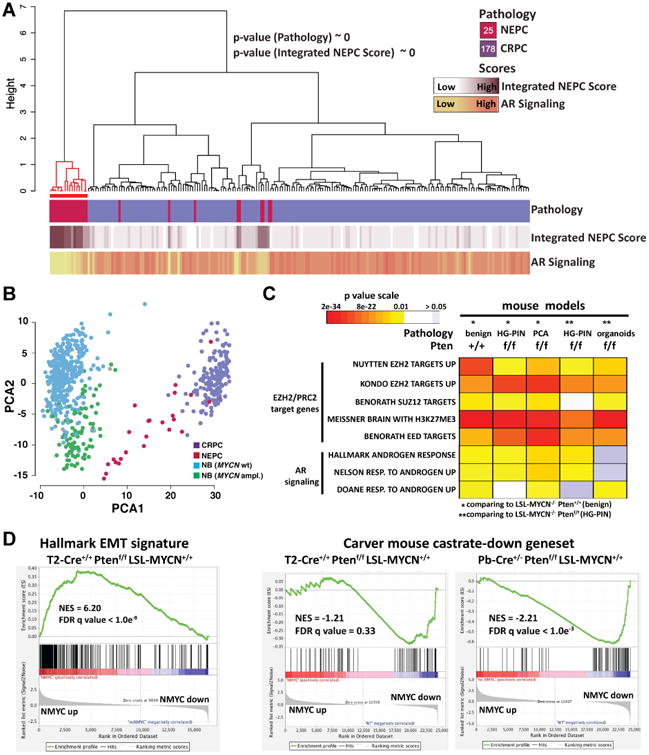
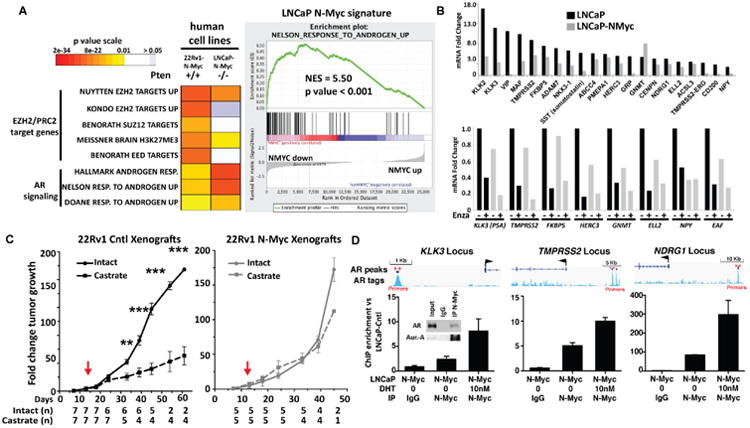
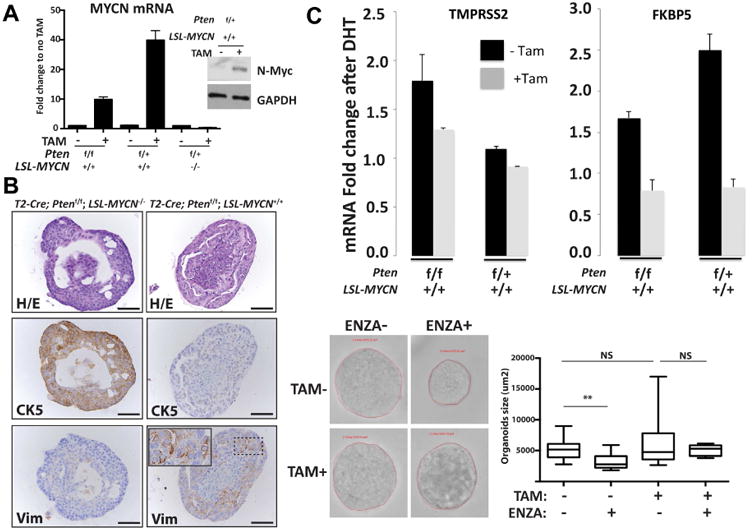
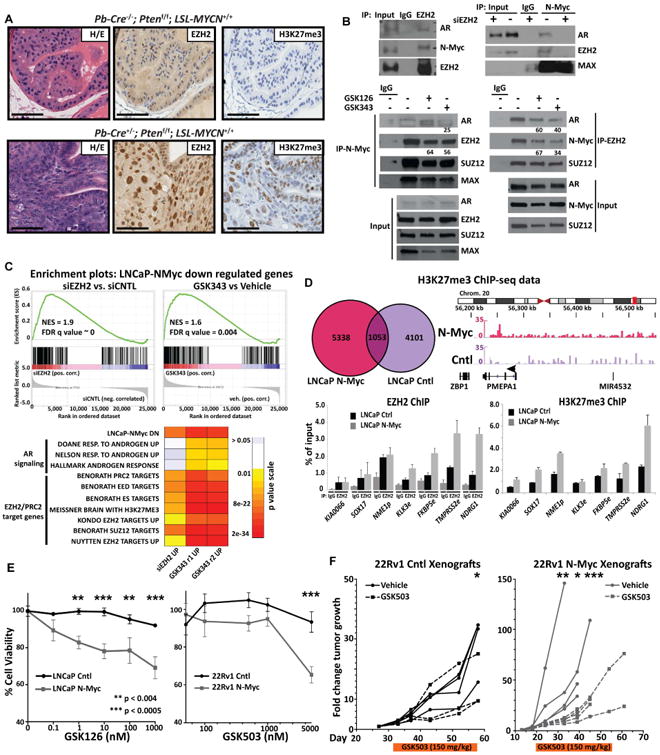
The transition from castration-resistant prostate adenocarcinoma (CRPC) to neuroendocrine prostate cancer (NEPC) has emerged as an important mechanism of treatment resistance. NEPC is associated with overexpression and gene amplification of MYCN (encoding N-Myc). N-Myc is an established oncogene in several rare pediatric tumors, but its role in prostate cancer progression is not well established. Integrating a genetically engineered mouse model and human prostate cancer transcriptome data, we show that N-Myc overexpression leads to the development of poorly differentiated, invasive prostate cancer that is molecularly similar to human NEPC. This includes an abrogation of androgen receptor signaling and induction of Polycomb Repressive Complex 2 signaling. Altogether, our data establishes N-Myc as an oncogenic driver of NEPC.

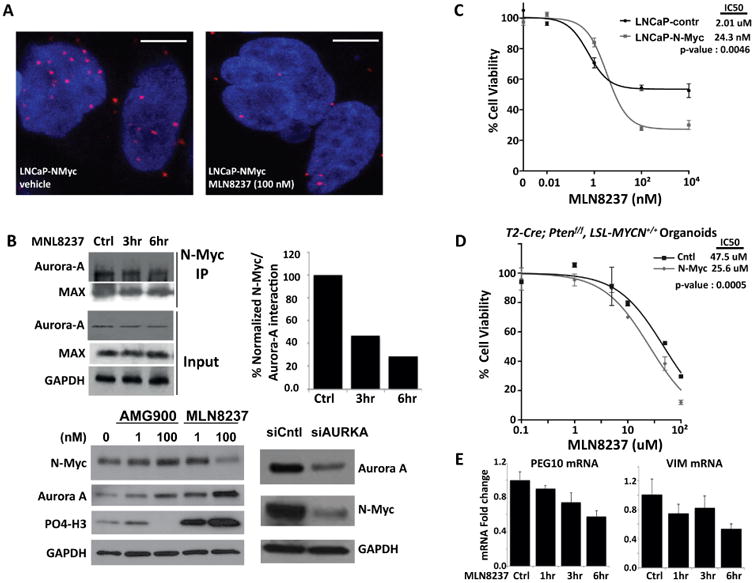
Keywords: Aurora kinase A; EZH2; N-Myc; castration-resistant prostate adenocarcinoma; genetically engineered mouse; neuroendocrine prostate cancer; prostate cancer organoid.


Figures

Figure 1
Figure 1. MYCN expression in prostate cancer
A. MYCN mRNA level in 34 benign prostate, 68 prostate adenocarcinoma (PCa), 32 castrate resistant prostate adenocarcinoma (CRPC) and 21 neuroendocrine prostate cancer (NEPC) clinical samples. (*** p-value < 2.17e-05, Wilcoxon test) B. Pearson's correlation coefficients between the gene expression level of MYCN and AR target genes or NE marker genes in CRPC or NEPC samples; * p-value < 0.05. C. RNA in situ hybridization (RNAish, red chromogen) of MYCN RNA in representative CRPC, CRPC with neuroendocrine features (inset: chromogranin A IHC), and NEPC case. (Original magnification: 20× for H&E (scale bar = 50 um, top), and 40× (scale bar = 25 um, center) and 100× scale bar = 10 um, bottom) for RNAish. See also Figure S1.
Figure 2
Figure 2. N-Myc over-expression is associated with aggressive, NEPC-like prostate cancer
A Photomicrograph images of H&E stained (top) or AR IHC (bottom) prostate tissue showing AR-positive intracystic carcinoma foci (black rectangle) and AR-positive basophilic foci (red rectangle), at low magnification (left, original magnification 4×, scale bar = 5 mm) and at high magnification (right, original magnification 40×, scale bar = 50 um); from a 3-month old Pb-Cre+/-; Ptenf/f; LSL-MYCN+/+. B. Photomicrograph images of H&E stained (top) or AR IHC (bottom) prostate tissue showing invasive, AR-positive adenocarcinoma foci (black rectangle) and AR-negative NEPC foci (red rectangle), at low magnification (left, original magnification 4×, scale bar = 5 mm) with bladder invasion (yellow asterisk) and at high magnification (right, original magnification 40×, scale bar = 50 um); from a 3-month old Pb-Cre+/-; Ptenf/f; LSL-MYCN+/+. See also Figures S2 S3 and Table S1, S2, S3.
Figure 3
Figure 3. Mouse N-Myc signature is clinically relevant
A Ward's hierarchical clustering of the normalized FPKM values of the 779 prioritized genes across 203 CRPCs samples from two independent cohorts (IPM Cornell 2011-15, SU2C-PCF 2015). Shown p-values results from the hyper-geometric test on CRPC-NE enriched cluster (red color). Pearson's correlation was used as distance measure for samples. Annotation tracks report pathology classification (top), values of Integrated NEPC Score (middle) and AR Signaling (bottom) (Darker colors indicate higher scores). The number of samples for each pathology classification is reported inside the square symbols of the corresponding legend. Red line indicates a subgroup enriched with pathology and NEPC score compared to rest of samples (hypergeometric mean p values are shown). The mouse N-Myc signature segregated the human samples into 2 groups, one significantly enriched with CRPC-NE samples based on pathological criteria (p value <10-20, hypergeometric test) that have high NEPC scores (p value ∼ 0, hypergeometric test). B. Projection of the expression levels of the 779 signature genes onto the first and second principal components analysis (PCA) of the 701 tumor samples RNA-seq data including 498 neuroblastoma (NB) samples (Zhang et al., 2015). Colors indicate tumor classes (CRPC, NEPC, NB with amplified MYCN, NB with WT MYCN). C. Heatmap of GSEA FDR q-values of AR induced genes and multiple PRC2 target gene sets that are significantly enriched in the N-Myc down-regulated genes identified in the indicated N-Myc expressing mouse genotypes compared to their non-N-Myc expressing counterparts. D. Right: GSEA enrichment plot of the hallmark EMT gene set with the corresponding statistical metrics shown; Left: GSEA enrichment plot of the Carver mouse gene set that represent genes that are down-regulated in mouse prostates cancer following castration (Carver et al., 2011). See also Figures S3 and Tables S2, S3.
Figure 4
Figure 4. N-Myc signature in LNCaP cells is clinically relevant and exhibits a dramatic down-regulation of AR signaling
A Left: Heatmap of GSEA FDR q-values as shown in (Fig. 3) of AR induced genes and multiple PRC2 target gene sets that are significantly enriched in the N-Myc de-regulated genes identified in the indicated N-Myc expressing human prostate cancer cell types with the indicated PTEN status compared to their non-N-Myc expressing counterparts. Right: GSEA enrichment plot of the Nelson Response to Androgen geneset (Nelson et al., 2002) in the ranked N-Myc signature showing the most significantly enriched gene sets. B. Nanostring data of AR target gene expression fold induction by androgen (24 hours, 10 nM DHT) in the indicated cell line. C. The fold change in growth rate of 22Rv1 control (Cntl, left) or N-Myc (right) xenografts (average +/- standard error mean (SEM)) in castrate (dashed lines) or intact (solid lines) mice. Each tumor size at each time point was normalized to values obtained at 1 week before the day of castration (p-value < 0.0002, Student's T test). D. ChIP-PCR for N-Myc at known AR enhancers for indicated genes following 48 hours growth in charcoal stripped serum with or without 24 hours of 10 nM DHT (inset: Co-IP of N-Myc from LNCaP-N-Myc cells showing the interaction between N-Myc and AR and Aurora-A as a positive control). See also Figure S4 and Tables S3, S4, S5.
Figure 5
Figure 5. MPC organoids culture mimic in vivo mouse features
A RT-QPCR and Western blot analysis from MPC organoids showing N-Myc mRNA and protein expression with or without 2 weeks of tamoxifen induction. B Photomicrographs (scale bar = 50 um) of representative mouse prostate organoids from indicated genotype mouse following H/E staining, cytokeratin 5 (CK5), and vimentin (Vim) IHC staining. C. QRT-PCR data of mRNA levels of the indicated AR target genes from organoids 3 weeks with or without tamoxifen and following 1 day stimulation with 10 nM DHT. Shown are average and standard deviation fold change compared to vehicle treated organoid cultures (n = 3 independent organoid cultures). Below: T2-Cre+/+; Ptenf/f; LSL-MYCN+/+ derived prostate organoids with and without tamoxifen organoids culture were seeded for 48 hours and then treated with enzalutamide (1uM) for 72 hours and the surface area of each organoid was calculated. Box-plot representation of the organoids surface area distribution (n > 15 organoids per condition). Enzalutamide reduced the surfaced area of the control organoids but did not have a significant effect in N-Myc expressed organoids. (p-value = 0.0021, Student's T test). See also Figure S5 and Tables S2, S3.
Figure 6
Figure 6. N-MYC increases AKT signaling in cell line and organoids
A Western blot analysis of p-AKT in LNCaP-NMYC cells compare to LNCaP-cntl (upper panel). Western blot analysis of p-AKT and Phospho-S6 Ribosomal Protein (Ser235/236) in LNCaP-NMYC cells compare to LNCaP-cntl, 24 hours after treatment with BKM120 (1 μM) and RAD001 (100 nM) alone or in combination (middle panel). Dose-response following 72-hour incubation with the indicated dose of BEZ235 obtained for LNCaP-NMYC cells and LNCaP-cntl and in the presence or absence of MLN8237 (100 nM) (lower panel). B. Drug treatment in prostate organoids culture. Top: Experiment design and below: Western blot analysis of p-AKT after 48 hours of BKM120 (1 μM) and BEZ235 (100 nM) treatment. Bottom: Dose response of BKM120 for T2-Cre+/+; Ptenf/+; LSL-MYCN+/+ organoid culture compare to the non-induced organoids. See also Figure S6.
Figure 7
Figure 7. N-Myc interacts with EZH2 to drive transcriptional program
A Photomicrographs of representative mouse prostates from indicated genotype following H/E staining, EZH2, and H3K27 tri-methylation (H3K27me3) IHC staining (scale bar = 50 um). B. Co-immunoprecipitation of N-Myc, EZH2, SUZ12 and AR upon EZH2 or N-Myc pull down in LNCaP-N-Myc cells and in LNCaP-N-Myc cells following knock-down of EZH2 with siRNA targeting EZH2 mRNA (top center), transfection of the Myc-tagged SET domain-deletion EZH2 mutant (top right) or 6-day treatment of either the EZH2 inhibitors GSK126 or GSK343 (bottom). Values below indicate the percent of interaction compared to vehicle if below 70% C. Top: GSEA enrichment plot of the N-Myc down-regulated geneset in genes ranked in terms of comparison of LNCaP-N-Myc cells treated with siRNA targeting EZH2 versus control siRNA or GSK343 versus vehicle treatment; Bottom: heatmap of GSEA FDR q-values as shown in (Fig. 3) of AR induced genes and multiple PRC2 target gene sets that are significantly enriched in the N-Myc down-regulated genes that were significantly up-regulated after either siRNA-mediated EZH2 knock-down (48 hours) or treatment with GSK343 (7 days, 5 μM) in replicate. D. Top left: Venn diagram showing the overlap between H3K27me3 ChIP-seq reads enriched at promoters either in LNCaP-N-Myc or control (Cntl) cells; top right: H3K27me3 ChIP-seq reads in the indicated cells that were localized at the chromosome loci housing the AR-regulated gene PMEPA1; bottom: EZH2 ChIP-PCR at known EZH2 binding sites for the indicated EZH2 target gene or negative control gene (KIA0066). E. Left: Percent cell viability of either LNCaP control (Cntl) or LNCaP-N-Myc (N-Myc) cells following 6 days incubation of the indicated dose of the EZH2 inhibitor GSK126. F. The fold change in growth rate of individual 22Rv1 control (Cntl, left) or N-Myc (right) xenografts before, during (orange bar below) and after 31 or 35 days (respectively) treatment with 150 mg/kg of the EZH2 inhibitor GSK503 (dashed lines) or vehicle (solid lines). Each tumor size at each time point was normalized to values obtained at day 1 of treatment. See also Figure S7.
Figure 8
Figure 8. N-Myc/Aurora-A complex is targetable with allosteric Aurora-A inhibitors (e.g. MLN8237)
A PLA for the N-Myc/Aurora-A complex. Each red dot represents an interaction (scale bar = 5 um). Below: representative images of PLA assay in LNaP-N-Myc cells treated with either vehicle or 100 nM MLN8237 for 48 hours. B. Western blot analysis of N-Myc in LNCaP-NMyc cells following treatment with the indicated Aurora-A inhibitors at the indicated dose or siRNA targeting AURKA mRNA for 48 hours. C. Dose response data is shown for the same cells shown in the Western blot. D. Organoids culture viability assay after increasing doses of Aurora-A inhibitor MLN8237. Shown are average and standard deviation fold change compared to vehicle treated organoid cultures (n = 3 independent organoid cultures). E. RT-QPCR of PEG10 and vimentin (VIM) mRNA after a time course of MLN8237 (1 μM) treatment.

Comment in

References

    1. Althoff K, Beckers A, Bell E, Nortmeyer M, Thor T, Sprussel A, Lindner S, De Preter K, Florin A, Heukamp LC, et al. A Cre-conditional MYCN-driven neuroblastoma mouse model as an improved tool for preclinical studies. Oncogene. 2015;34:3357–3368. - PMC - PubMed
    1. Beltran H, Prandi D, Mosquera JM, Benelli M, Puca L, Cyrta J, Marotz C, Giannopoulou E, Chakravarthi BV, Varambally S, et al. Divergent clonal evolution of castration-resistant neuroendocrine prostate cancer. Nat Med. 2016;22:298–305. - PMC - PubMed
    1. Beltran H, Rickman DS, Park K, Chae SS, Sboner A, MacDonald TY, Wang Y, Sheikh KL, Terry S, Tagawa ST, et al. Molecular characterization of neuroendocrine prostate cancer and identification of new drug targets. Cancer Discov. 2011;1:487–495. - PMC - PubMed
    1. Brockmann M, Poon E, Berry T, Carstensen A, Deubzer HE, Rycak L, Jamin Y, Thway K, Robinson SP, Roels F, et al. Small molecule inhibitors of aurora-a induce proteasomal degradation of N-myc in childhood neuroblastoma. Cancer Cell. 2013;24:75–89. - PMC - PubMed
    1. Brognard J, Sierecki E, Gao T, Newton AC. PHLPP and a second isoform, PHLPP2, differentially attenuate the amplitude of Akt signaling by regulating distinct Akt isoforms. Mol Cell. 2007;25:917–931. - PubMed

Publication types

MeSH terms