. 2016 Oct 10;30(4):595-609.
doi: 10.1016/j.ccell.2016.09.004.

p62/SQSTM1 by Binding to Vitamin D Receptor Inhibits Hepatic Stellate Cell Activity, Fibrosis, and Liver Cancer

Affiliations

p62/SQSTM1 by Binding to Vitamin D Receptor Inhibits Hepatic Stellate Cell Activity, Fibrosis, and Liver Cancer

Angeles Duran et al. Cancer Cell. .

Abstract

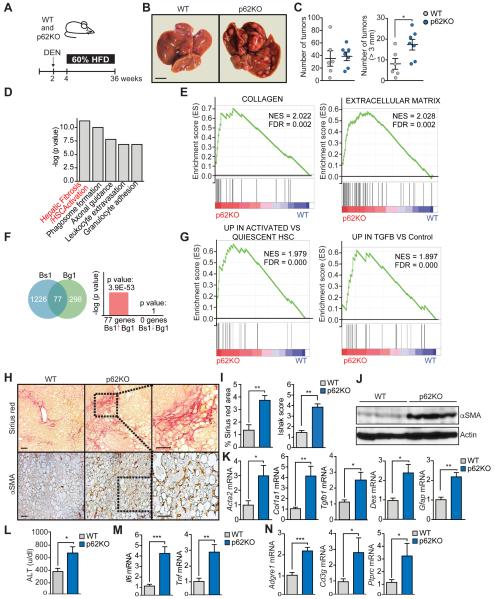
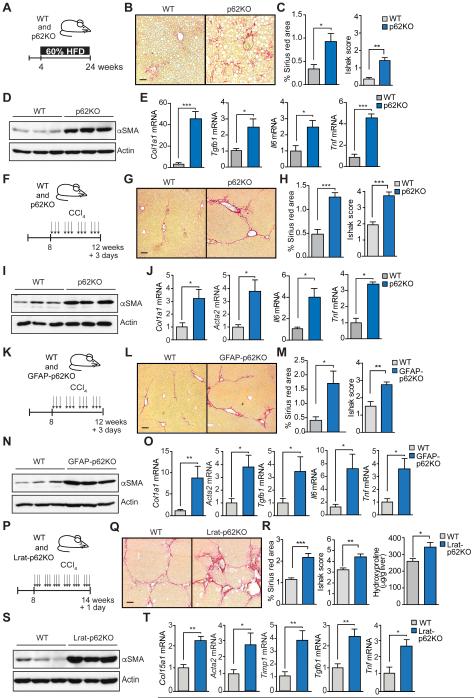
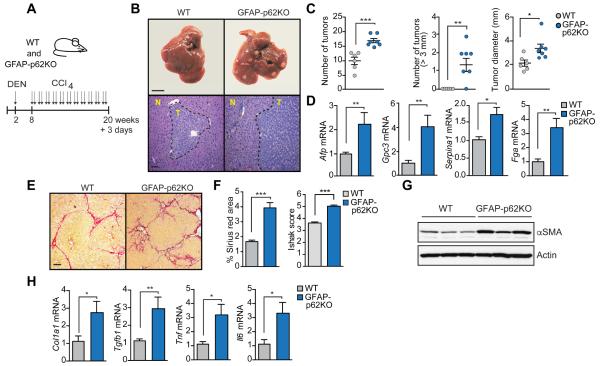
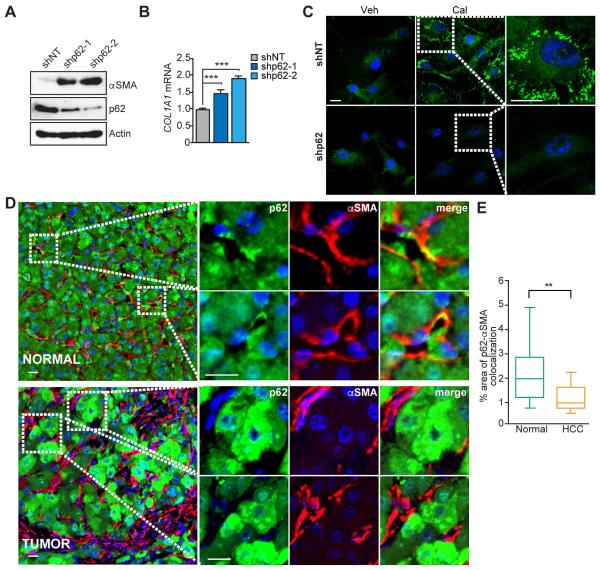
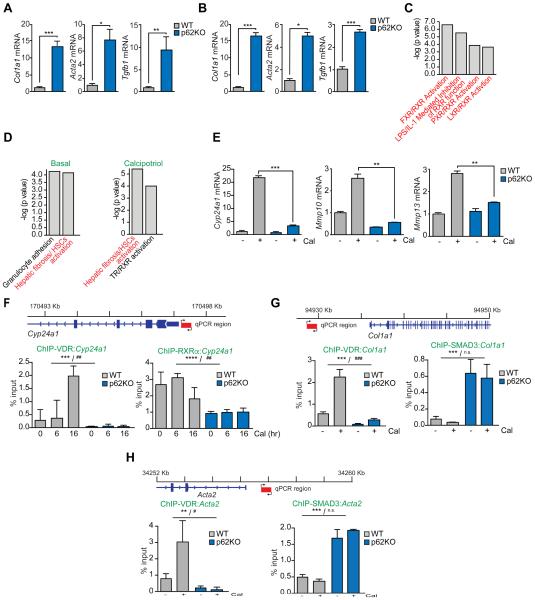
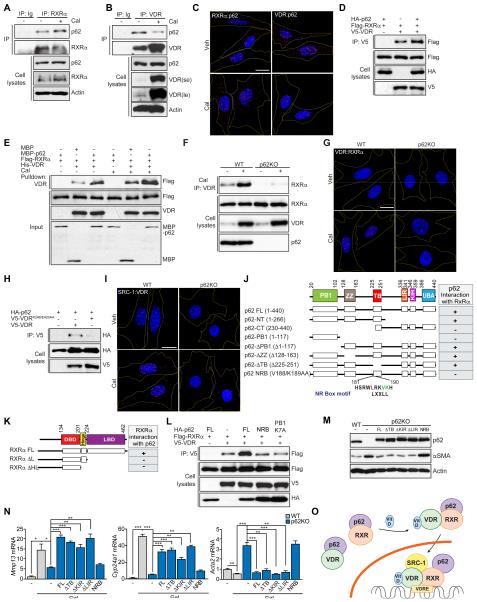
Hepatic stellate cells (HSCs) play critical roles in liver fibrosis and hepatocellular carcinoma (HCC). Vitamin D receptor (VDR) activation in HSCs inhibits liver inflammation and fibrosis. We found that p62/SQSTM1, a protein upregulated in liver parenchymal cells but downregulated in HCC-associated HSCs, negatively controls HSC activation. Total body or HSC-specific p62 ablation potentiates HSCs and enhances inflammation, fibrosis, and HCC progression. p62 directly interacts with VDR and RXR promoting their heterodimerization, which is critical for VDR:RXR target gene recruitment. Loss of p62 in HSCs impairs the repression of fibrosis and inflammation by VDR agonists. This demonstrates that p62 is a negative regulator of liver inflammation and fibrosis through its ability to promote VDR signaling in HSCs, whose activation supports HCC.

Keywords: fibrosis; hepatic stellate cells; hepatocellular carcinoma; inflammation; liver cancer; non-alcoholic steatohepatitis; nuclear receptors; p62; sequestosome-1; vitamin D receptor.


Figures

Figure 1
Figure 1. p62 total ablation promotes DEN-induced hepatocarcinogenesis and fibrosis
(A) Schematic diagram of DEN-HFD induced HCC model. Two week-old mice were i.p. injected with DEN (25 mg/kg) and two weeks later were fed 60% fat diet for 32 weeks. (B) Representative images of livers from WT (n=6) and p62KO (n=7) treated as in (A). Scale bar, 1 cm. (C) Total number of tumors and number of tumors bigger than 3 mm in WT and p62KO livers. (D) Top canonical pathways from Ingenuity analysis (IPA) of upregulated genes in p62KO as compared to WT livers (n=3). (E) GSEA plot of enrichment in “Collagen” and “Extracellular Matrix” signatures in p62KO liver tumors (n=3) using C5 MSigDB database. (F) NextBio analysis of gene overlap between genes up-regulated in p62KO versus WT (n=3) livers (Bs1, Bioset1) with Extracellular Matrix Geneset (Bg1, Biogroup1). (G) GSEA plot of enrichment of “UP IN ACTIVATED VS QUIESCENT HSC” and “UP IN TGFB VS Control” genesets associated with gene expression in p62KO liver tumors (n=3) using C2 MSigDB database. (H) Sirius red and αSMA staining of WT and p62KO livers. Scale bars, 100 μm. (I) Sirius red positive area and Ishak score of WT and p62KO livers. (J) Immunoblot analysis of αSMA and Actin in WT and p62KO livers. (K) qPCR analysis of mRNA of fibrosis markers in WT and p62KO livers. (L) ALT levels in serum of WT and p62KO mice. (M) qPCR analysis of mRNA of inflammation markers. (N) qPCR analysis of mRNA of immune cell infiltration. Results are presented as mean ± SEM. *p<0.05, **p<0.01, ***p<0.001. See also Figure S1.
Figure 2
Figure 2. Selective p62 deficiency in hepatic stellate cells increases fibrosis upon liver injury
(A) Schematic diagram of HFD protocol. Four week-old WT (n=5) and p62KO (n=5) mice were fed 60% fat diet during 20 weeks. (B) Sirius red staining of livers of WT and p62KO mice. (C) Sirius red positive area and Ishak score of WT and p62KO livers. (D) Immunoblot analysis of αSMA and Actin in WT and p62KO livers. (E) qPCR analysis of indicated mRNA. (F) Schematic diagram of CCl4-induced fibrosis protocol. Eight week-old mice were i.p. injected with 0.5 ml/kg body weight CCl4 (1:50 v/v in corn oil) three times per week during 4 weeks. Mice were sacrificed 3 days after the last injection (n=6, per genotype). (G) Sirius red staining of livers of WT and p62KO mice (n=6). (H) Sirius red positive area and Ishak score. (I) Immunoblot analysis of αSMA and Actin in WT and p62KO livers. (J) qPCR analysis of indicated mRNA in livers of mice described in (F). (K) Scheme of CCl4-induced fibrosis model as in (F) in WT (n=5) and GFAP-p62KO (n=9) mice. (L) Sirius red staining of livers of WT and GFAP-p62KO mice. (M) Sirius red positive area and Ishak score of WT and GFAP-p62KO livers. (N) Immunoblot analysis of αSMA and Actin in WT and GFAP-p62KO livers. (O) qPCR analysis of indicated mRNA in livers from the mice described in (K). (P) Scheme of CCl4-induced fibrosis protocol. Eight week-old WT (n=6) and Lrat-p62KO (n=5) mice were i.p. injected with 0.5 ml/kg body weight CCl4 (1:10 v/v in corn oil) three times per week during 6 weeks. Mice were sacrificed 1 day after the last injection. (Q) Sirius red staining of livers of WT and Lrat-p62KO mice. (R) Sirius red positive area, Ishak score, and hydroxyproline content of livers of WT and Lrat-p62KO mice. (S) Immunoblot analysis of αSMA and Actin in WT and Lrat-p62KO livers. (T) qPCR analysis of indicated mRNA of livers from the mice described in (P). Scale bars, 100 μm. Results are presented as mean ± SEM. *p<0.05, **p<0.01, ***p<0.001. See also Figure S2.
Figure 3
Figure 3. Selective p62 deficiency in hepatic stellate cells promotes hepatocarcinogenesis
(A) Schematic diagram of DEN-CCl4-induced HCC model. Two week-old mice were i.p. injected with DEN (25 mg/kg) and 6 weeks later injected with CCl4 (2 ml/kg) twice per week for 12 weeks. (B) Gross morphology (top) and H&E staining (bottom) of livers of WT (n=6) and GFAP-p62KO (n=7) mice described in (A). N, normal liver tissue. T, liver tumor area. Scale bar, 1 cm (top) and 100 μm (bottom). (C) Total number of tumors, number of tumors bigger than 3 mm and maximal tumor diameters. (D) qPCR analysis of mRNA of HCC markers in WT and GFAP-p62KO livers described in (A). (E) Sirius red staining of livers of WT and GFAP-p62KO mice. Scale bar, 100 μm. (F) Sirius red positive area and Ishak score of WT and GFAP-p62KO livers. (G) Immunoblot analysis of αSMA and Actin in WT and GFAP-p62KO livers. (H) qPCR analysis of indicated mRNA. Results are presented as mean ± SEM. *p<0.05, **p<0.01, ***p<0.001.
Figure 4
Figure 4. p62 is lost in HSC in human HCC
(A) Levels of p62, αSMA and Actin in immortalized human HSC expressing non-targeting shRNA (shNT) or one of two different shRNAs for p62 (shp62-1 and shp62-2) via lentiviral infection were analyzed by immunoblot. (B) qPCR analysis of mRNA of COL1A1 in human HSC either shNT or shp62. Results are presented as mean ± SEM. (C) BODIPY 493/503 staining for neutral lipids in shNT or shp62 human HSC treated with vehicle (DMSO) or 100 nM Cal for 48 hr. Scale bars, 20 μm. (D) Representative images of double immunofluorescence of p62 (green) and αSMA (red) in normal liver (NORMAL) and HCC samples (TUMOR). Scale bars, 25 μm (NORMAL) and 10 μm (TUMOR). (E) Box-and-whisker plots showing median (horizontal line), interquartile range (box) and 10th-90th percentiles (whiskers) of the % colocalization area between p62 and αSMA (n=14 per group). **p<0.01, ***p<0.001. See also Figure S3.
Figure 5
Figure 5. p62 is required for hepatic stellate activation and VDR function
(A and B) qPCR analysis of mRNA of HSC activation markers in primary quiescent (A) or immortalized activated (B) WT and p62KO HSC. (C) Nuclear-receptor-related pathways from Ingenuity analysis (IPA) of downregulated genes in liver tumors of total p62KO and WT mice described in Figure 1A. (D) Top canonical pathways from Ingenuity analysis (IPA) of differentially expressed genes between p62KO and WT HSC in basal conditions and upon calcipotriol (Cal) treatment. (E) qPCR analysis of mRNA of Cyp24a1, Mmp10, and Mmp13 in WT and p62KO HSC. (F) Primer design and ChIP-qPCR analysis of Cyp24a1 promoter occupancy of VDR and RXRα. (G) Primer design and ChIP-qPCR analysis of Col1a1 promoter occupancy of VDR and SMAD3. (H) Primer design and ChIP-qPCR analysis of Acta2 promoter occupancy of VDR and SMAD3. Results are presented as mean ± SEM. p values were calculated using a two-way ANOVA; **p<0.01, ***p<0.001 for all comparisons of p62KO versus WT; #p<0.05, ##p<0.01, ###p<0.001, n.s. non-significant, for all comparisons of Cal versus vehicle. See also Figure S4.
Figure 6
Figure 6. p62 regulates the formation of the VDR:RXRα dimer in response to calcipotriol
(A and B) Endogenous interaction of RXRα (A) or VDR (B) with p62 in response to calcipotriol (Cal). Cell lysates and immunoprecipitates were analyzed for the levels of specified proteins; se: short exposure; le: long exposure. (C) Proximity ligation assay (PLA) of RXRα–p62 and VDR– p62 interactions (red) in WT HSC treated with vehicle (DMSO) or 100 nM Cal for 24 hr. (D) Cell lysates and V5-tagged immunoprecipitates of HEK293T cells transfected with the indicated cDNAs in expression vectors were analyzed by immunoblotting. (E) Recombinant His-VDR was incubated with FLAG-RXRα in the presence of recombinant MBP-p62 in response to Cal and interactions were analyzed by immunoblot in His-beads pulldown. (F) Cell lysates and endogenous VDR-immunoprecipitates of WT and p62KO HSC treated with or without Cal were analyzed by immunoblotting. (G) PLA of VDR:RXRα heterodimer (red) in WT and p62KO HSC treated with vehicle (DMSO) or 100 nM Cal for 24 hr. (H) Cell lysates and V5-tagged immunoprecipitates of HEK293T cells transfected with the indicated cDNAs in expression vectors were analyzed by immunoblotting. (I) PLA of SRC-1:VDR (red) in WT and p62KO HSC treated with vehicle (DMSO) or 100 nM Cal for 24 hr. (J) Schematic representation of domain structure of p62 and a summary of the interactions of RXRα with the different domains of p62. (K) Schematic representation of domain structure of RXRα and a summary of the interactions of p62 with the different domains of RXRα. (L) Cell lysates and V5-tagged immunoprecipitates of HEK293T cells transfected with the indicated cDNAs in expression vectors were analyzed by immunoblotting. (M) Immunoblot analysis of αSMA, p62 and Actin in WT, p62KO and p62KO HSC reconstituted with the indicated constructs and treated with vehicle (DMSO) or Cal for 24 hr. (N) qPCR analysis of mRNA of Mmp13, Cyp24a1, and Acta2 in the reconstitution experiment as in (M). (O) Model for the role of p62 in the regulation of VDR:RXR heterodimerization. Scale bars, 20 μm. Results are presented as mean ± SEM. *p<0.05, **p<0.01, ***p<0.001. See also Figure S5.
Figure 7
Figure 7. p62 deficiency in HSC impairs Vitamin D-mediated repression of fibrosis
(A) Schematic diagram of CCl4-induced fibrosis model and reversion with calcipotriol (Cal). Eight week-old mice were i.p. injected with CCl4 (0.5 ml/kg) three times per week during 4 weeks. Cal (20 μg/kg) was administered via oral gavage five times during the last week of CCl4 treatment. Mice are sacrificed 3 days after the last injection. (B) Sirius red staining of livers of WT (n=6) and GFAP-p62KO (n=7) mice treated as in (A). Scale bars, 100 μm. (C) Sirius red positive area and Ishak score of WT and GFAP-p62KO livers. (D) Immunoblot analysis of αSMA and Actin in WT and GFAP-p62KO livers. (E and F) qPCR analysis of mRNA of HSC activation markers (E) and VDR targets (F) in livers described in (A). Results are presented as mean ± SEM. *p<0.05, **p<0.01, ***p<0.001.

Comment in

References

    1. Anstee QM, Day CP. The genetics of NAFLD. Nature reviews Gastroenterology & hepatology. 2013;10:645–655. - PubMed
    1. Bataller R, Brenner DA. Liver fibrosis. J Clin Invest. 2005;115:209–218. - PMC - PubMed
    1. Calle EE, Kaaks R. Overweight, obesity and cancer: epidemiological evidence and proposed mechanisms. Nature reviews Cancer. 2004;4:579–591. - PubMed
    1. Denk H, Stumptner C, Fuchsbichler A, Muller T, Farr G, Muller W, Terracciano L, Zatloukal K. Are the Mallory bodies and intracellular hyaline bodies in neoplastic and non-neoplastic hepatocytes related? J Pathol. 2006;208:653–661. - PubMed
    1. Ding N, Yu RT, Subramaniam N, Sherman MH, Wilson C, Rao R, Leblanc M, Coulter S, He M, Scott C, et al. A vitamin D receptor/SMAD genomic circuit gates hepatic fibrotic response. Cell. 2013;153:601–613. - PMC - PubMed

Publication types