. 2016 Oct 11;17(1):38.
doi: 10.1186/s12865-016-0177-5.

A new high-throughput sequencing method for determining diversity and similarity of T cell receptor (TCR) α and β repertoires and identifying potential new invariant TCR α chains

Affiliations

A new high-throughput sequencing method for determining diversity and similarity of T cell receptor (TCR) α and β repertoires and identifying potential new invariant TCR α chains

Kazutaka Kitaura et al. BMC Immunol. .

Abstract

Background: High-throughput sequencing of T cell receptor (TCR) genes is a powerful tool for analyses of antigen specificity, clonality and diversity of T lymphocytes. Here, we developed a new TCR repertoire analysis method using 454 DNA sequencing technology in combination with an adaptor-ligation mediated polymerase chain reaction (PCR). This method allows the amplification of all TCR genes without PCR bias. To compare gene usage, diversity and similarity of expressed TCR repertoires among individuals, we conducted next-generation sequencing (NGS) of TRA and TRB genes in peripheral blood mononuclear cells from 20 healthy human individuals.

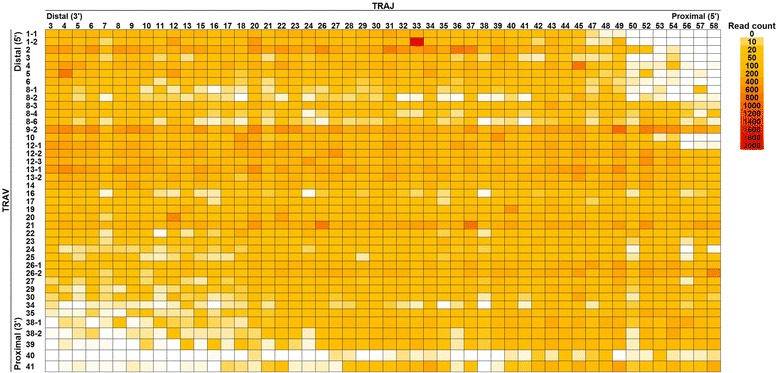
Results: From a total of 267,037 sequence reads from 20 individuals, 149,216 unique sequence reads were identified. Preferential usage of several V and J genes were observed while some recombinations of TRAV with TRAJ appeared to be restricted. The extent of TCR diversity was not significantly different between TRA and TRB, while TRA repertoires were more similar between individuals than TRB repertoires were. The interindividual similarity of TRA depended largely on the frequent presence of shared TCRs among two or more individuals. A publicly available TRA had a near-germline TCR with a shorter CDR3. Notably, shared TRA sequences, especially those shared among a large number of individuals', often contained TCRα related with invariant TCRα derived from invariant natural killer T cells and mucosal-associated invariant T cells.

Conclusion: These results suggest that retrieval of shared TCRs by NGS would be useful for the identification of potential new invariant TCRα chains. This NGS method will enable the comprehensive quantitative analysis of TCR repertoires at a clonal level.

Keywords: Immune profiling; Invariant TCRα; Next generation sequencing; Repertoire; T cell receptor.


Figures

Fig. 1
Fig. 1
Usage of TRAV and TRAJ in 20 healthy individuals. The numbers of TCR sequences bearing respective TRAV and TRAJ were counted. The percentage frequencies of 54 TRAV and 61 TRAJ were calculated and are shown as a scatter plot. Each dot indicates the percentage frequency of TRAV or TRAJ in each individual. Bars in red indicate the mean values of 20 individuals. (P): pseudogene, (ORF): open reading frame
Fig. 2
Fig. 2
Usage of TRBV and TRBJ in 20 healthy individuals. The percentage frequencies of 65 TRBV and 14 TRBJ are shown as a scatter plot. Each dot indicates the percentage frequency of TRBV or TRBJ in each individual. Bars in red indicate the mean values. (P): pseudogene, (ORF): open reading frame
Fig. 3
Fig. 3
Heatmap representation of gene recombination of TRAV with TRAJ in pooled read data from 20 healthy individuals. The numbers of TCR sequence reads bearing respective gene recombination of TRAV and TRAJ were counted. The occurrence tendency of recombination is visualized by heat map presentation of the number of each recombination. Color in each pixel indicates the number of each recombination. For TRAV, 8 pseudogenes (TRAV8-5, TRAV11, TRAV15, TRAV28, TRAV31, TRAV32, TRAV33, and TRAV37), 1 ORF (TRAV8-7), and poorly expressed genes (TRAV7, TRAV9-1, TRAV18 and TRAV36) were excluded. For TRAJ, 3 pseudogenes (TRAJ51, TRAJ55, and TRAJ60), 6 ORFs (TRAJ1, TRAJ2, TRAJ19, TRAJ25, TRAJ59, and TRAJ61), and poorly expressed genes (TRAJ14 and TRAJ46) were excluded. Two ORFs (TRAJ35 and TRAJ48) found to be expressed were included. A heat map representation of the 2050 recombination events (41 TRAV × 50 TRAJ) is shown
Fig. 4
Fig. 4
3D image of TRA repertoires. The numbers of TCR sequence reads bearing a given gene recombination of TRAV with TRAJ were counted. The mean percentage frequencies of 3294 (54 TRAV × 61 TRAJ) in 20 healthy individuals are shown as a 3D bar graph. X-axis and Y-axis indicate TRAV and TRAJ, respectively. Recombination of TRAV1-2 with TRAJ33 (AV1-2/AJ33) was the most expressed (0.99 ± 0.85). (P): pseudogene, (ORF): open reading frame
Fig. 5
Fig. 5
3D image of TRB repertoires. The numbers of TCR sequence reads bearing a given gene recombination of TRBV with TRBJ were counted. The mean percentage frequencies of 910 (65 TRBV × 14 TRBJ) in 20 healthy individuals are shown as a 3D bar graph. X-axis and Y-axis indicate TRBV and TRBJ, respectively. (P): pseudogene, (ORF): open reading frame
Fig. 6
Fig. 6
Digital CDR3 length distribution of TRA and TRB. Lengths of CDR3 were determined in 172,109 TRA and 94,928 TRB sequence reads obtained from the pooled data of 20 individuals. Length of nucleotide sequences from conserved cysteine at position 104 (Cys104) of IMGT nomenclature to conserved phenylalanine at position 118 (Phe118) were automatically calculated using RG software. Distribution of CDR3 length in TRA (upper) and TRB (lower) is shown as a histogram
Fig. 7
Fig. 7
Diversity of TRA and TRB repertoires in healthy individuals. Copy number (read number) of unique sequence reads (USR) was calculated. Mean copy number per unique sequence read in each individual are shown as open circle (left). Inverse Simpson index (middle) and Shannon-Weaver index (right) were calculated with R program according to formulas described in Materials and Methods. Each open circle indicates the index of an individual. There were no significant differences in mean copy number, inverse Simpson index and Shannon-Weaver index between TRA and TRB
Fig. 8
Fig. 8
Similarity of TRA and TRB repertoires in healthy individuals. The occurrence frequency of TCR sequence reads shared between all pairs of 20 individuals was calculated (Additional file 1: Tables S5 and S6). Mean percentage frequency of shared reads were compared between TRA and TRB (left, n = 380). Similarity index, Morisita-Horn index, was calculated with the R program according to a formula described in Materials and Methods. There were significant differences in the frequency of shared reads and similarity index between TRA and TRB (P < 0.001 and P < 0.001, respectively, Mann–Whitney U-test)
Fig. 9
Fig. 9
Shared TCR had shorter CDR3 lengths than private TCR. CDR3 lengths were calculated with 7237 USRs of Shared TCR (Grey) and 83,997 USRs of Unshared TCR (Black). Percentage frequencies of USRs in each CDR3 length are plotted as a bar graph. Median values of CDR3 length in Shared and unshared TCR are 39 and 42, respectively

References

    1. van den Beemd R, Boor PP, van Lochem EG, Hop WC, Langerak AW, Wolvers-Tettero IL, Hooijkaas H, van Dongen JJ. Flow cytometric analysis of the Vbeta repertoire in healthy controls. Cytometry. 2000;40(4):336–45. doi: 10.1002/1097-0320(20000801)40:4<336::AID-CYTO9>3.0.CO;2-0. - DOI - PubMed
    1. MacIsaac C, Curtis N, Cade J, Visvanathan K. Rapid analysis of the Vbeta repertoire of CD4 and CD8 T lymphocytes in whole blood. J Immunol Methods. 2003;283(1–2):9–15. doi: 10.1016/S0022-1759(03)00260-6. - DOI - PubMed
    1. Tembhare P, Yuan CM, Xi L, Morris JC, Liewehr D, Venzon D, Janik JE, Raffeld M, Stetler-Stevenson M. Flow cytometric immunophenotypic assessment of T-cell clonality by Vbeta repertoire analysis: detection of T-cell clonality at diagnosis and monitoring of minimal residual disease following therapy. Am J Clin Pathol. 2011;135(6):890–900. doi: 10.1309/AJCPV2D1DDSGJDBW. - DOI - PMC - PubMed
    1. Langerak AW, van Den Beemd R, Wolvers-Tettero IL, Boor PP, van Lochem EG, Hooijkaas H, van Dongen JJ. Molecular and flow cytometric analysis of the Vbeta repertoire for clonality assessment in mature TCRalphabeta T-cell proliferations. Blood. 2001;98(1):165–73. doi: 10.1182/blood.V98.1.165. - DOI - PubMed
    1. Rebai N, Pantaleo G, Demarest JF, Ciurli C, Soudeyns H, Adelsberger JW, Vaccarezza M, Walker RE, Sekaly RP, Fauci AS. Analysis of the T-cell receptor beta-chain variable-region (V beta) repertoire in monozygotic twins discordant for human immunodeficiency virus: evidence for perturbations of specific V beta segments in CD4+ T cells of the virus-positive twins. Proc Natl Acad Sci U S A. 1994;91(4):1529–33. doi: 10.1073/pnas.91.4.1529. - DOI - PMC - PubMed

Substances