Multicenter Study
. 2016 Oct;9(10):e005032.
doi: 10.1161/CIRCIMAGING.116.005032.

Association of Impaired Glucose Regulation and Insulin Resistance With Cardiac Structure and Function: Results From ECHO-SOL (Echocardiographic Study of Latinos)

Affiliations
Multicenter Study

Association of Impaired Glucose Regulation and Insulin Resistance With Cardiac Structure and Function: Results From ECHO-SOL (Echocardiographic Study of Latinos)

Ryan T Demmer et al. Circ Cardiovasc Imaging. 2016 Oct.

Abstract

Background: We examined the relationship between glucose homeostasis and comprehensive measures of cardiac structure and function among a representative sample of US Hispanics.

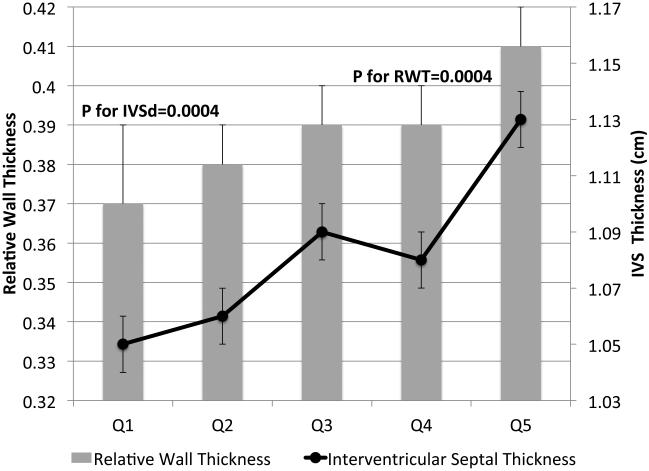
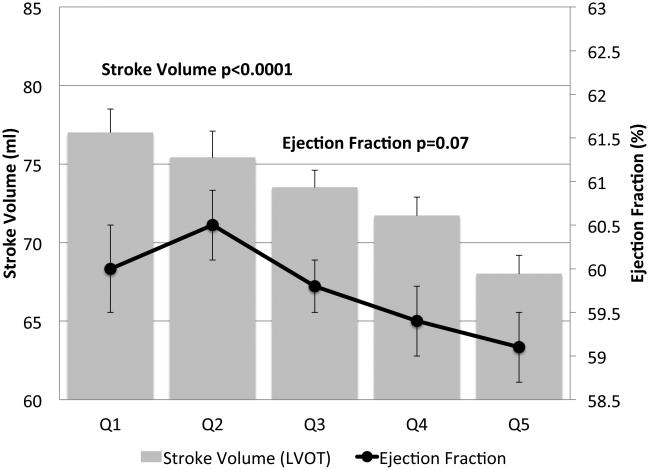
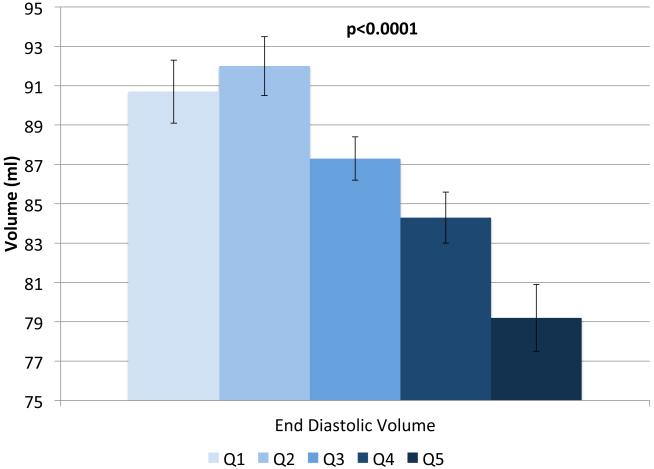
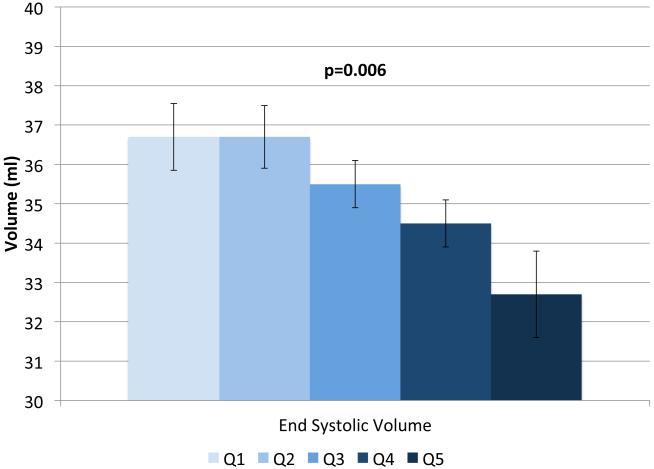
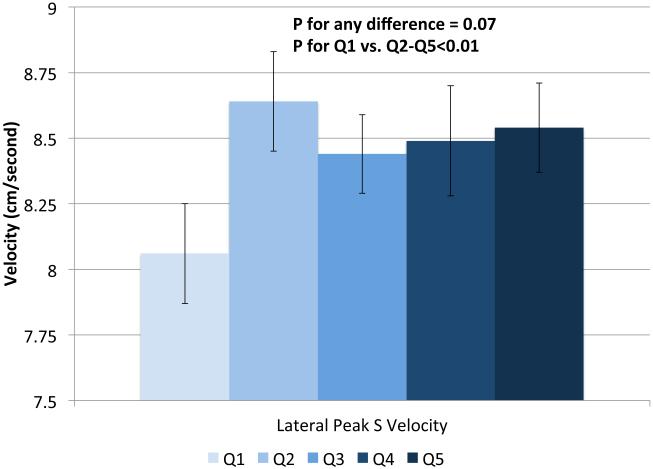
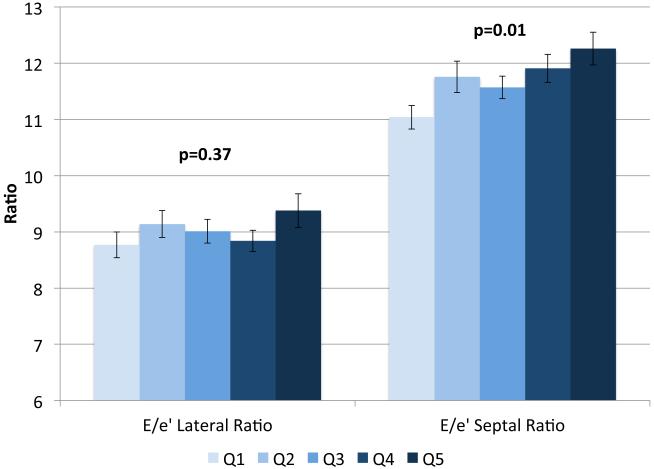
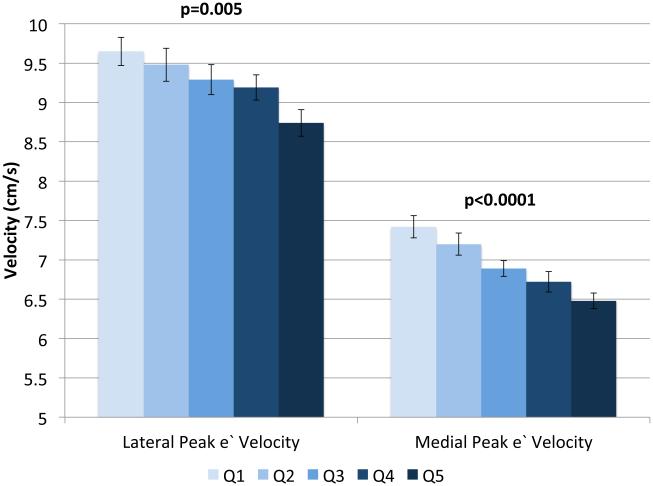
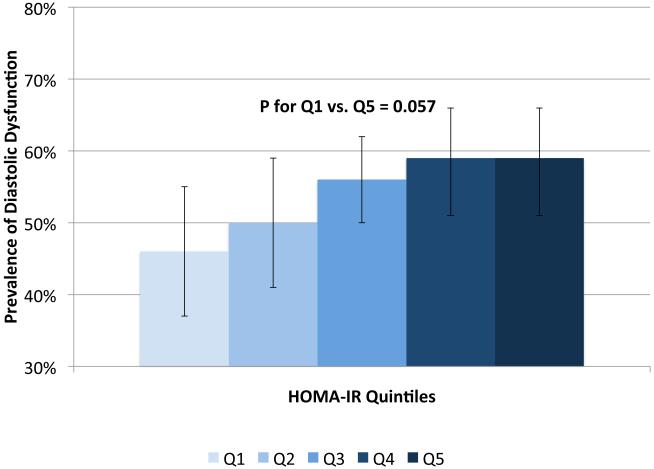
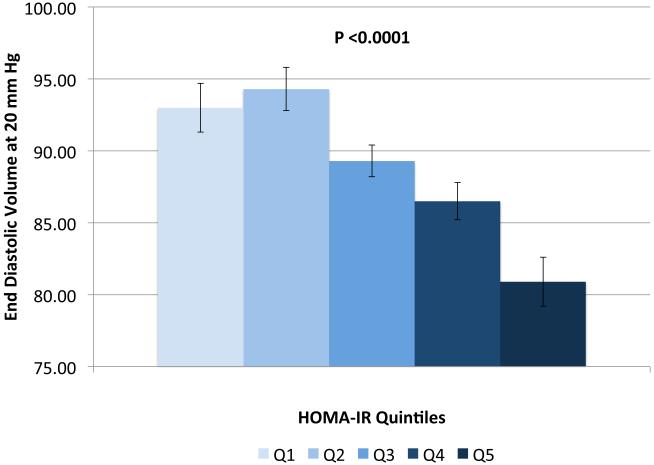
Methods and results: ECHO-SOL (Echocardiographic Study of Latinos), an echocardiographic ancillary study of the HCHS/SOL (Hispanic Community Health Study/Study of Latinos), enrolled 1818 Hispanic/Latino men (43%) and women (57%) aged ≥45 years (mean=56). Glucose intolerance was defined as follows: (1) prediabetes: hemoglobin (HbA1c) ≥5.7 and <6.5% and (2) diabetes mellitus: fasting plasma glucose ≥126 mg/dL, 2-hour postload glucose ≥200 mg/dL, HbA1c ≥6.5%, or hypoglycemic agent use. Uncontrolled diabetes mellitus was defined as HbA1c ≥7.0%. Insulin resistance was defined using the homeostatic model assessment for insulin resistance. Echocardiography examinations assessed left ventricular structure and systolic/diastolic function. Multivariable linear and logistic regression models were used. Prediabetes prevalence was 42%, and diabetes mellitus prevalence was 28% (47% uncontrolled). Glucose intolerance was associated with increased left ventricular posterior wall and interventricular septal and relative wall thicknesses (all P<0.05), reduced ejection fraction (P<0.01), reduced stroke and end-diastolic volumes (both P<0.001), decreased peak E' velocity (lateral and septal P<0.001), and increased E/E' ratio (lateral and septal P<0.01). The odds ratios (95% confidence intervals) for diastolic dysfunction among individuals with prediabetes and diabetes mellitus (versus diabetes mellitus free) were 1.36 (0.96-1.9) and 1.90 (1.3-2.8), respectively(P=0.006). Results were consistent for uncontrolled diabetes mellitus versus diabetes mellitus. Homeostatic model assessment for insulin resistance was associated with increased E/E' (P<0.001), and greater relative wall thickness and septal thickness (both P<0.05); lower stroke volume (P<0.0001); and lower peak lateral and septal E' velocities (both P<0.01).

Conclusions: Glucose intolerance and insulin resistance are associated with unfavorable cardiac structure and function, particularly worsened measures of diastolic function, even before the development of diabetes mellitus.

Keywords: diabetes mellitus; diabetic cardiomyopathy; echocardiography; insulin resistance; prediabetic state.


Figures

FIGURE 1
FIGURE 1
Relationship between quintiles of Homeostatic Model Assessment for Insulin Resistance (HOMA-IR) and measures of cardiac structure. Adjusted for age, sex, site, smoking status, alcohol use, physical activity, BMI, hypertension and chronic kidney disease. The scaling is based on clinically meaningful ranges. Zero was not included in the scale, as a value of zero is not biologically plausible.
FIGURE 2
FIGURE 2
Relationship between quintiles of Homeostatic Model Assessment for Insulin Resistance (HOMA-IR) and measures of systolic function including: ejection fraction and stroke volume (a), end diastolic volume (b), end systolic volume (c) and lateral peak S velocity (d). Adjusted for age, sex, site, smoking status, alcohol use, physical activity, BMI, hypertension and chronic kidney disease. The scaling is based on clinically meaningful ranges. Zero was not included in the scale, as a value of zero is not biologically plausible.
FIGURE 2
FIGURE 2
Relationship between quintiles of Homeostatic Model Assessment for Insulin Resistance (HOMA-IR) and measures of systolic function including: ejection fraction and stroke volume (a), end diastolic volume (b), end systolic volume (c) and lateral peak S velocity (d). Adjusted for age, sex, site, smoking status, alcohol use, physical activity, BMI, hypertension and chronic kidney disease. The scaling is based on clinically meaningful ranges. Zero was not included in the scale, as a value of zero is not biologically plausible.
FIGURE 3
FIGURE 3
Relationship between quintiles of Homeostatic Model Assessment for Insulin Resistance (HOMA-IR) and measures of diastolic function including: E/e' lateral and E/e' septal ratios (a), lateral peak E' and medial peak E' velocities (b), prevalent diastolic dysfunction (c), and (d) predicted end diastolic volume at an ED pressure of 20 mmHg. Adjusted for age, sex, site, smoking status, alcohol use, physical activity, BMI, hypertension and chronic kidney disease. The scaling is based on clinically meaningful ranges. Zero was not included in the scale, as a value of zero is not biologically plausible.
FIGURE 3
FIGURE 3
Relationship between quintiles of Homeostatic Model Assessment for Insulin Resistance (HOMA-IR) and measures of diastolic function including: E/e' lateral and E/e' septal ratios (a), lateral peak E' and medial peak E' velocities (b), prevalent diastolic dysfunction (c), and (d) predicted end diastolic volume at an ED pressure of 20 mmHg. Adjusted for age, sex, site, smoking status, alcohol use, physical activity, BMI, hypertension and chronic kidney disease. The scaling is based on clinically meaningful ranges. Zero was not included in the scale, as a value of zero is not biologically plausible.

Comment in

References

    1. Mozaffarian D, Benjamin EJ, Go AS, Arnett DK, Blaha MJ, Cushman M, de Ferranti S, Despres JP, Fullerton HJ, Howard VJ, Huffman MD, Judd SE, Kissela BM, Lackland DT, Lichtman JH, Lisabeth LD, Liu S, Mackey RH, Matchar DB, McGuire DK, Mohler ER, 3rd, Moy CS, Muntner P, Mussolino ME, Nasir K, Neumar RW, Nichol G, Palaniappan L, Pandey DK, Reeves MJ, Rodriguez CJ, Sorlie PD, Stein J, Towfighi A, Turan TN, Virani SS, Willey JZ, Woo D, Yeh RW, Turner MB, American Heart Association Statistics C and Stroke Statistics S Heart disease and stroke statistics--2015 update: a report from the American Heart Association. Circulation. 2015;131:e29–322. - PubMed
    1. Gerber Y, Weston SA, Redfield MM, Chamberlain AM, Manemann SM, Jiang R, Killian JM, Roger VL. A contemporary appraisal of the heart failure epidemic in Olmsted County, Minnesota, 2000 to 2010. JAMA Intern Med. 2015;175:996–1004. - PMC - PubMed
    1. Lloyd-Jones D, Adams R, Carnethon M, De Simone G, Ferguson TB, Flegal K, Ford E, Furie K, Go A, Greenlund K, Haase N, Hailpern S, Ho M, Howard V, Kissela B, Kittner S, Lackland D, Lisabeth L, Marelli A, McDermott M, Meigs J, Mozaffarian D, Nichol G, O'Donnell C, Roger V, Rosamond W, Sacco R, Sorlie P, Stafford R, Steinberger J, Thom T, Wasserthiel-Smoller S, Wong N, Wylie-Rosett J, Hong Y. Heart disease and stroke statistics--2009 update: a report from the American Heart Association Statistics Committee and Stroke Statistics Subcommittee. Circulation. 2009;119:480–6. - PubMed
    1. Devereux RB, Roman MJ, Paranicas M, O'Grady MJ, Lee ET, Welty TK, Fabsitz RR, Robbins D, Rhoades ER, Howard BV. Impact of diabetes on cardiac structure and function: the strong heart study. Circulation. 2000;101:2271–6. - PubMed
    1. From AM, Scott CG, Chen HH. The development of heart failure in patients with diabetes mellitus and pre-clinical diastolic dysfunction a population-based study. J Am Coll Cardiol. 2010;55:300–5. - PMC - PubMed

Publication types

MeSH terms