

Human isotype-dependent inhibitory antibody responses against Mycobacterium tuberculosis
- PMID: 27729388
- PMCID: PMC5090662
- DOI: 10.15252/emmm.201606330
Human isotype-dependent inhibitory antibody responses against Mycobacterium tuberculosis
Abstract
Accumulating evidence from experimental animal models suggests that antibodies play a protective role against tuberculosis (TB). However, little is known about the antibodies generated upon Mycobacterium tuberculosis (MTB) exposure in humans. Here, we performed a molecular and functional characterization of the human B-cell response to MTB by generating recombinant monoclonal antibodies from single isolated B cells of untreated adult patients with acute pulmonary TB and from MTB-exposed healthcare workers. The data suggest that the acute plasmablast response to MTB originates from reactivated memory B cells and indicates a mucosal origin. Through functional analyses, we identified MTB inhibitory antibodies against mycobacterial antigens including virulence factors that play important roles in host cell infection. The inhibitory activity of anti-MTB antibodies was directly linked to their isotype. Monoclonal as well as purified serum IgA antibodies showed MTB blocking activity independently of Fc alpha receptor expression, whereas IgG antibodies promoted the host cell infection. Together, the data provide molecular insights into the human antibody response to MTB and may thereby facilitate the design of protective vaccination strategies.
Keywords: Mycobacterium tuberculosis; B cells; antibodies; infection; isotype.
© 2016 The Authors. Published under the terms of the CC BY 4.0 license.
Figures
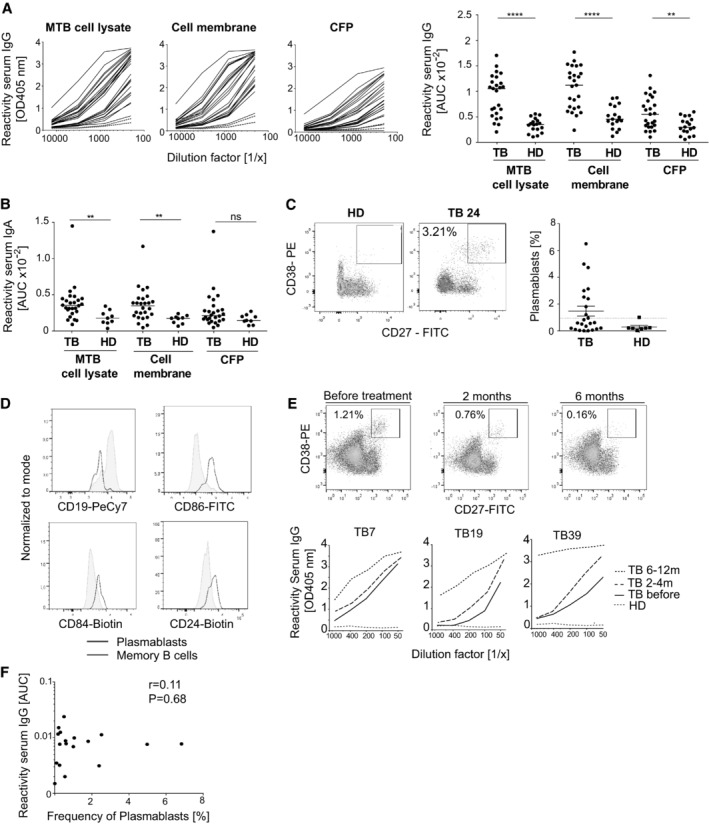
Serum IgG ELISA reactivity with MTB (H37Rv) whole‐cell lysate, purified cell membrane fraction, and secreted culture filtrate proteins (CFP) for TB patients and healthy donors (HD). ELISA graphs (left; TB: black lines; n = 25; HD: red dotted lines; n = 2) and area under the curve (AUC) values for all tested samples (right; TB: n = 25; HD: n = 17) are shown. Median is shown.
AUC values for the IgA serum ELISA response against MTB whole‐cell lysate, purified cell membrane fraction, and secreted culture filtrate proteins (CFP) of TB patients (n = 25) and healthy donors (HD; n = 9). Median is shown.
Flow cytometric gating strategy and frequency of circulating plasmablasts (CD19+CD27++CD38+) for one representative TB patient (TB24) and HD (left). Frequency of circulating CD19+CD27++CD38+ plasmablasts of all CD19+ B cells in the peripheral blood of TB patients (n = 24) and HD (n = 8). Dashed line indicates the threshold for detectable plasmablast populations (right). Median and SEM are shown.
Expression of CD19 and activation markers (CD86, CD84, and CD24) in the plasmablasts and memory B cells as measured by flow cytometry.
Plasmablast response of patient TB7 (top) and IgG serum response against MTB cell lysates of patients TB7, TB19, and TB39 (bottom) and one HD at the indicated time points before and after the treatment onset.
Dots indicate AUC values for the anti‐MTB cell lysate IgG serum ELISA response (y‐axis) versus the frequency of circulating plasmablasts (x‐axis) for individual TB patients. Spearman's correlation and corresponding P‐value are shown.
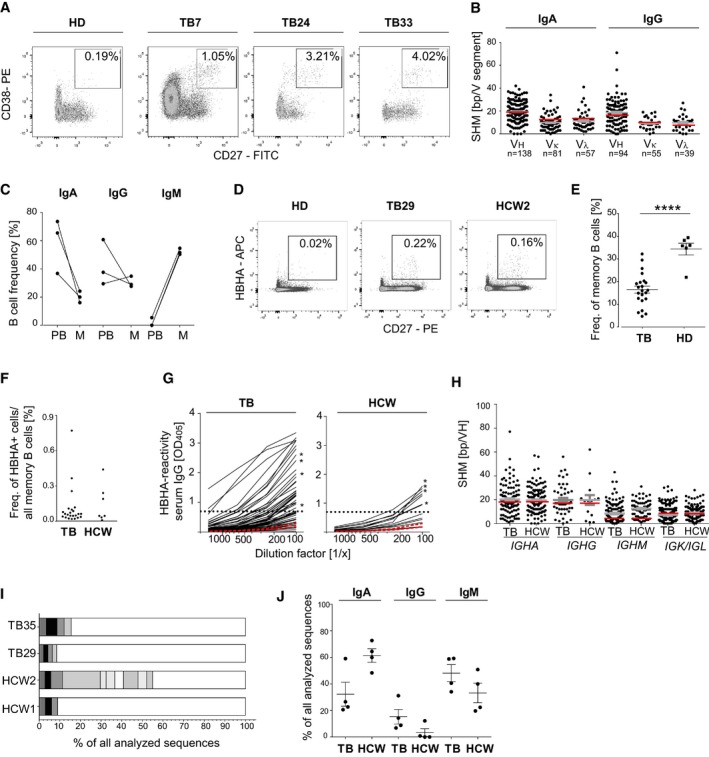
Gating strategy, phenotype, and frequency of circulating plasmablasts (CD19+CD27++CD38+) isolated by flow cytometric cell sorting from three TB patients (TB7, TB24, and TB33) in comparison with one representative HD. Boxes indicate sort gates. The plasmablast frequency is indicated.
Absolute number of somatic hypermutations (SHM) in the IGHV, IGKV, and IGLV segments of IgA and IgG plasmablast antibody genes sequenced from TB7, TB24, and TB33. The absolute number of sequences analyzed is indicated below the graph. Geometric means with SEM are indicated in gray. SHM means of historic data from sorted CD27+IgA+ or CD27+IgG+ cells from the peripheral blood of HD are indicated in red for comparison (Tiller et al, 2007; Berkowska et al, 2015).
Isotype distribution of plasmablast and memory B cells from TB7, TB24, and TB33. PB, plasmablasts (CD19+CD27++CD38+); M, memory B cells (CD19+CD27+).
Gating strategy, phenotype, and frequency of HBHA‐reactive memory B cells (CD19+CD27+HBHA+) in the peripheral blood of one representative TB patient (TB29), healthcare worker (HCW) 2, and HD, respectively.
Dots indicate the frequency of HBHA‐reactive memory B cells out of all CD27+ memory B cells in individual TB patients (n = 23) and HCW (n = 7). Mean and SEM are indicated. P‐value was determined using Wilcoxon–Mann–Whitney test; ****P < 0.0001.
Dots indicate the frequency of resting memory B cells (CD19+CD27+CD10−) out of all B cells in the peripheral blood of individual TB patients compared with HCW.
Anti‐HBHA serum IgG ELISA reactivity for TB patients and HCW (black lines) compared with two representative HDs (red lines). Dashed line indicates the threshold OD405 nm for positive reactivity. Asterisks indicate the serum responses of donors selected for single sorting of HBHA‐reactive memory B cells. Data are representative of two independent experiments.
Absolute number of somatic hypermutations (SHM) in the IGHV (IGHA, IGHG, and IGHM), IGKV, or IGLV segments of sorted anti‐HBHA memory cells from TB patients and HCW. Geometric means with SEM are indicated in gray. For comparison, red lines indicate the historic SHM means for randomly sorted CD27+IgA+, CD27+IgG+, or CD27+IgM+ cells from the peripheral blood of HDs (Tsuiji et al, 2006; Tiller et al, 2007; Berkowska et al, 2015).
The number and size of clonally expanded B‐cell clusters among HBHA‐reactive memory B cells from two TB patients (TB35 and TB29) and HCW (HCW1 and HCW2). Cells in clusters are indicated in gray, and single cells are indicated in white. No B‐cell clusters were shared between donors.
IgA, IgG, and IgM isotype distribution of single‐cell‐sorted HBHA‐reactive memory cells. Mean and SEM are indicated.
- A, B
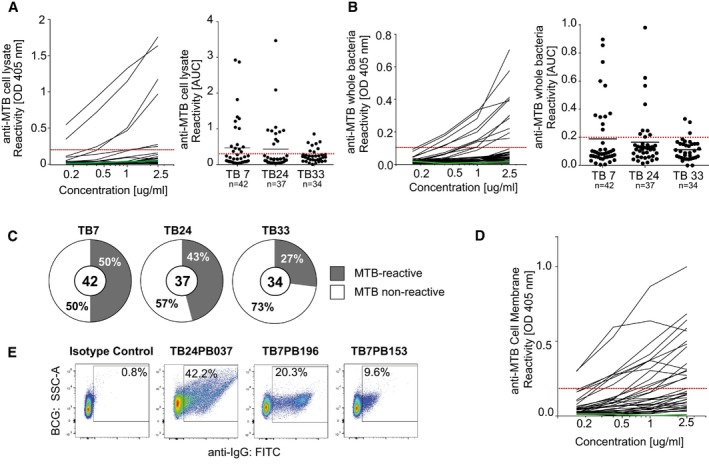
Representative ELISA graphs show the reactivity of antibodies from patient TB7 to (A) MTB whole‐cell lysate or (B) MTB bacteria (left). Dashed red line indicates the threshold OD405 nm for positive reactivity. Green line indicates the negative control antibody (mGO53; Wardemann et al, 2003). AUC (area under curve) values indicate the reactivity to (A) MTB cell lysate or (B) whole MTB bacteria for antibodies from TB7, TB24, and TB33. The total numbers of analyzed antibodies are indicated (right).
- C
Pie charts show the frequency of MTB‐reactive (gray) vs. nonreactive (white) antibodies as measured by whole‐cell lysate and MTB bacteria ELISA for each patient. MTB‐reactive antibodies were positive in both or one of the assays. The total numbers of analyzed antibodies are indicated in the center of the charts.
- D
ELISA graph shows the reactivity to the MTB cell membrane fraction for MTB‐reactive (n = 26) and nonreactive (n = 14) antibodies.
- E
Reactivity to whole BCG bacteria as determined by flow cytometry for three representative MTB cell lysate‐reactive antibodies and one nonreactive antibody (isotype control, mGO53).
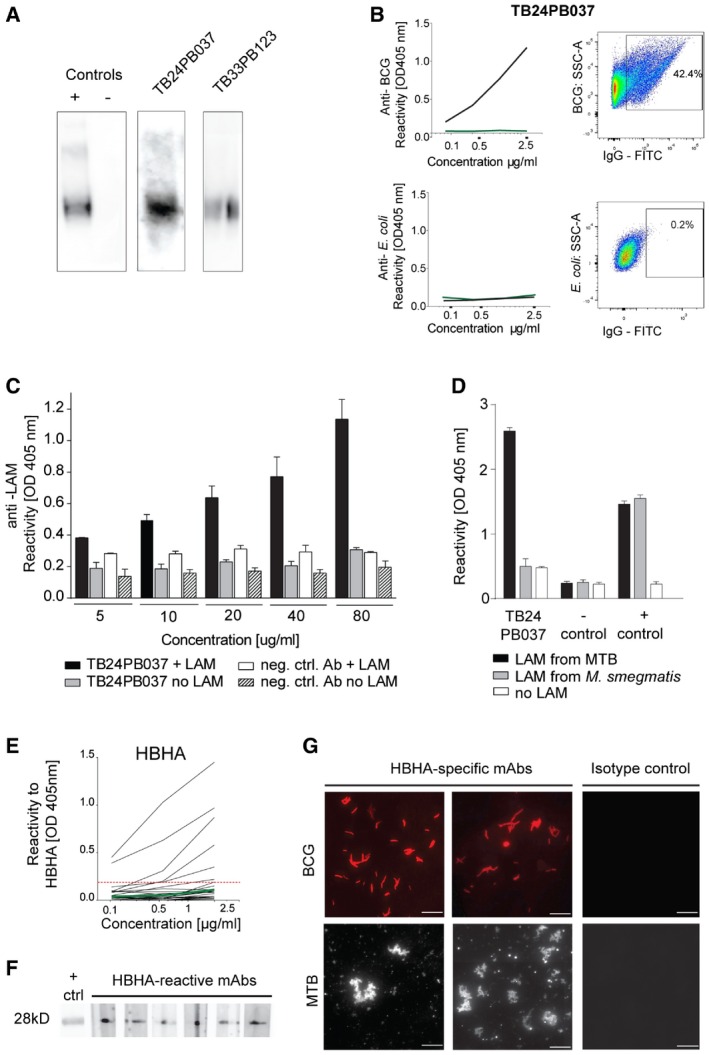
Binding of antibodies TB24PB037 and TB33PB123 to LAM purified from MTB as determined by Western blot. The negative isotype control (mGO53) and a commercially available anti‐LAM antibody (positive control) are shown for comparison.
Anti‐BCG specificity of the LAM‐reactive antibody TB24PB037 (black) compared with E. coli as determined by ELISA with whole bacteria (left) and flow cytometry (right).
Anti‐LAM ELISA for TB24PB037 or negative control antibody at the indicated concentrations. The mean ± SD of the absorbance was calculated.
Antibody TB24PB037 binds to MTB‐LAM, but not to LAM from M. smegmatis. ELISA performed as described in (C). The mean ± SD of the absorbance was calculated.
Representative HBHA ELISA for antibodies cloned from HBHA‐reactive memory B cells of patient TB35 and HCW1. Dashed red line indicates the threshold OD405 nm for positive reactivity. Green line indicates the negative control antibody (mGO53; Wardemann et al, 2003).
Reactivity to HBHA was confirmed by Western blot for a selected set of antibodies with HBHA ELISA reactivity.
Fluorescence microscopy shows BCG and MTB reactivity of representative anti‐HBHA antibodies compared with a nonreactive isotype control antibody. Scale bars, 10 μm.
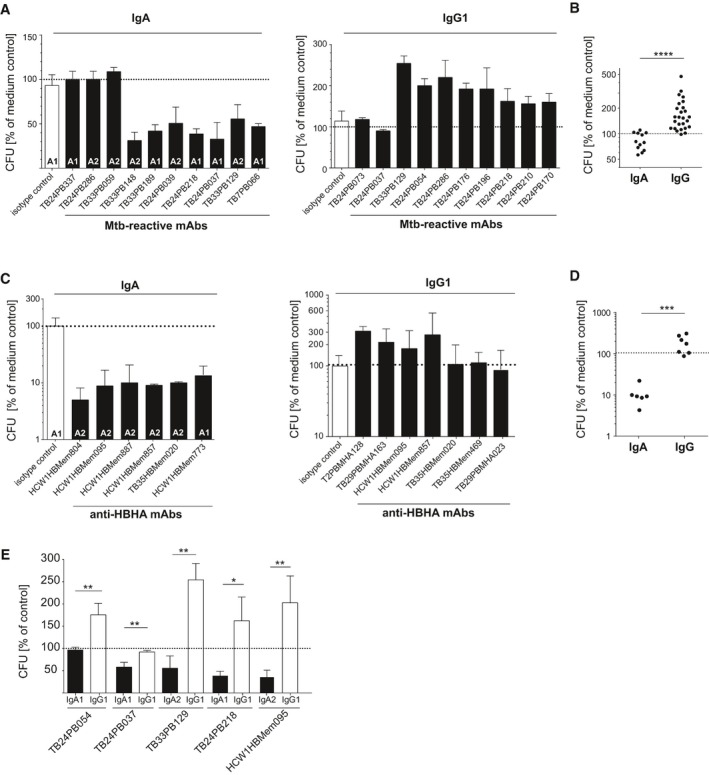
Representative results for individual MTB‐reactive plasmablast antibodies. Mean and SEM are indicated.
Direct comparison of all tested MTB‐reactive IgA (n = 12) and IgG (n = 26) antibodies.
Representative results for individual HBHA‐reactive memory B‐cell antibodies from TB patients and HCW.
Same as in (B) but with HBHA‐reactive antibodies as shown in (C). Direct comparison of all tested HBHA‐reactive IgA (n = 6) and IgG (n = 7) antibodies.
Direct comparison of the indicated MTB‐reactive antibodies expressed as IgA and IgG. Mean and SEM are indicated.
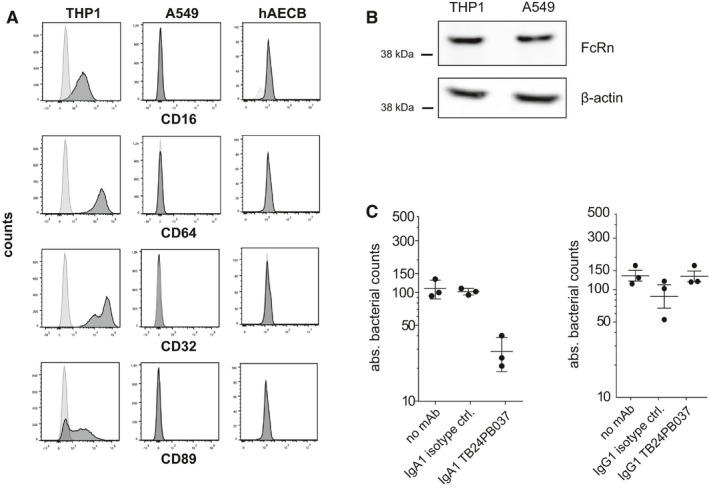
Human lung epithelial A549 cells and primary bronchial epithelial cells (hAECB) lack FcγR (CD16, CD64, and CD32) and FcαR (CD89) cell surface expression as analyzed by flow cytometry. Human THP1 cells serve as a positive control.
The neonatal FcR (FcRn) is expressed in both A549 cells and human THP1 cells as determined by Western blotting. Data are representative of at least two independent experiments.
Absolute bacterial counts (CFUs) in human THP1 macrophages 1 h after infection with MTB preincubated with the LAM‐reactive IgA1 (left) or IgG1 (right) antibody TB24PB037 or the respective isotype control antibody as indicated. Mean and SEM are indicated.
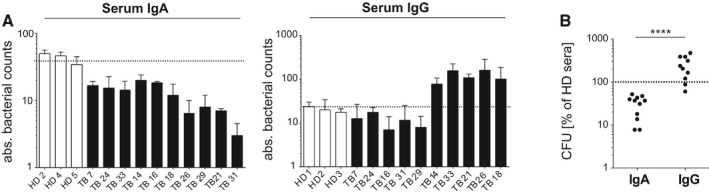
Absolute bacterial counts (CFUs) in human lung epithelial A549 cells 1 h after infection with MTB preincubated with purified serum IgA (left) or IgG (right) antibodies from TB patients (TB) compared with HD as indicated. Mean and SEM are indicated. Data are representative of three independent experiments with three technical replicates each.
Direct comparison of purified serum IgA and IgG antibodies on epithelial cell invasion as measured in (A). P‐value was determined using Wilcoxon–Mann–Whitney test; ****P < 0.0001.
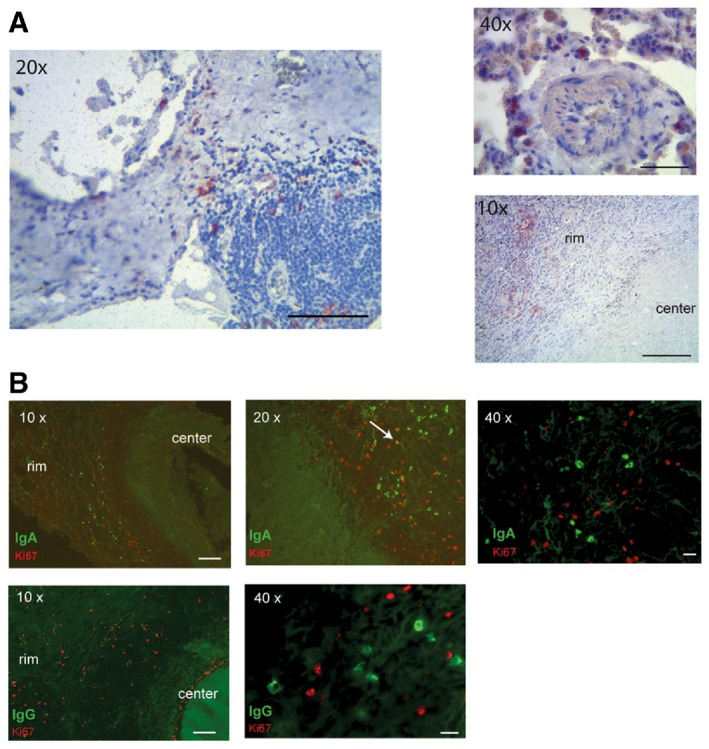
Immunohistochemistry staining for CD138 of infected lung sections from TB patients. Images were taken at different magnifications as indicated. The rim and the center of one granuloma are indicated in the lower right picture.
(Top) Immunofluorescence staining for IgA (green) and Ki67 (red) of infected lung sections of one representative out of three analyzed TB patients. White arrow indicates one Ki67/IgA double‐positive cell. (Bottom) Immunofluorescence staining for IgG (green) and Ki67 (red).
References
-
- Abreu MT, Carvalheiro H, Rodrigues‐Sousa T, Domingos A, Segorbe‐Luis A, Rodrigues‐Santos P, Souto‐Carneiro MM (2014) Alterations in the peripheral blood B cell subpopulations of multidrug‐resistant tuberculosis patients. Clin Exp Med 14: 423–429 - PubMed
-
- Bakema JE, van Egmond M (2011) The human immunoglobulin A Fc receptor FcalphaRI: a multifaceted regulator of mucosal immunity. Mucosal Immunol 4: 612–624 - PubMed
Publication types
MeSH terms
Substances
Grants and funding
LinkOut - more resources
Full Text Sources
Other Literature Sources
Miscellaneous
