. 2016 Sep 29:9:5931-5941.
doi: 10.2147/OTT.S106288. eCollection 2016.

MicroRNA profiling of patient plasma for clinical trials using bioinformatics and biostatistical approaches

Affiliations

MicroRNA profiling of patient plasma for clinical trials using bioinformatics and biostatistical approaches

Joseph Markowitz et al. Onco Targets Ther. .

Abstract

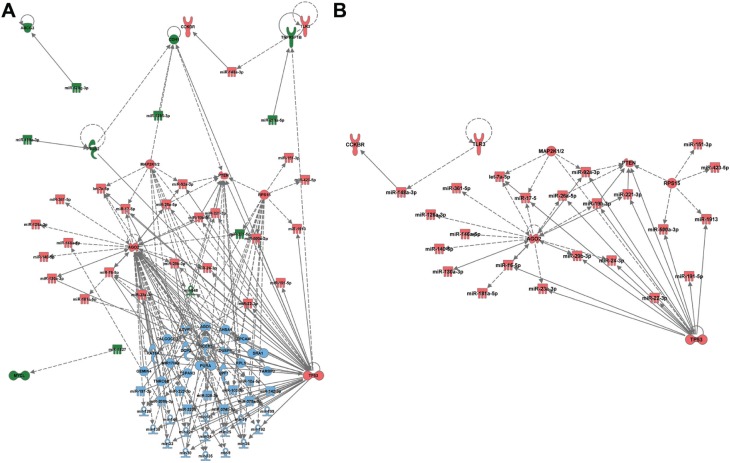
Background: MicroRNAs (miRNAs) are short noncoding RNAs that function to repress translation of mRNA transcripts and contribute to the development of cancer. We hypothesized that miRNA array-based technologies work best for miRNA profiling of patient-derived plasma samples when the techniques and patient populations are precisely defined.

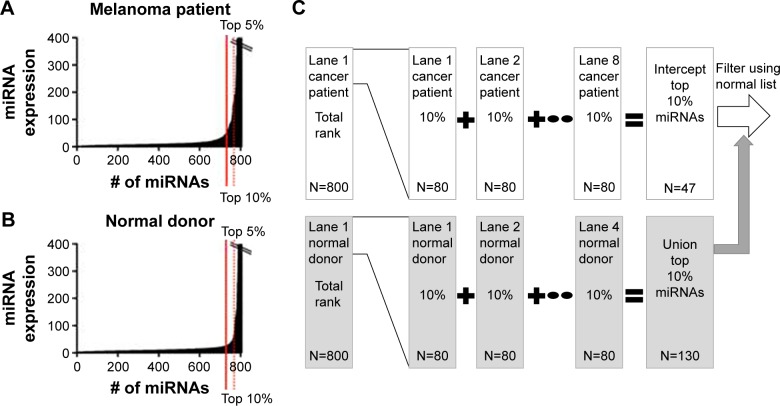
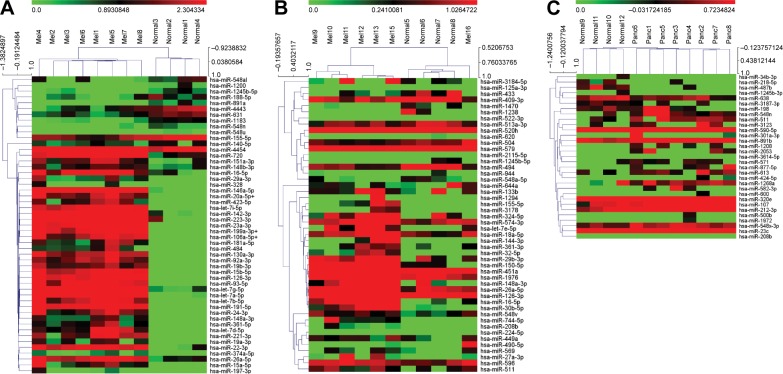
Methods: Plasma samples were obtained from five sources: melanoma clinical trial of interferon and bortezomib (12), purchased normal donor plasma samples (four), gastrointestinal tumor bank (nine), melanoma tumor bank (ten), or aged-matched normal donors (eight) for the tumor bank samples. Plasma samples were purified for miRNAs and quantified using NanoString® arrays or by the company Exiqon. Standard biostatistical array approaches were utilized for data analysis and compared to a rank-based analytical approach.

Results: With the prospectively collected samples, fewer plasma samples demonstrated visible hemolysis due to increased attention to eliminating factors, such as increased pressure during phlebotomy, small gauge needles, and multiple punctures. Cancer patients enrolled in a melanoma clinical study exhibited the clearest pattern of miRNA expression as compared to normal donors in both the rank-based analytical method and standard biostatistical array approaches. For the patients from the tumor banks, fewer miRNAs (<5) were found to be differentially expressed and the false positive rate was relatively high.

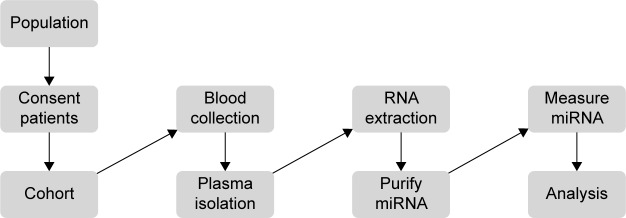
Conclusion: In order to obtain consistent results for NanoString miRNA arrays, it is imperative that patient cohorts have similar clinical characteristics with a uniform sample preparation procedure. A clinical workflow has been optimized to collect patient samples to study plasma miRNAs.

Keywords: melanoma; miRNA; profiling; rank-based statistic.


Figures

Figure 1
Figure 1
Clinical workflow demonstrating inputs and research products for measuring microRNA (miRNA) in patients. Notes: In this study, peripheral phlebotomy techniques were optimized such that it can be performed routinely without visible evidence of hemolysis. This permits the efficient separation of plasma followed by RNA extraction and miRNA measurement without contamination of miRNAs from lysed cells. The miRNA data obtained from RNA isolated from heparin phlebotomy tubes were subjected to complementary biostatistical and rank-based analytical approaches to identify miRNAs from patient plasma samples.
Figure 2
Figure 2
Bioinformatics method to select upregulated microRNAs (miRNAs) for chip 1. Notes: First, the 800 miRNAs identified by NanoString® in each lane (one lane per patient) were ordered from the highest to lowest expression (ranked). (A) A list of the top 5% (45) of the miRNAs present in the plasma of a cancer patient in chip 1 was generated. (B) A list of the top 5% (45) of the miRNAs that were present in the plasma of the first normal control donor was generated. (C) The process was repeated for each of the eight patient samples and four normal donors, and thus 12 such lists were created. The miRNAs that were present in any of the top 5% of the normal donor control lists (four lists, N=56; union of the control list) were removed from the miRNAs that were present in the top 5% of highly expressing miRNAs in all the patient lists (eight lists, N=25; intercept of the patient lists) to generate a list consisting of 22 upregulated miRNAs in patient samples. The selection of upregulated miRNAs begins in a convenient sample size of the top 5% of the miRNA list and repeats the process of finding upregulated miRNAs by expanding the feature list size (by 5%) through multiple iterations until the most number of upregulated miRNAs are selected that have a nonrandom false positive rate (estimated sensitivity and specificity >99.99%). For the first chip, the cutoff of selecting upregulated miRNAs is 10%. The upregulated miRNA final list (32 miRNAs) in this case is a combination of the miRNAs found to be upregulated in the top 5% or 10% lists (false positive rate <0.01).
Figure 3
Figure 3
There is uniform clustering of microRNA (miRNA) expression in patients with similar cancer burden and receiving similar therapy. Notes: (A) Chip 1 consisted of miRNA from eight patients undergoing treatment with interferon and bortezomib and four normal donor controls. For chip 1, only statistically significant miRNAs (P= 1/227=0.0043) are included in the heat map. (B) Chip 2 consisted of miRNA from seven melanoma patients receiving various treatments (surgery, radiation, immunotherapy, and/or targeted therapies) and four normal donor controls. (C) Chip 3 consisted of miRNAs from eight metastatic pancreatic cancer patients receiving various treatments (including gemcitabine-based, 5-fluorouracil-based, and participation in a clinical trial consisting of carboplatin/paclitaxel ± Reolysin virus and four normal donor controls). For chips 2 and 3, all miRNA with P<0.05 are included in the heat map given that fewer statistically significant miRNAs were found in these chips. Notice that even though there are fewer statistically significant individual miRNAs that are differentially expressed between the cancer patients and normal donor controls, the cancer groups still segregate fairly well as measured by the hierarchical clustering in the MeV program (www.tm4.org, Multi Experiment Viewer open source software).
Figure 4
Figure 4
Comparison of pathways generated using the Ingenuity Pathway Analysis® (IPA; Qiagen, Redwood City, CA, USA) software using bioinformatics and biostatistical approaches. Notes: (A) IPA software was utilized to create pathway maps utilizing the upregulated microRNAs in either the rank-based analysis or biostatistical analysis and merged to create the figure. The color scheme is rank-based (green), biostatistical (blue), or common to rank-based and biostatistical (red). (B) When the elements common to biostatistical and rank-based analyses are analyzed in IPA, several key proteins known to be important in melanoma are found (p53, PTEN, and TLR3).

References

    1. Siegel RL, Miller KD, Jemal A. Cancer statistics, 2016. CA Cancer J Clin. 2016;66(1):7–30. - PubMed
    1. Coit DG, Thompson JA, Algazi A, et al. Melanoma, version 2. 2016, NCCN clinical practice guidelines in oncology. J Natl Compr Canc Netw. 2016;14(4):450–473. - PubMed
    1. Cortez MA, Bueso-Ramos C, Ferdin J, Lopez-Berestein G, Sood AK, Calin GA. MicroRNAs in body fluids – the mix of hormones and biomarkers. Nat Rev Clin Oncol. 2011;8(8):467–477. - PMC - PubMed
    1. Grignol V, Fairchild ET, Zimmerer JM, et al. miR-21 and miR-155 are associated with mitotic activity and lesion depth of borderline melanocytic lesions. Br J Cancer. 2011;105(7):1023–1029. - PMC - PubMed
    1. Segura MF, Belitskaya-Levy I, Rose AE, et al. Melanoma microRNA signature predicts post-recurrence survival. Clin Cancer Res. 2010;16(5):1577–1586. - PMC - PubMed

LinkOut - more resources