

Toxicity of ZnO and TiO2 to Escherichia coli cells
- PMID: 27731373
- PMCID: PMC5378928
- DOI: 10.1038/srep35243
Toxicity of ZnO and TiO2 to Escherichia coli cells
Abstract
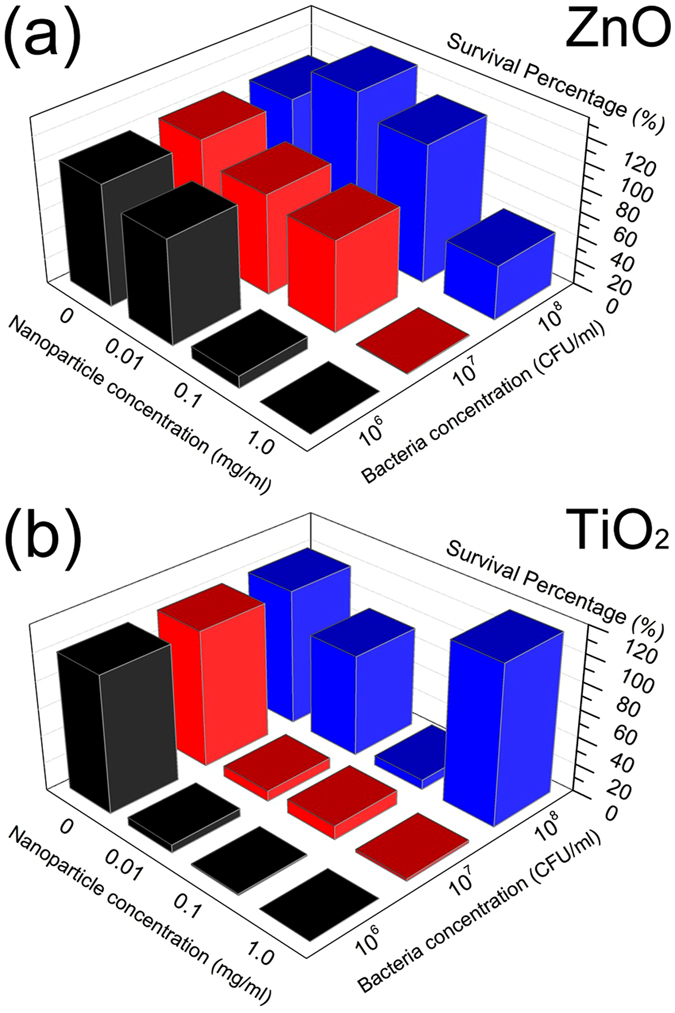
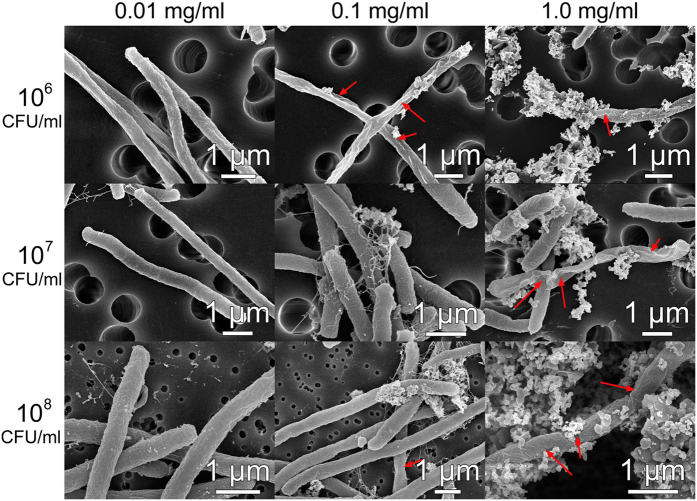
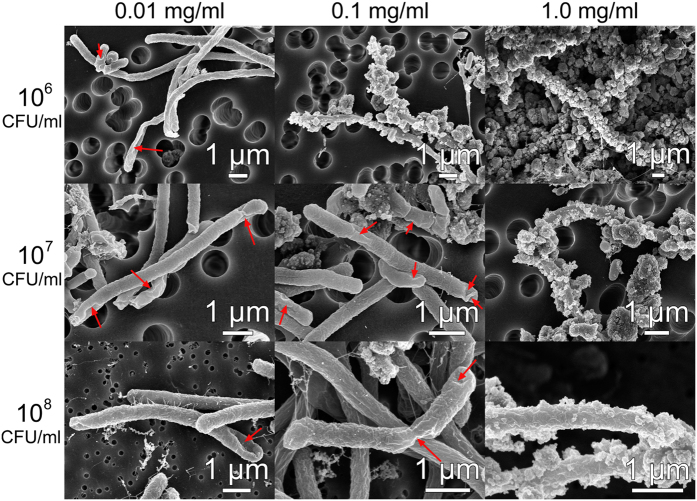
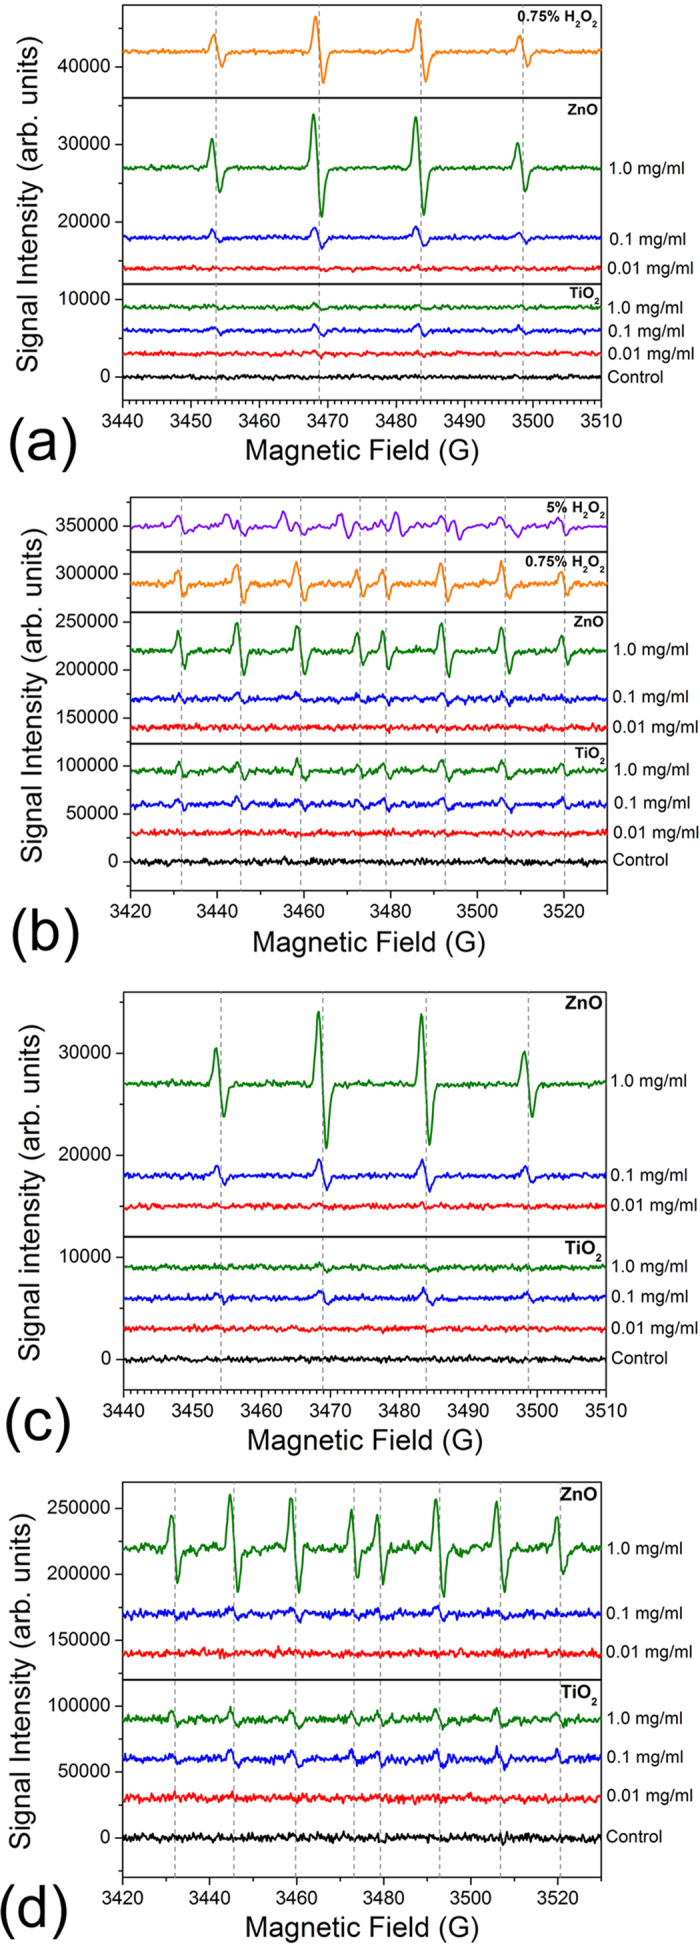
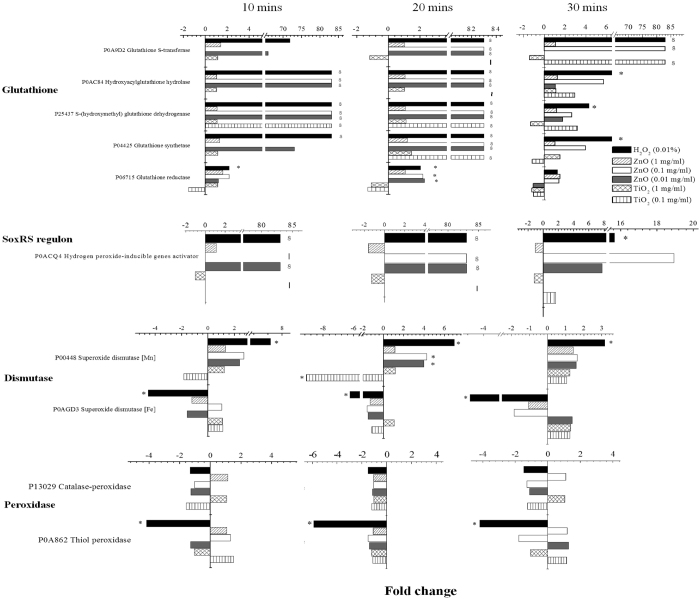
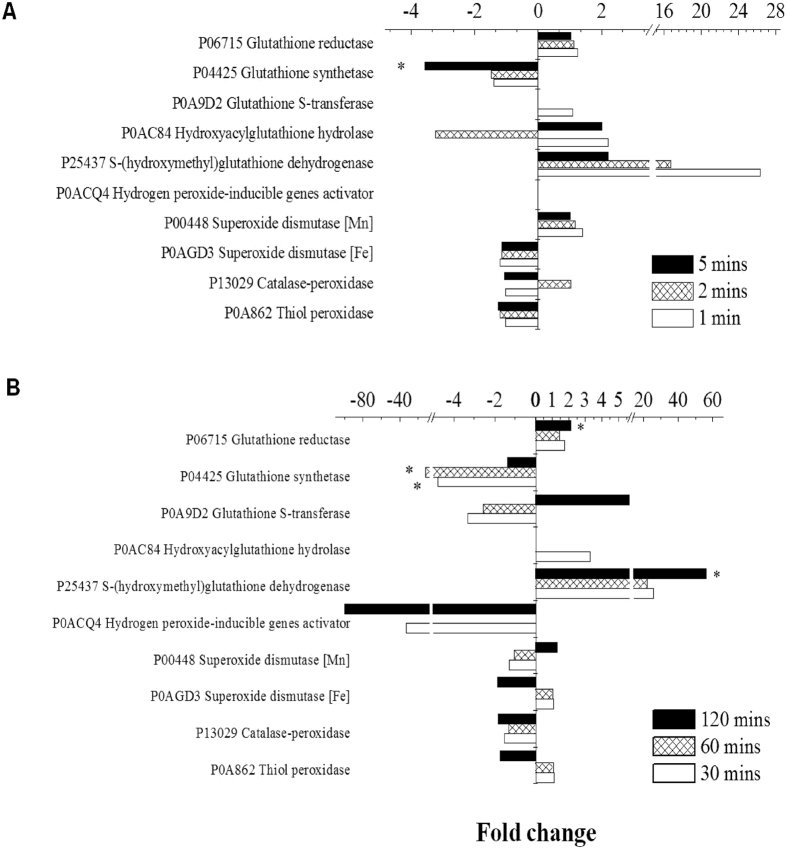
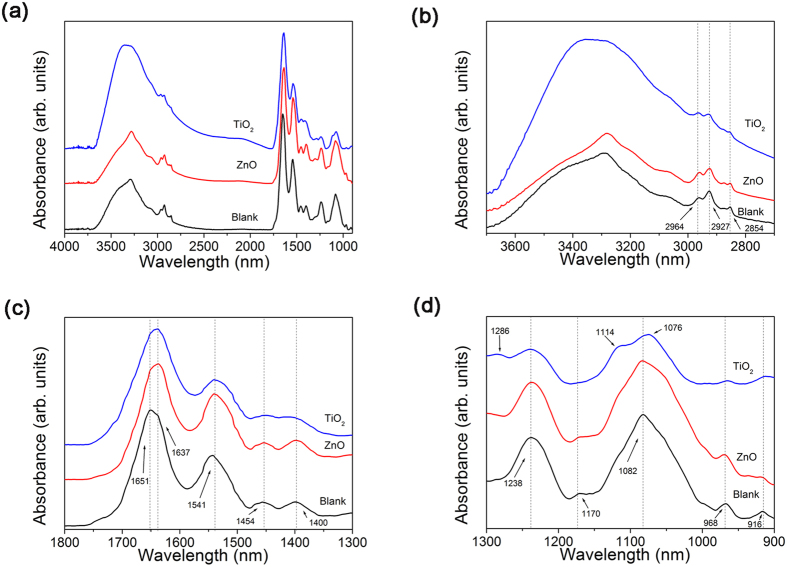
We performed a comprehensive investigation of the toxicity of ZnO and TiO2 nanoparticles using Escherichia coli as a model organism. Both materials are wide band gap n-type semiconductors and they can interact with lipopolysaccharide molecules present in the outer membrane of E. coli, as well as produce reactive oxygen species (ROS) under UV illumination. Despite the similarities in their properties, the response of the bacteria to the two nanomaterials was fundamentally different. When the ROS generation is observed, the toxicity of nanomaterial is commonly attributed to oxidative stress and cell membrane damage caused by lipid peroxidation. However, we found that significant toxicity does not necessarily correlate with up-regulation of ROS-related proteins. TiO2 exhibited significant antibacterial activity, but the protein expression profile of bacteria exposed to TiO2 was different compared to H2O2 and the ROS-related proteins were not strongly expressed. On the other hand, ZnO exhibited lower antibacterial activity compared to TiO2, and the bacterial response involved up-regulating ROS-related proteins similar to the bacterial response to the exposure to H2O2. Reasons for the observed differences in toxicity and bacterial response to the two metal oxides are discussed.
Conflict of interest statement
The authors declare no competing financial interests.
Figures
References
-
- Huh A. J. & Kwon Y. J. “Nanoantibiotics”: a new paradigm for treating infectious diseases using nanomaterials in the antibiotics resistant era. J. Controlled Release 156, 128–145 (2011). - PubMed
-
- von Moos N. & Slaveykova V. I. Oxidative stress induced by inorganic nanoparticles in bacteria and aquatic microalgae–state of the art and knowledge gaps. Nanotoxicology 8, 605–630 (2014). - PubMed
-
- Aruguete D. M. & Hochella M. F. Bacteria–nanoparticle interactions and their environmental implications. Environ. Chem. 7, 3–9 (2010).
-
- Guadagnini R. et al. Toxicity screenings of nanomaterials: challenges due to interference with assay processes and components of classic in vitro tests. Nanotoxicology 9, 13–24 (2015). - PubMed
Publication types
MeSH terms
Substances
LinkOut - more resources
Full Text Sources
Other Literature Sources
Medical
Miscellaneous
