. 2016 Oct 12:6:35196.
doi: 10.1038/srep35196.

Thapsigargin sensitizes human esophageal cancer to TRAIL-induced apoptosis via AMPK activation

Affiliations

Thapsigargin sensitizes human esophageal cancer to TRAIL-induced apoptosis via AMPK activation

Zhiqiang Ma et al. Sci Rep. .

Abstract

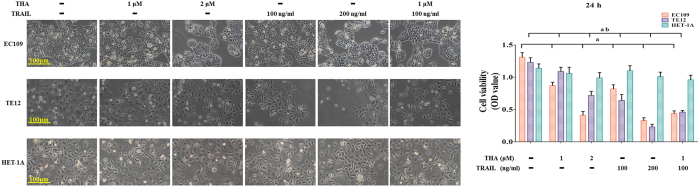
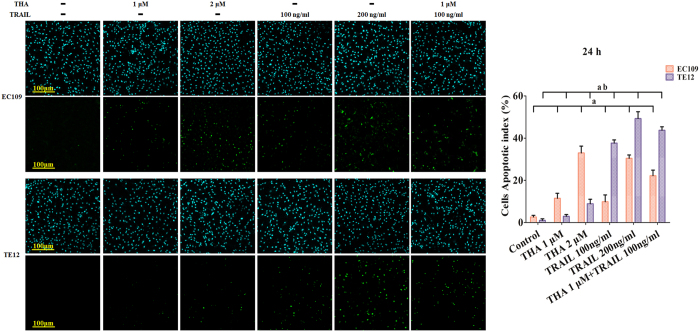
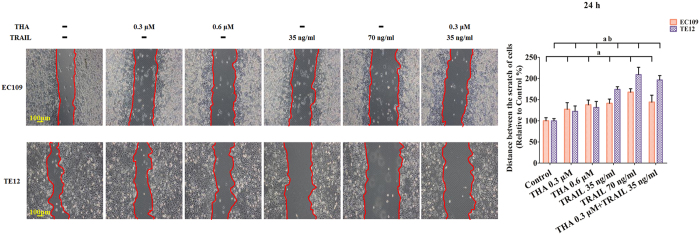
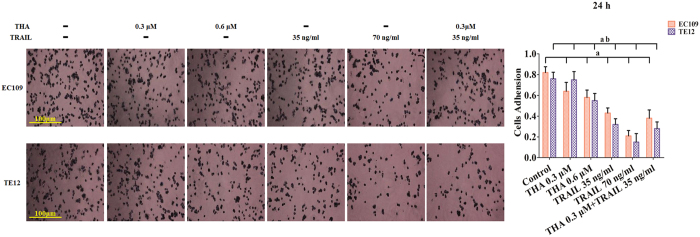
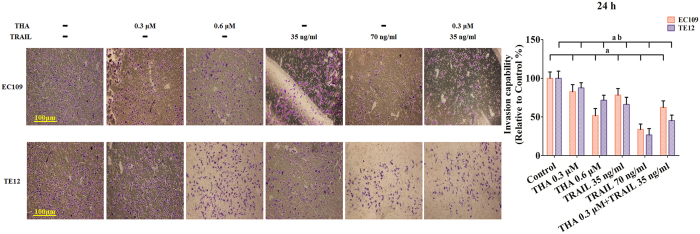
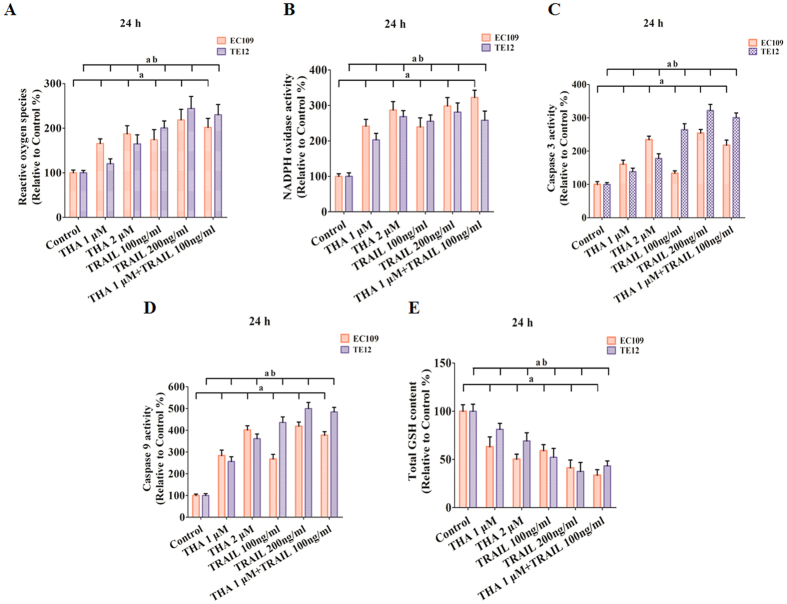
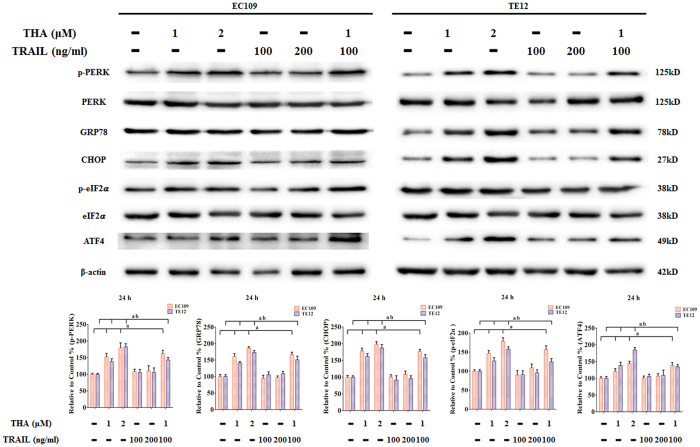
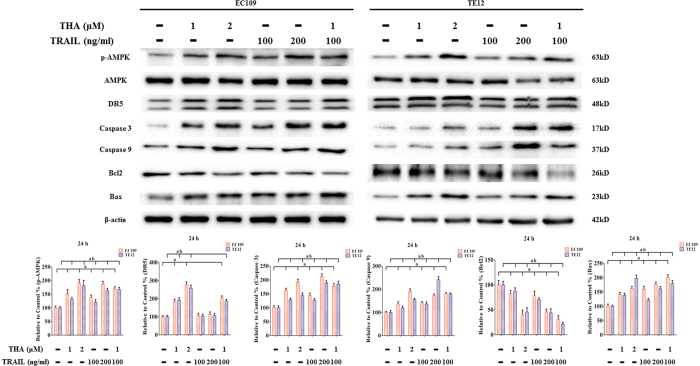
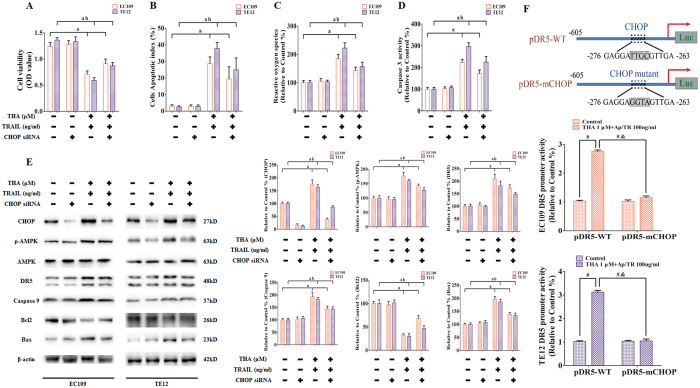
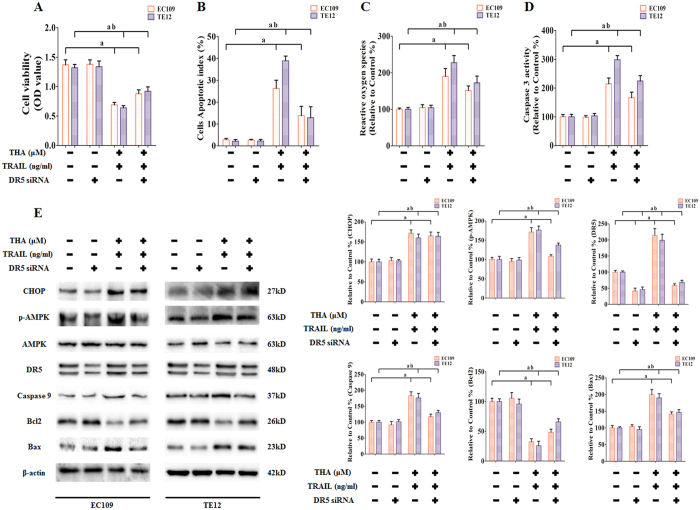
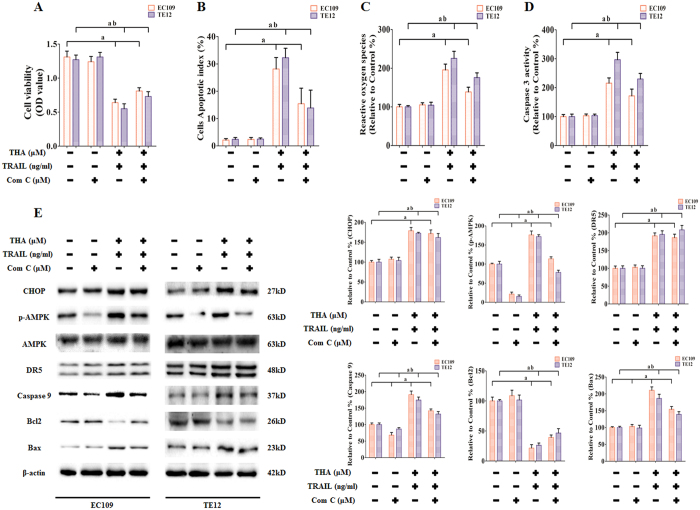
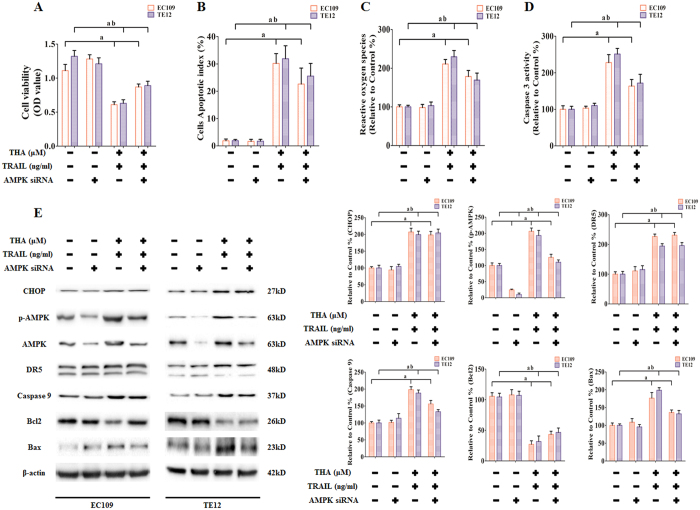
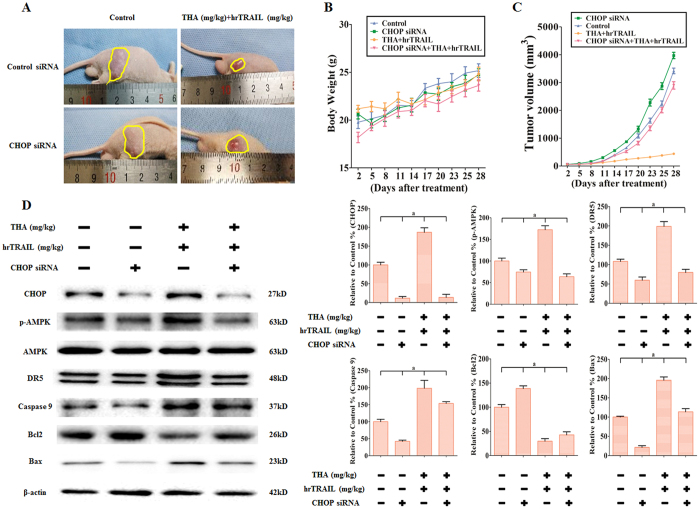
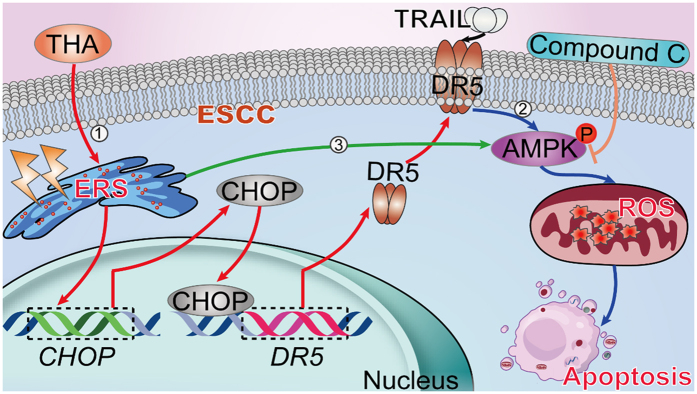
Tumor necrosis factor-related apoptosis-inducing ligand (TRAIL) is a promising anticancer agent for esophageal squamous cell carcinoma (ESCC). Forced expression of CHOP, one of the key downstream transcription factors during endoplasmic reticulum (ER) stress, upregulates the death receptor 5 (DR5) levels and promotes oxidative stress and cell death. In this study, we show that ER stress mediated by thapsigargin promoted CHOP and DR5 synthesis thus sensitizing TRAIL treatment, which induced ESCC cells apoptosis. These effects were reversed by DR5 siRNA in vitro and CHOP siRNA both in vitro and in vivo. Besides, chemically inhibition of AMPK by Compound C and AMPK siRNA weakened the anti-cancer effect of thapsigargin and TRAIL co-treatment. Therefore, our findings suggest ER stress effectively sensitizes human ESCC to TRAIL-mediated apoptosis via the TRAIL-DR5-AMPK signaling pathway, and that activation of ER stress may be beneficial for improving the efficacy of TRAIL-based anti-cancer therapy.


Figures

Figure 1
Figure 1. Thapsigargin and TRAIL co-treatment inhibit the viability in human ESCC cells, but not in human normal esophageal epithelial cells.
Human ESCC cells (EC109 and TE12) were treated with increasing concentrations of thapsigargin (1 and 2 μM) and TRAIL (100 and 200 ng/ml) for 24 h. The cell viability was analyzed by MTT. Meanwhile, human normal esophageal epithelial cells (HET-1A) were given the same treatment as above. The cell viability is expressed as OD values. The morphology of both of the ESCC cells and normal esophageal epithelial cells were observed under an inverted phase-contrast microscope after the cells were treated for 24 h, and images were obtained. Significant cell shrinkage and a decreased cellular attachment rate were observed in the thapsigargin or TRAIL treatment groups, especially in drug combination. All of the results are expressed as the mean ± SD; n = 6. aP < 0.05 vs. the control group in EC109 cells, abP < 0.05 vs. the control group in TE12 cells.
Figure 2
Figure 2. Thapsigargin and TRAIL co-treatment promote the apoptosis in human ESCC cells (24 h).
After treatment, a dose-dependent increase was observed in apoptosis, particularly in combined treatment group. The upper panel showed the cell nucleus (blue) and the lower panel showed the apoptotic cells (green), respectively. All of the results are expressed as the mean ± SD; n = 6. aP < 0.05 vs. the control group in EC109 cells, abP < 0.05 vs. the control group in TE12 cells.
Figure 3
Figure 3. Thapsigargin and TRAIL co-treatment restrain the migration in human ESCC cells (24 h).
The migratory ability of ESCC cells is expressed as the mean distance between the two sides of the scratch. The mean distance in the control group was set as 100%. The results are expressed as the mean ± SD; n = 6. aP < 0.05 vs. the control group in EC109 cells, abP < 0.05 vs. the control group in TE12 cells.
Figure 4
Figure 4. Thapsigargin and TRAIL co-treatment suppress the adhesion in human ESCC cells (24 h).
The adhesion ability of ESCC cells is expressed as an adhesion ratio. The number of adherent cells in the control group was set as 100%. The results are expressed as the mean ± SD; n = 6. aP < 0.05 vs. the control group in EC109 cells, abP < 0.05 vs. the control group in TE12 cells.
Figure 5
Figure 5. Thapsigargin and TRAIL co-treatment repress the invasion in human ESCC cells (24 h).
Representative invasive capability images are shown. The invasive capability is expressed as an invasion rates. The number of invasive cells in the control group was set as 100%. The results are expressed as the mean ± SD; n = 6. aP < 0.05 vs. the control group in EC109 cells,abP < 0.05 vs. the control group in TE12 cells.
Figure 6
Figure 6. Thapsigargin and TRAIL co-treatment regulate the ROS generation, NADPH oxidase activity, Caspase 3 activity, Caspase 9 activity, and GSH levels in human ESCC cells (24 h).
(A) ROS concentrations are shown. (B) NADPH oxidase activity is shown. (C) The intracellular Caspase 3 activity levels are shown. (D) The intracellular Caspase 9 activity levels are shown. (E) Intracellular GSH levels are shown. The three indexes in the control group were defined as 100%. The results are expressed as the mean ± SD; n = 6. aP < 0.05 vs. the control group in EC109 cells, abP < 0.05 vs. the control group in TE12 cells.
Figure 7
Figure 7. Effect of Thapsigargin and TRAIL co-treatment on ERS signaling in human ESCC cells (24 h).
Representative Western blot results of p-PERK, GRP78, CHOP, p-eIF2α, and ATF4 are shown. Membranes were re-probed for β-actin expression to show that similar amounts of protein were loaded in each lane. The results are expressed as the mean ± SD; n = 6.aP < 0.05 vs. the control group in EC109 cells, abP < 0.05 vs. the control group in TE12 cells.
Figure 8
Figure 8. Effect of Thapsigargin and TRAIL co-treatment on AMPK phosphorylation, DR5 upregulation, and apoptosis-associated proteins in human ESCC cells (24 h).
Representative Western blot results of p-AMPK, DR5, Caspase 3, Caspase 9, Bcl2 and Bax are shown. Membranes were re-probed for β-actin expression to show that similar amounts of protein were loaded in each lane. The results are expressed as the mean ± SD; n = 6. aP < 0.05 vs. the control group in EC109 cells, abP < 0.05 vs. the control group in TE12 cells.
Figure 9
Figure 9. CHOP-mediated DR5 upregulation is critical for thapsigargin-stimulated TRAIL-induced apoptosis in ESCC cells.
(A) Viability is shown as OD values. (B) Apoptosis is shown as apoptotic index. (C) ROS concentrations are shown. (D) The intracellular Caspase 9 activity levels are shown. The two indexes in the control group were defined as 100%. (E) Representative Western blot results of the key proteins, including CHOP, p-AMPK, DR5, Caspase 9, Bcl2, and Bax are shown. Membranes were re-probed for β-actin expression to show that similar amounts of protein were loaded in each lane. (F) Schematic diagram of the DR5 promoter constructs used for the luciferase activity assay (top). ESCC cells were transfected with pDR5-605-WT or pDR5-605-mCHOP promoter constructs and β-gal plasmid and then treated with thapsigargin (1 μM) plus TRAIL (100 ng/ml) for 24 hours and cells were lysed for luciferase assay (EC109 as middle, TE12 as bottom). The results are expressed as the mean ± SD; n = 6. aP < 0.05 vs. the control siRNA group in EC109 cells, abP < 0.05 vs. the control siRNA group in TE12 cells.
Figure 10
Figure 10. Effect of Thapsigargin and TRAIL co-treatment combined with DR5 siRNA on cell viability, apoptosis, ROS induction, Caspase 3 activity, and key proteins in human ESCC cells.
(A) Viability is shown as OD values. (B) Apoptosis is shown as apoptotic index. (C) ROS concentrations are shown. (D) The intracellular Caspase 9 activity levels are shown. The two indexes in the control group were defined as 100%. (E) Representative Western blot results of the key proteins, including CHOP, p-AMPK, DR5, Caspase 9, Bcl2, and Bax are shown. Membranes were re-probed for β-actin expression to show that similar amounts of protein were loaded in each lane. The results are expressed as the mean ± SD; n = 6. aP < 0.05 vs. the control siRNA group in EC109 cells, abP < 0.05 vs. the control siRNA group in TE12 cells.
Figure 11
Figure 11. The role of AMPK activation in thapsigargin-stimulated TRAIL-induced apoptosis in ESCC cells.
The ESCC cells were co-treated with Compound C (1 μM), thapsigargin (1 μM), and TRAIL (100 ng/ml) for 24 h. (A) Viability is shown as OD values. (B) Apoptosis is shown as apoptotic index. (C) ROS concentrations are shown. (D) The intracellular Caspase 9 activity levels are shown. The two indexes in the control group were defined as 100%. (E) Representative Western blot results of the key proteins, including CHOP, p-AMPK, DR5, Caspase 9, Bcl2, and Bax are shown. Membranes were re-probed for β-actin expression to show that similar amounts of protein were loaded in each lane. The results are expressed as the mean ± SD; n = 6. aP < 0.05 vs. the control siRNA group in EC109 cells, abP < 0.05 vs. the control siRNA group in TE12 cells.
Figure 12
Figure 12. The role of AMPK production in thapsigargin-stimulated TRAIL-induced apoptosis in ESCC cells.
After treated with AMPK siRNA for 48 h, the ESCC cells were administrated with thapsigargin (1 μM) and the TRAIL (100 ng/ml) for 24 h. (A) Viability is shown as OD values. (B) Apoptosis is shown as apoptotic index. (C) ROS concentrations are shown. (D) The intracellular Caspase 9 activity levels are shown. The two indexes in the control group were defined as 100%. (E) Representative Western blot results of the key proteins, including CHOP, p-AMPK, DR5, Caspase 9, Bcl2, and Bax are shown. Membranes were re-probed for β-actin expression to show that similar amounts of protein were loaded in each lane. The results are expressed as the mean ± SD; n = 6. aP < 0.05 vs. the control siRNA group in EC109 cells, abP < 0.05 vs. the control siRNA group in TE12 cells.
Figure 13
Figure 13. CHOP upregulation is critical for thapsigargin-stimulated TRAIL-induced apoptosis in nude mice carrying EC109 tumor xenografts.
(A) Photographs showing tumor xenograft morphologies in each group. (B) Change in body weight of the mice. (C) A tumor growth curve was drawn from the tumor volumes and treatment duration. (D) Representative Western blot results of CHOP, p-AMPK, DR5, Caspase 9, Bcl2, and Bax are shown. Membranes were re-probed for β-actin expression to show that similar amounts of protein were loaded in each lane. The results are expressed as the mean ± SD; n = 6. aP < 0.05 vs. the control group in EC109 cells.
Figure 14
Figure 14. Schematic diagram of thapsigargin-stimulated TRAIL-induced apoptosis in human ESCC.
ER stress response could effectively sensitize human esophageal cancer to TRAIL-mediated apoptosis via TRAILRs and AMPK pathway. Details are as follows: ① Induction of ER stress with thapsigargin increases the CHOP expression, and then CHOP upregulates DR5 by combining to CHOP-binding site. Upregulation of DR5 improves the receptor number which could bond more TRAIL in ESCC cells. ② TRAIL/DR5 binding induced ESCC cells apoptosis mediated by ROS via AMPK phosphorylation. ③ Induction of ER stress can directly activate AMPK phosphorylation, which play an efficient role against ESCC cells. ESCC, esophageal squamous cell carcinoma; THA, thapsigargin; ERS, endoplasmic reticulum stress; CHOP, C/EBP-homologous protein; DR5 (i.e., Apo2), death receptor 5; TRAIL, tumor necrosis factor (TNF)-related apoptosis-inducing ligand; AMPK, adenosine monophosphate activated protein kinase; ROS, reactive oxygen species.

References

    1. Chen W. et al. Cancer statistics in China, 2015. CA Cancer J Clin (2016). - PubMed
    1. Wei W. Q. et al. Long-Term Follow-Up of a Community Assignment, One-Time Endoscopic Screening Study of Esophageal Cancer in China. J Clin Oncol 33, 1951–1957 (2015). - PMC - PubMed
    1. Kamangar F., Dores G. M. & Anderson W. F. Patterns of cancer incidence, mortality, and prevalence across five continents: defining priorities to reduce cancer disparities in different geographic regions of the world. J Clin Oncol 24, 2137–2150 (2006). - PubMed
    1. Ron D. & Walter P. Signal integration in the endoplasmic reticulum unfolded protein response. Nat Rev Mol Cell Biol 8, 519–529 (2007). - PubMed
    1. Malhotra J. D. & Kaufman R. J. The endoplasmic reticulum and the unfolded protein response. Semin Cell Dev Biol 18, 716–731 (2007). - PMC - PubMed

Publication types

MeSH terms

Substances