. 2016 Oct 12:6:35267.
doi: 10.1038/srep35267.

Doxorubicin and resveratrol co-delivery nanoparticle to overcome doxorubicin resistance

Affiliations

Doxorubicin and resveratrol co-delivery nanoparticle to overcome doxorubicin resistance

Yuan Zhao et al. Sci Rep. .

Abstract

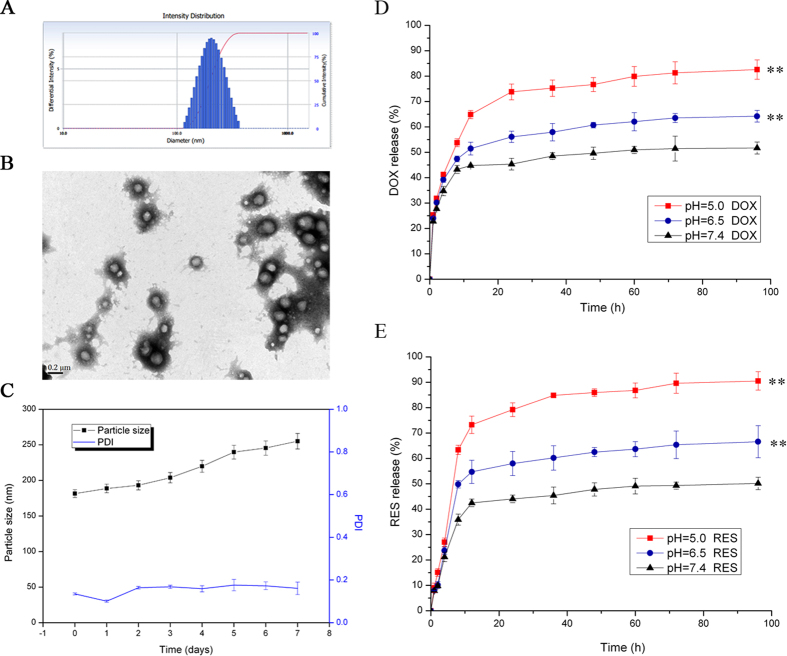
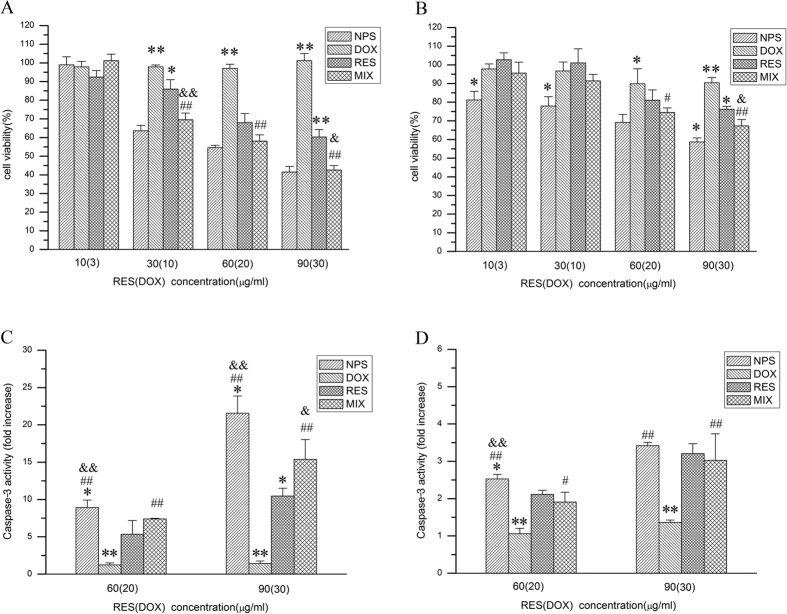
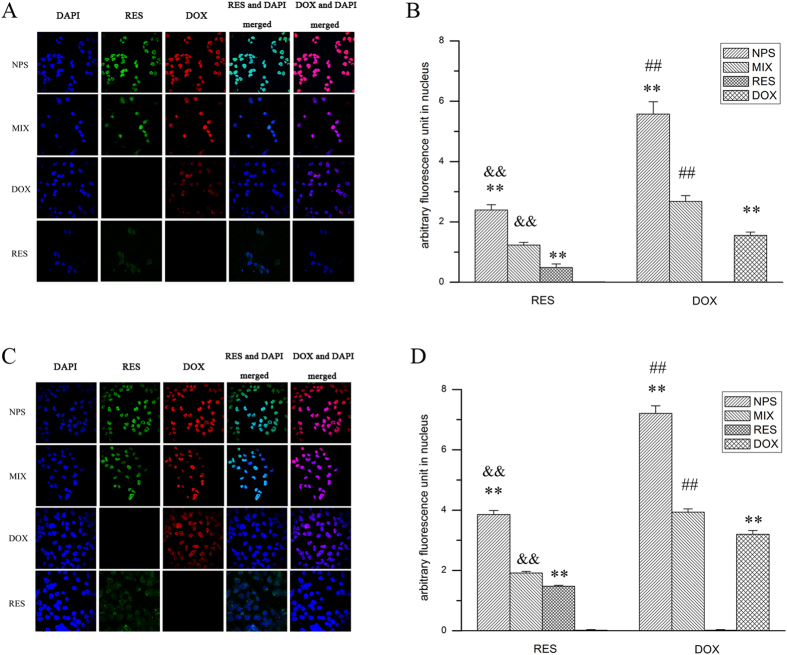
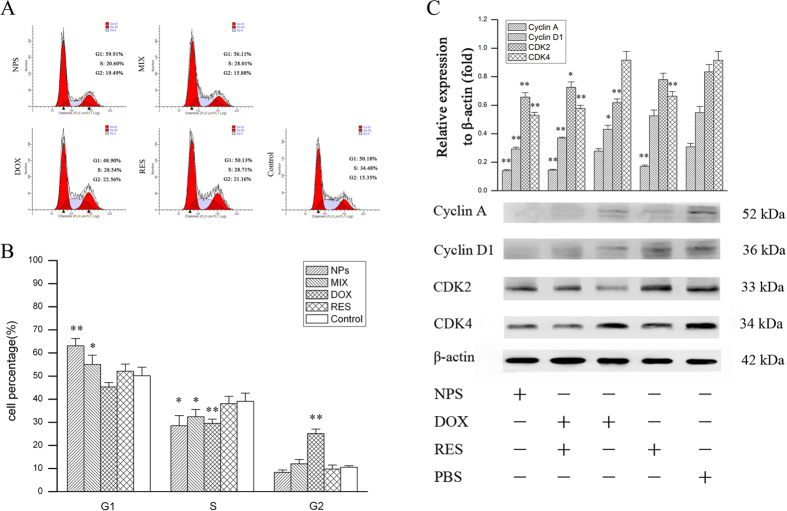
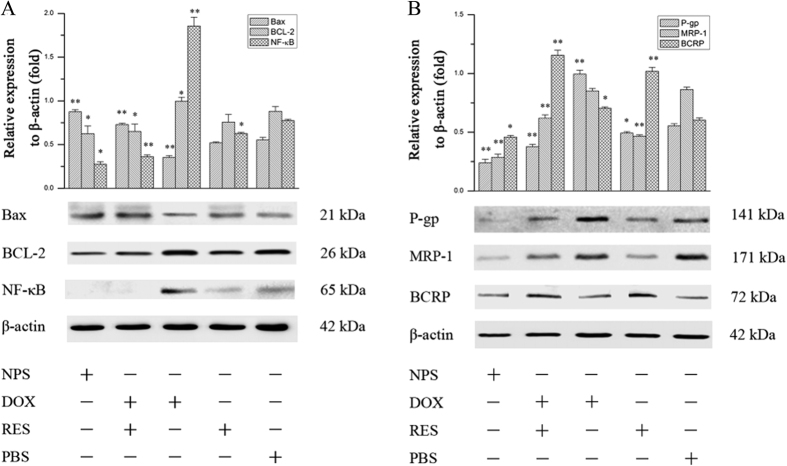
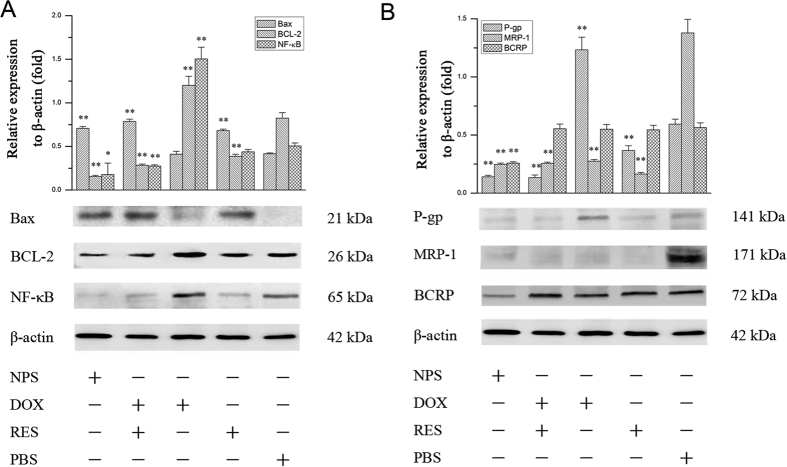
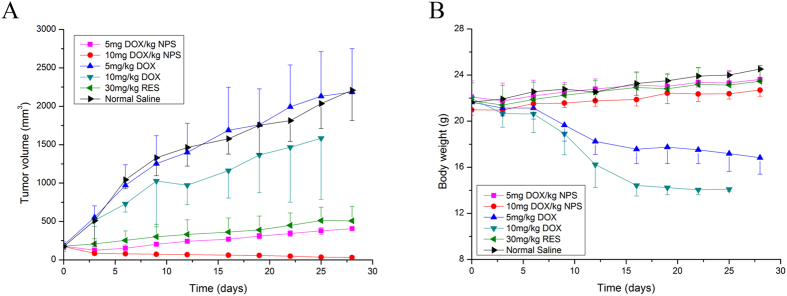
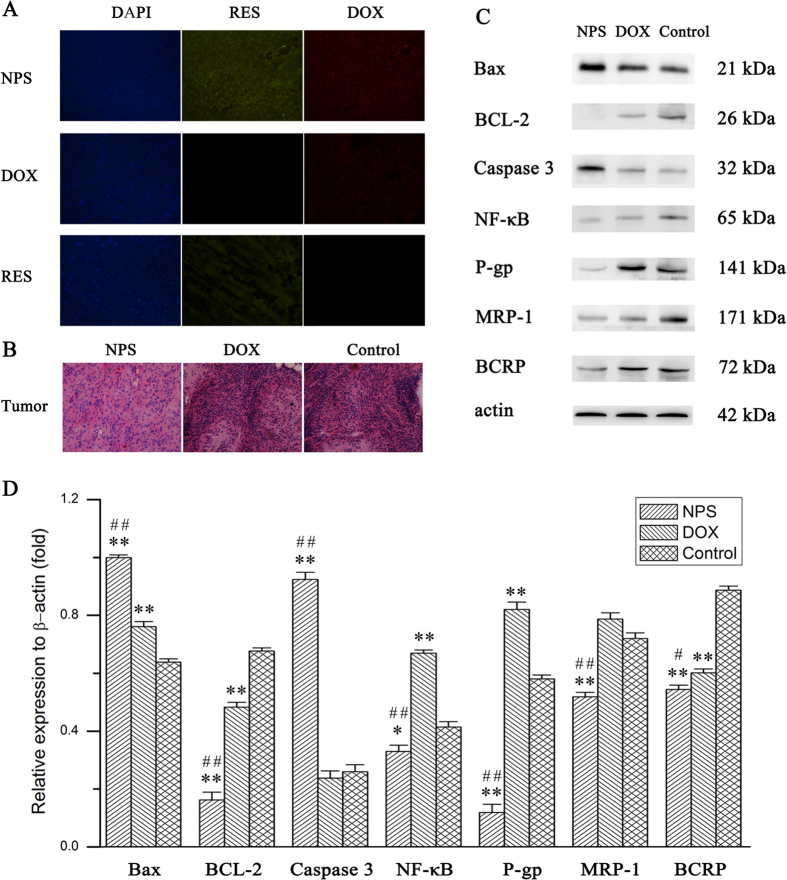
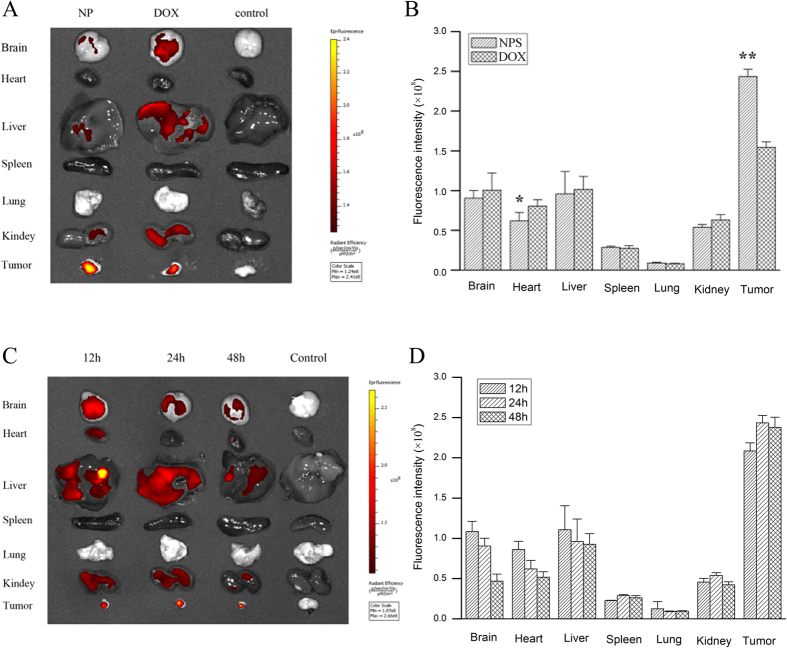
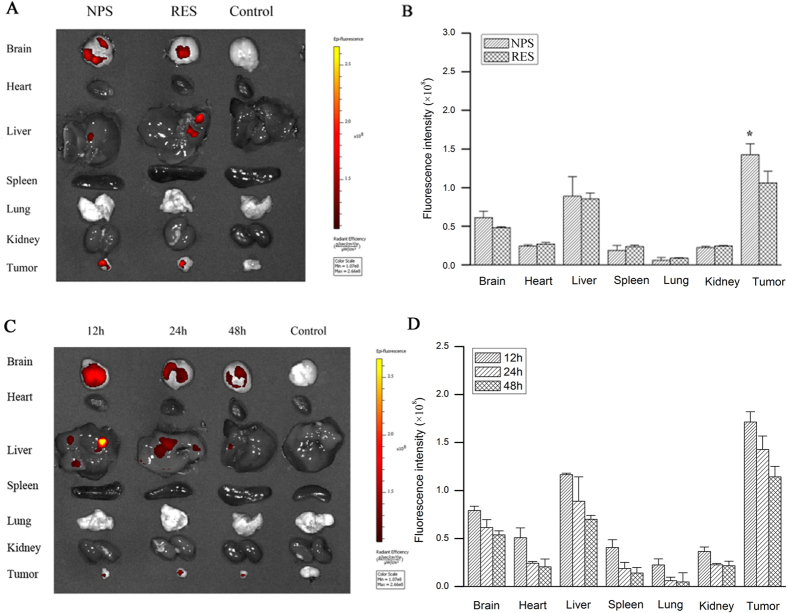
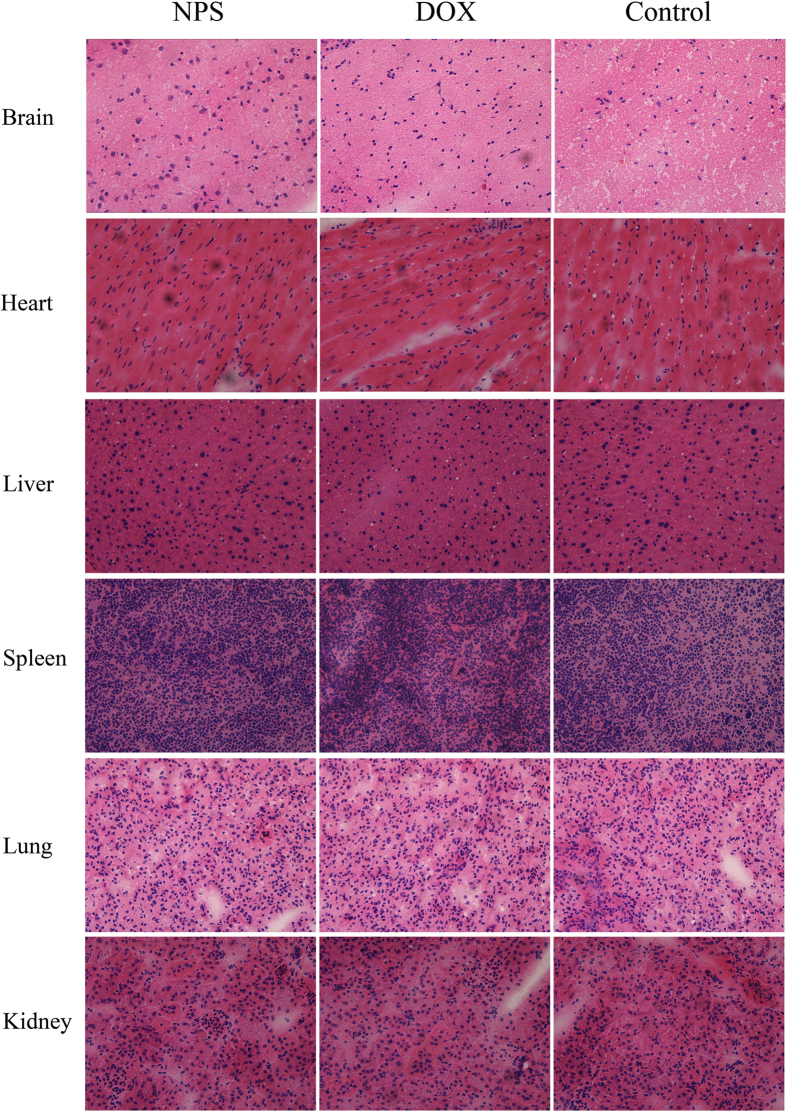
With the extensive application of doxorubicin (DOX), DOX resistance has become one of the main obstacles to the effective treatment of breast cancer. In this paper, DOX and resveratrol (RES) were co-encapsulated in a modified PLGA nanoparticle (NPS) to overcome the DOX resistance. CLSM results indicated that DOX and RES were simultaneously delivered into the nucleus of DOX-resistant human breast cancer cells by DOX/RES-loaded NPS. Consequently, DOX/RES-loaded NPS showed significant cytotoxicity on MDA-MB-231/ADR cells and MCF-7/ADR cells. Furthermore, DOX/RES-loaded NPS could overcome DOX resistance by inhibiting the expression of drug resistance-related protein such as P-gp, MRP-1 and BCRP, and induce apoptosis through down-regulating the expression of NF-κB and BCL-2. In tumor-bearing mice, DOX/RES-loaded NPS mainly delivered DOX and RES to tumor tissue. Compared with free DOX, DOX/RES-loaded NPS significantly inhibited the DOX-resistant tumor growth in tumor-bearing mice without causing significant systemic toxicity. In a word, DOX/RES-loaded NPS could overcome the DOX resistance and had the potential in the treatment of DOX-resistant breast cancer.


Figures

Figure 1
Figure 1. Characteristics of DOX-RES-loaded nanoparticles (NPS).
Panel (A) is particle size distribution of NPS measured by dynamic light scattering. Panel (B) is TEM image of NPS. Panel (C) are the changes of particle size and particle distribution index of NPS in PBS for 7 days at 37 °C, measured by dynamic light scattering. Panels (D,E) are in vitro DOX and RES release curve from DOX/RES-loaded NPS in different PBS (pH 5.0, pH6.5 and pH 7.4) at 37 °C. Data are mean ± SD. n = 3, **p < 0.01, vs pH 7.4 at 96 h. All experiments were tested for three times.
Figure 2
Figure 2
Cytotoxicity of free doxorubicin (DOX), free resveratrol (RES), mixture of free DOX and free RES (MIX) and DOX/RES-loaded nanoparticles (NPS) on the MDA-MB-231/ADR cells (panel A) and MCF-7/ADR cells (panel B) in 48 h at 37 °C. The caspase-3 activity in MDA-MB-231/ADR cells (panel C) and MCF-7/ADR cells (panel D) after cells were incubated with free DOX, free RES, MIX and NPS for 24 h. Data are mean ± SD. n = 3. *p < 0.05, **p < 0.01, vs same concentration of MIX. #p < 0.05, ##p < 0.01, vs same concentration of free DOX. &p < 0.05, &&p < 0.01, vs same concentration of RES.
Figure 3
Figure 3
The cellular uptake of DOX and RES after cells were incubated with free DOX, free RES, MIX and DOX/RES-loaded NPS at 37 °C for 4 h in MCF-7/ADR cells (panel A) and MDA-MB-231/ADR cells (panel B). 60 × oil immersion objective and 10 × ocular lens. Data are mean ± SD. n = 3. *p < 0.05, **p < 0.01, vs same concentration of MIX. #p < 0.05, ##p < 0.01, vs same concentration of free DOX. &p < 0.05, &&p < 0.01, vs same concentration of RES.
Figure 4
Figure 4. Cell cycle analysis after MDA-MB-231/ADR cells were cultured with free DOX, free RES, MIX and DOX/RES-loaded NPS for 24 h.
Panel (A) is the typical pictures of flow cytometry. Panel (B) is the statistic results of cell cycle. Panel (C) is the western blot analysis of cell cycle-related protein expression. Data are mean ± SD. n = 3, *p < 0.05, **p < 0.01, vs control or PBS.
Figure 5
Figure 5
Western blot analysis of apoptosis-related proteins expression (panel A) and drug resistance-related proteins expression (panel B) in MDA-MB-231/ADR cells after cells were treated with free DOX, free RES, MIX and DOX/RES-loaded NPS for 24 h. Data are mean ± SD. n = 3, *p < 0.05, **p < 0.01, vs PBS.
Figure 6
Figure 6
Western blot analysis of apoptosis-related proteins expression (panel A) and drug resistance-related proteins expression (panel B) in MCF-7/ADR cells after cells were treated with free DOX, free RES, MIX and DOX/RES-loaded NPS for 24 h. Data are mean ± SD, n = 3, *p < 0.05, **p < 0.01, vs PBS.
Figure 7
Figure 7
The tumor volume (panel A) and body weight (panel B) of tumor-bearing mice during period of treatment. Data are mean ± SD, n = 5.
Figure 8
Figure 8
Panel (A) is the distribution of DOX and RES in section of tumor tissue at 24 h after treatment. 20 × oil immersion objective and 10 × ocular lens. Panel (B) is the H&E staining sections of tumor tissue from tumor-bearing nude mice treated with DOX/RES-loaded NPS (10 mg DOX/kg, 30 mg RES/kg), free DOX (10 mg/kg) and normal saline. 20 × oil immersion objective and 10 × ocular lens. Panel (C) is the apoptosis-related protein and drug resistance-related protein expressed in tumor tissue. Panel (D) is the statistic results of the apoptosis-related protein and drug resistance-related protein expressed in tumor tissue. Data are mean ± SD. n = 3. *p < 0.05, **p < 0.01, vs control; #p < 0.05, ##p < 0.01, vs DOX.
Figure 9
Figure 9
Panel (A) is living image pictures of DOX distribution at 24 h after DOX/RES-loaded NPS (10 mg DOX/kg, 30 mg RES/kg) and free DOX (10 mg/kg) were administered by tailvein injection. Panel (B) is the quantitative analysis of DOX distribution after DOX/RES-loaded NPS and free DOX were administered by tail vein injection in 24 h. Panel (C) is living image pictures of DOX distribution at 12 h, 24 h and 48 h after DOX/RES-loaded NPS were administered by tailvein injection. Panel (D) is the quantitative analysis of DOX distribution after NPS were administered by tail vein injection in 12 h, 24 h and 48 h. Data are mean ± SD. n = 3, *p < 0.05, **p < 0.01, vs free DOX.
Figure 10
Figure 10
Panel (A) is living image pictures of RES distribution at 24 h after DOX/RES-loaded NPS (10 mg DOX/kg, 30 mg RES/kg) and free RES (30 mg/kg) were administered by tailvein injection. Panel (B) is the quantitative analysis of RES distribution after NPS and free RES were administered by tail vein injection in 24 h. Panel (C) is living image pictures of RES distribution at 12 h, 24 h and 48 h after NPS were administered by tailvein injection. Panel (D) is the quantitative analysis of RES distribution after DOX/RES-loaded NPS were administered by tail vein injection in 12 h, 24 h and 48 h. Data are mean ± SD. n = 3, *p < 0.05, vs free RES.
Figure 11
Figure 11. Representative H&E staining sections of the brain, heart, liver, spleen, lung and kidney from tumor-bearing mice treated with NPS (10 mg DOX/kg, 30 mg RES/kg), free DOX (10 mg/kg) and normal saline.
20 × oil immersion objective and 10 × ocular lens.

References

    1. Kathawala R. J., Gupta P., Ashby C. R. Jr. & Chen Z. S. The modulation of ABC transporter-mediated multidrug resistance in cancer: a review of the past decade. Drug Resist Updat 18, 1–17 (2015). - PubMed
    1. Greenberg R. M. ABC multidrug transporters in schistosomes and other parasitic flatworms. Parasitol Int 62, 647–653 (2013). - PMC - PubMed
    1. van de Ven R. et al.. ABC drug transporters and immunity: novel therapeutic targets in autoimmunity and cancer. J Leukoc Biol 86, 1075–1087 (2009). - PubMed
    1. Kunjachan S., Rychlik B., Storm G., Kiessling F. & Lammers T. Multidrug resistance: Physiological principles and nanomedical solutions. Adv Drug Deliv Rev 65, 1852–1865 (2013). - PMC - PubMed
    1. Mohan A., Narayanan S., Balasubramanian G., Sethuraman S. & Krishnan U. M. Dual drug loaded nanoliposomal chemotherapy: A promising strategy for treatment of head and neck squamous cell carcinoma. Eur J Pharm Biopharm 99, 73–83 (2016). - PubMed

Publication types