. 2016 Oct 27;538(7626):514-517.
doi: 10.1038/nature19841. Epub 2016 Oct 12.

Synchronous long-term oscillations in a synthetic gene circuit

Affiliations

Synchronous long-term oscillations in a synthetic gene circuit

Laurent Potvin-Trottier et al. Nature. .

Abstract

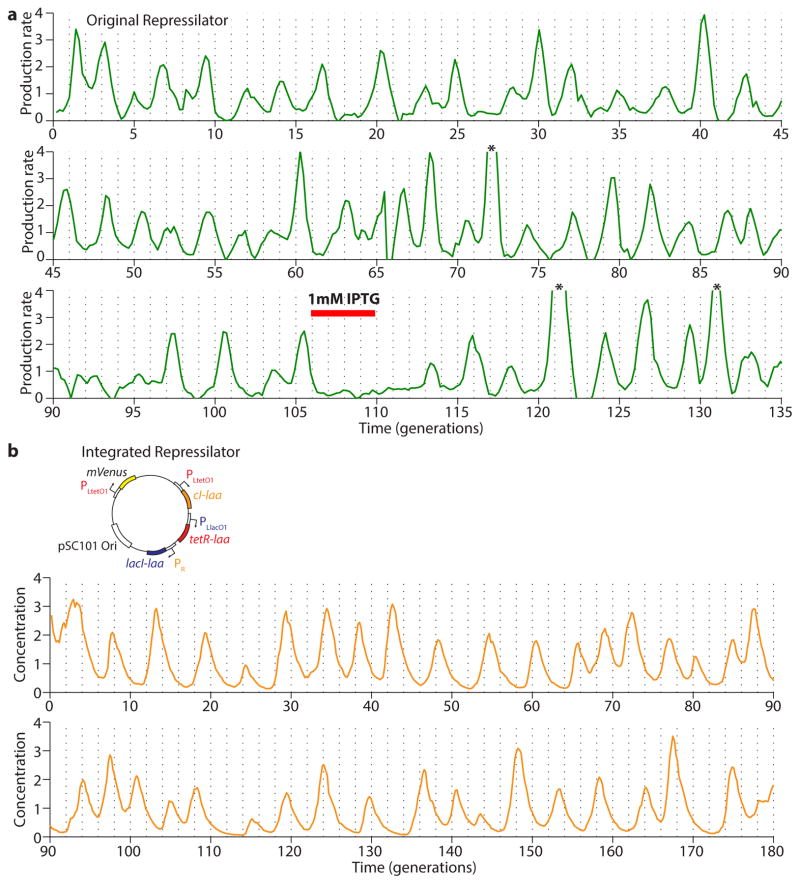
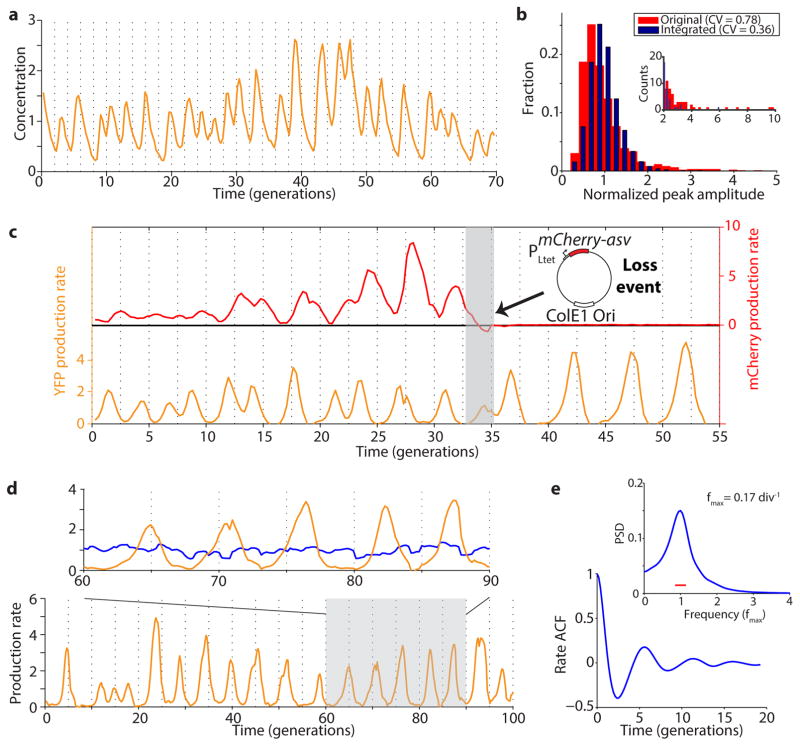
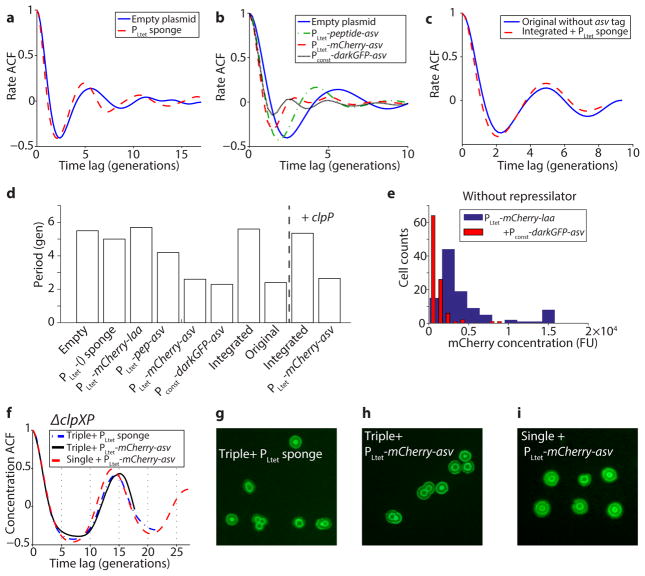
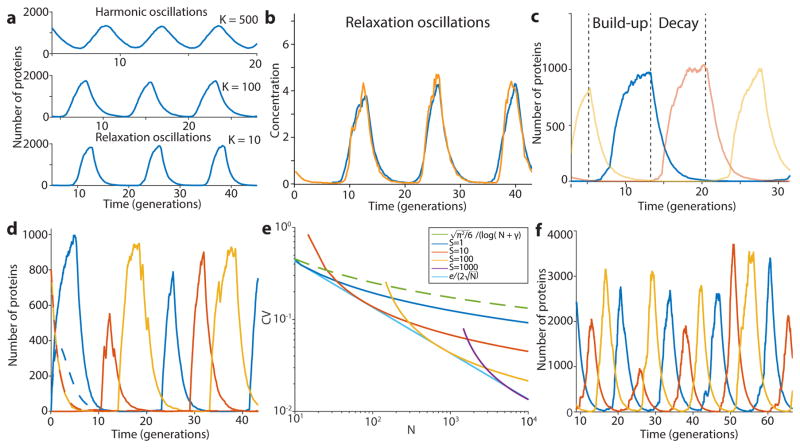
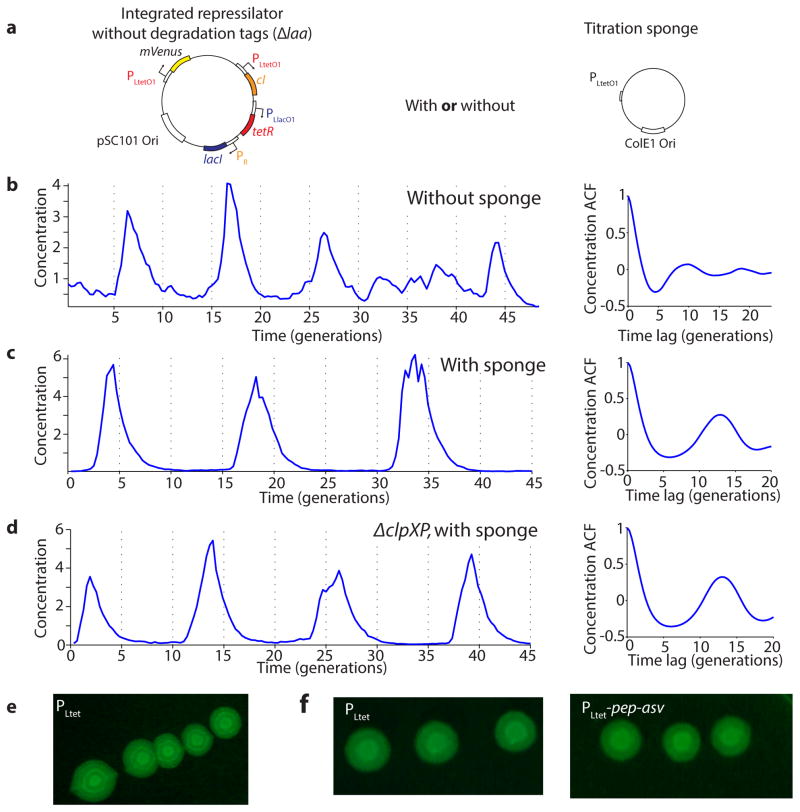
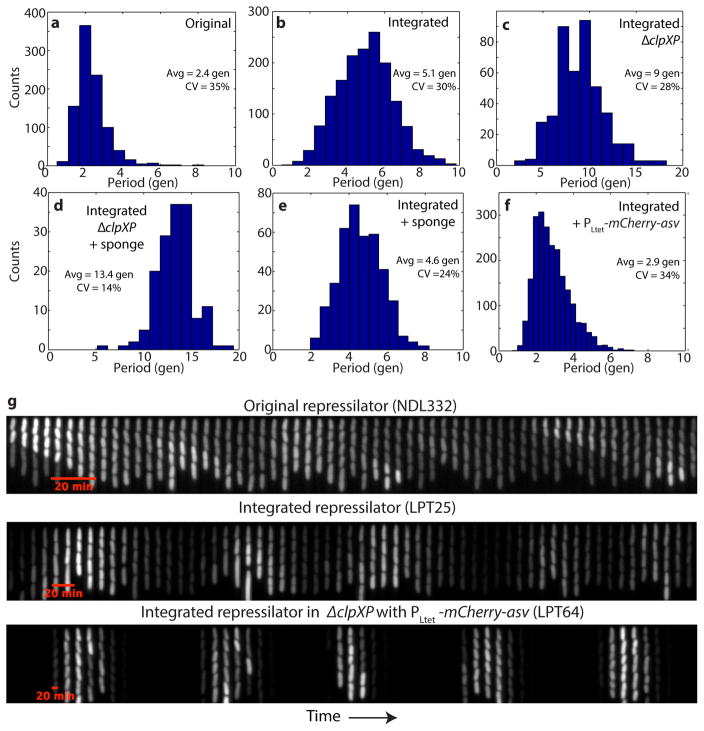
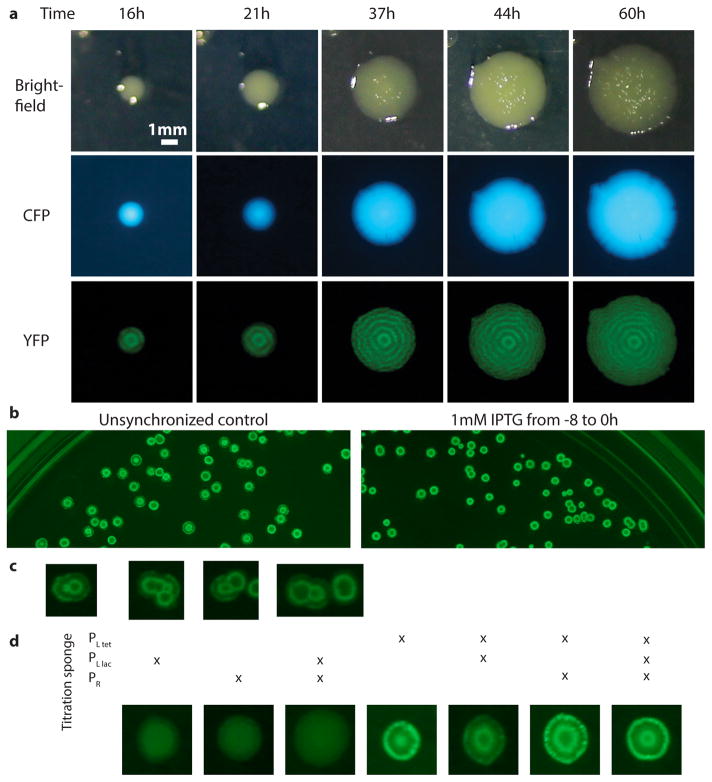
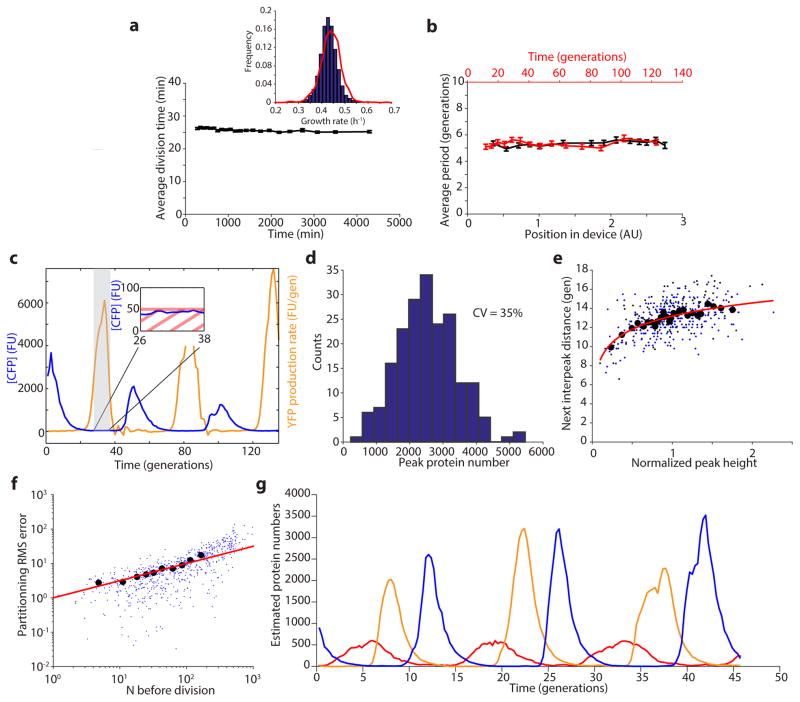
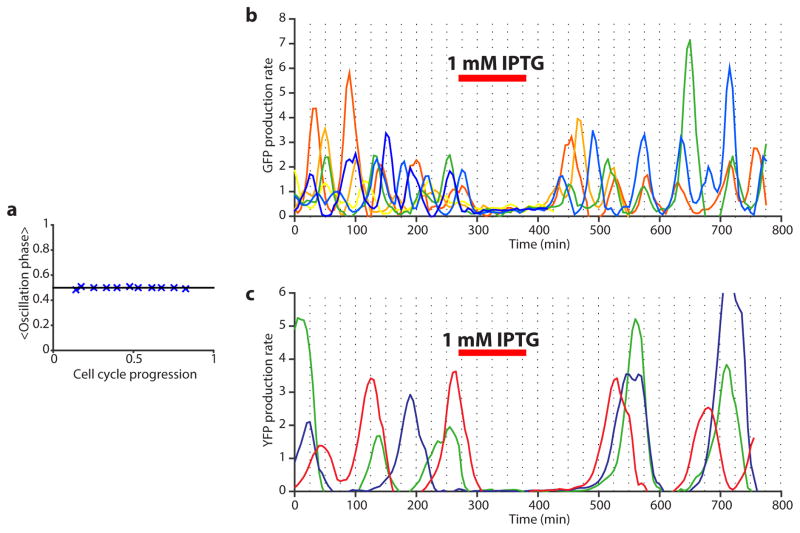
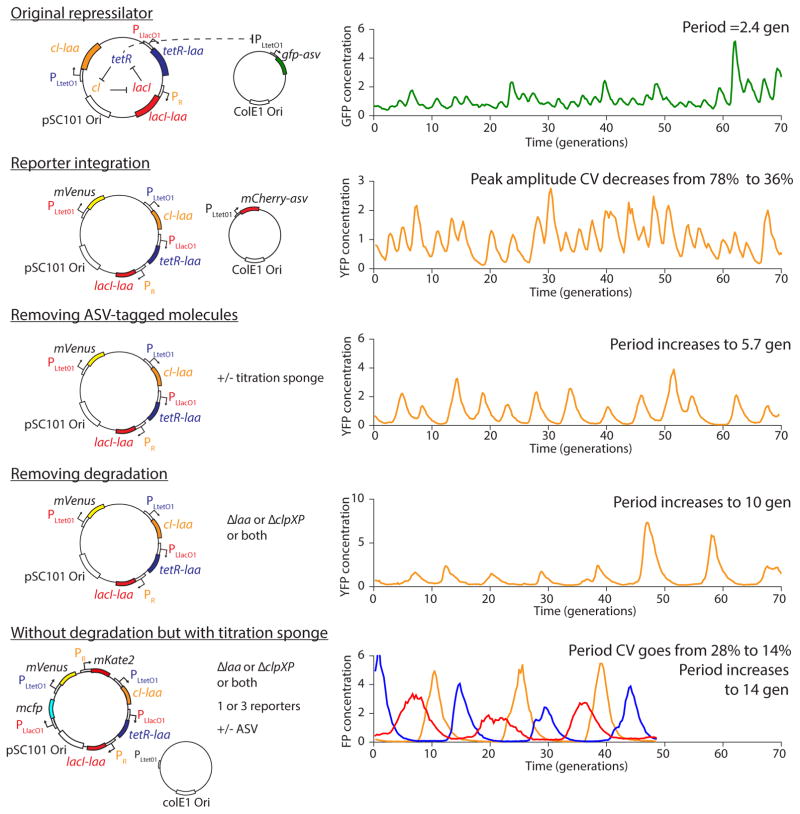
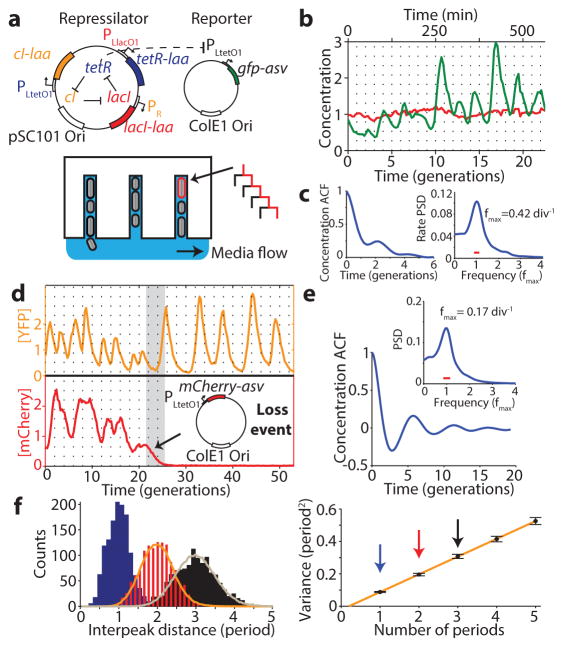
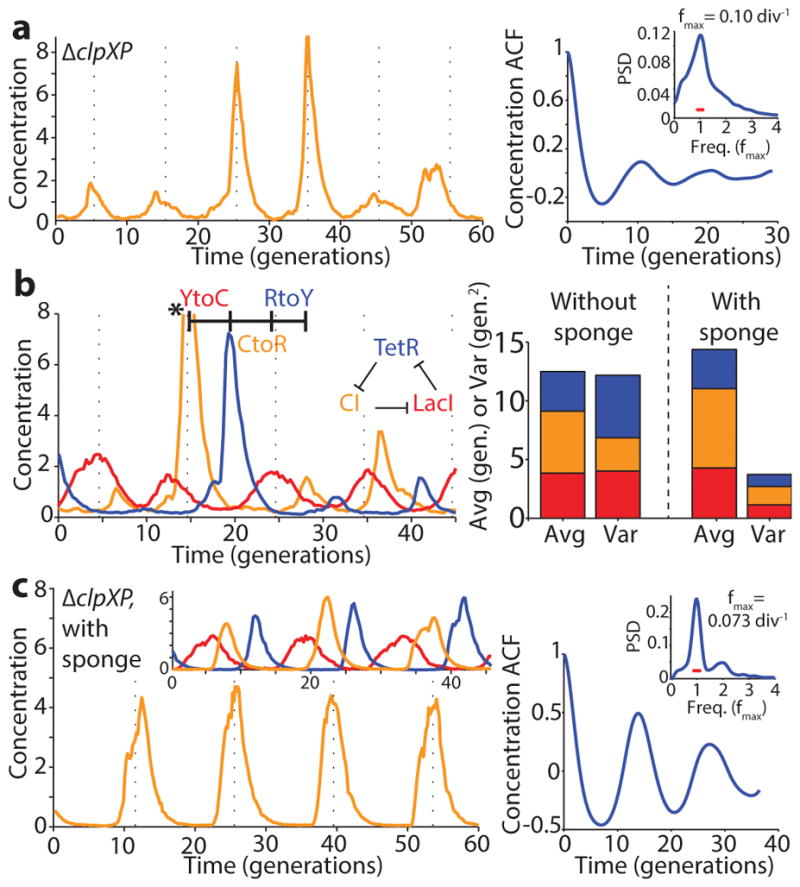
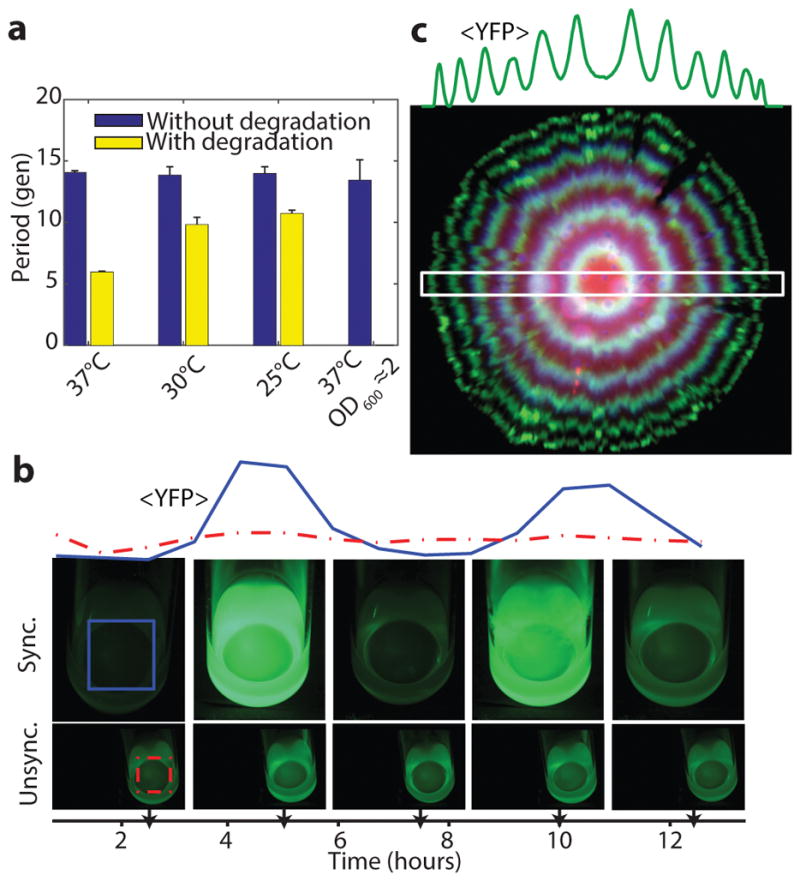
Synthetically engineered genetic circuits can perform a wide variety of tasks but are generally less accurate than natural systems. Here we revisit the first synthetic genetic oscillator, the repressilator, and modify it using principles from stochastic chemistry in single cells. Specifically, we sought to reduce error propagation and information losses, not by adding control loops, but by simply removing existing features. We show that this modification created highly regular and robust oscillations. Furthermore, some streamlined circuits kept 14 generation periods over a range of growth conditions and kept phase for hundreds of generations in single cells, allowing cells in flasks and colonies to oscillate synchronously without any coupling between them. Our results suggest that even the simplest synthetic genetic networks can achieve a precision that rivals natural systems, and emphasize the importance of noise analyses for circuit design in synthetic biology.


Conflict of interest statement

The authors declare no competing financial interests.

Figures

Extended Data Figure 1
Oscillations in the original and integrated repressilator circuits. a) Original (NDL332, GFP production rate) and b) integrated repressilator (LPT25, YFP concentration) oscillations are sustained for more than one hundred generations. The two time traces were normalized to their respective means. Three peaks in a) indicated by asterisks have been clipped due to their high amplitude (5.9, 7.1 and 4.8) to allow better visualization of the oscillations. IPTG was added to the media for the time period indicated by the red bar (in a) in order to synchronize the cells in the device.
Extended Data Figure 2
Interference from the reporter plasmid. a) Oscillations of the integrated repressilator with the PLtet-mCherry-asv plasmid (LPT54) have a more constant peak amplitude compared to the original repressilator, indicated by the CV of the peak amplitude decreasing from 0.78 to 0.36 (b). The inset in b) zooms in on the tails of the distributions. c) Additional plasmid loss event of integrated repressilator with PLtet-mCherry-asv reporter. The reporter plasmid is lost around generation 34, as evidenced by the loss of red fluorescence. The oscillation period shifts from ~2 to ~5 generations quickly after the plasmid loss event. d) Example time trace of the integrated repressilator, without the reporter plasmid (LPT25). The YFP production rate oscillates (yellow trace), while the segmentation marker (blue trace) stays relatively constant (close-up of the shaded region on top). Both traces were normalized to their respective means. e) Autocorrelation function (ACF) and power spectral density (PSD) were calculated over the whole population (8,694 total generations) and demonstrate strong oscillatory behavior, with an average period of 5.6 generations. The width of the window function used for calculating the power spectrum is indicated by a red line.
Extended Data Figure 3
Summary of results explaining the difference in period between the original and integrated repressilator. a) The PLtet sponge (LPT44) makes the oscillation slightly shorter and more regular compared to the empty plasmid (LPT45), but cannot explain the change in period. b) Increasing the expression of ‘competing’ substrates tagged with the asv tag makes the oscillations faster. The period gradually decreases from 5.5 generations for the empty plasmid (LPT45) to 4.2 with PLtet-pep-asv (LPT46), to 2.6 with PLtet-mCherry-asv (LPT54) and to 2.3 with Pconst-darkGFP-asv (LPT53). c) Removing the degradation tag on the reporter of the original repressilator (LPT60) produces oscillations very similar to the integrated repressilator with the sponge (LPT44). d) Summary of the period of the different construct presented in this figure, compared to the original (NDL332) and integrated repressilator (LPT25). Introduction of ASV-tagged molecules is sufficient to explain the change in period, whereas introduction of LAA-tagged molecules slows down the oscillations (LPT55). Overexpressing a functional ClpP-mGFPmut3 fusion makes the period slightly faster (5.4 gen, LPT159), but does not rescue the effect of the ASV-tagged proteins (2.8 gen, LPT165). e) Expressing ASV-tagged molecules in the absence of the repressilator lowers the mean abundances of ssrA-tagged molecules ~ four-fold, suggesting that presence of ASV-tagged molecules cause faster degradation rates. f) In the ΔclpXP background, the oscillations are not affected by the presence of ASV-tagged molecules or additional reporter. Triple reporter with PLtet sponge (LPT127), triple with PLtet-mCherry-asv (LPT118) and single with PLtet-mCherry-asv (LPT64) have very similar autocorrelation functions and ring patterns (g-h-i). There were slight variations in the imaging conditions due to manual focusing and non-uniformity of the LED illumination.
Extended Data Figure 4
Modeling results. a) The repressilator can display harmonic or relaxation oscillations. The gradual transition between the regimes is shown here by varying the parameter K in the minimal model (λ = 2000 and n = 4, SI §4.1). b) The experimental data suggest that the repressilator oscillates in the relaxation regime. Simulated time trace (blue, K = 13, λ = 103, and n = 3 ) is overlayed with time trace of experimental data (from Fig. 2c, LPT64, yellow). c) Close-up of a simulated time trace (minimal model, K = 0.2, λ = 103, and n = 2, SI §4.1) in the relaxation regime showing the three different repressors (blue, red and yellow). The oscillations can be separated in two distinct phases: an accumulation phase during which the protein (blue) is completely derepressed (red below threshold) and starts at very low numbers, and a decay phase that starts when the repressor is completely repressed (red above threshold) and ends when it goes below the repression threshold of the next component (yellow starts to accumulate). d) Relaxation oscillators have different parameter requirements for oscillations. Simulated time traces (solid lines) show oscillations without biochemical cooperativity or phase shift due to the presence of mRNA (minimal model, K = 0.01, λ = 103, and n = 1, SI §4.1). The deterministic differential equations with the same parameters show damped oscillations (dashed lines with flipped colors). e) Even for perfect threshold mechanism, significant noise comes from the decay phase if the threshold (S) is too low (or too high) with respect to the peak value (N). If S ≪ N, then the CV in one decay step goes down very slowly (1/log(N/(S + 1))). However, if it is reasonably close to its optimal value (e.g. 0.05 < S/N < 0.3), it goes down much faster ( 1/N). The CV is shown for different combination of S and N, as well as the asymptotic traces. f) Simulated time trace of the model of SI §4.3.1 shows oscillations of similar shape, peak amplitude numbers, period and phase drift as the experimental data by using reasonable parameters (λ = 60, K = (5, 10, 10) for the three repressors, n = 1.5 for all repressors, 〈b〉 = 10, 〈No〉 = 10 〈Nt〉 = 40).
Extended Data Figure 5
Period histograms and kymographs of selected strains. Peak-to-peak distance of the oscillations was calculated as described in Methods, and the average period, as well as the CV (standard deviation divided by the mean) are reported in the figure panels. a) Original repressilator (NDL332). b) Integrated repressilator (LPT25). c) Integrated repressilator in ΔclpXP (LPT61). d) Integrated repressilator in ΔclpXP with PLtet-mCherry-asv (LPT64). e) Integrated repressilator with PLtet sponge (LPT44). f) Integrated repressilator with PLtet-mCherry-asv (LPT54) g) Kymograph (xy-t montage) of the raw data is presented for three strains. The image of a single growth channel is presented every 1, 2 and 7 frames (5 min/frame) for the top, middle and bottom panel respectively. The oscillations in concentration are difficult to see in the fast oscillator (although clear when looking at production rate), but they can be clearly seen in the slow oscillators. The growth channels are open towards the bottom of the images, where media is supplied.
Extended Data Figure 6
Oscillations of the repressilator without degradation tags. a) Schematic of integrated repressilator without degradation tags, with or without the PLtet titration sponge. b) Without the titration sponge (LPT120), the oscillations are erratic in amplitude, with a correlation coefficient of ~0.1 after one period. c) Addition of the sponge (LPT124) makes the oscillations much more regular, with a correlation coefficient of ~0.25 after one period. d) Time trace and autocorrelation of integrated repressilator without degradation tags in ΔclpXP (LPT128). Introduction of the mutation did not change the oscillations substantially (compared to c). e) The colonies of integrated repressilator without degradation tags with PLtet sponge (LPT124) exhibit spatio-temporal ring patterns in the YFP images. f) Close-up of the colonies show that the spatio-temporal patterns were similar if the titration sponge contained only the promoter (LPT124) or expressed an ASV-tagged peptide (LPT125), suggesting that these strains have similar oscillations.
Extended Data Figure 7
Macroscopic spatial patterns of the repressilator. a) Time course growth of a single colony grown from a ΔclpXP mutant cell containing the integrated repressilator and titration sponge (LPT64, PLtet-mCherry-asv). Oscillations in YFP levels produce macroscopic, ringed structures in the YFP channel (bottom row), while such patterns are absent in the constitutive segmentation marker (CFP, middle row) and gross colony morphology (bright field, top row). The bottom and left white spots in the brightfield images are reflections from the white LEDs. b) On the left, unsynchronized cells were plated and different phases of the oscillators are represented by different ring patterns (dark or bright center of different sizes). Synchronization of the cells with IPTG makes the patterns similar, with a dark center of the same size. c) The ring patterns do not synchronize when adjacent colonies merge into each other. d) Only the presence of the PLtet sponge is required for macroscopic oscillations, while titration of the other repressors do not affect greatly the oscillations. From left to right: LPT153, LPT154, LPT157, LPT143, LPT155, LPT156 and LPT152. Several strains were also evaluated in the microfluidic device.
Extended Data Figure 8
Characterization of the microfluidic device and of the oscillations. a) The average division time of the integrated repressilator (LPT25) is constant over time. The inset shows the distribution of growth rates of two independent experiments (45,828 and 9,135 points are shown in the blue and red distributions, respectively), with a slight difference in the mean (~ 1%). b) The period of the oscillations is constant in space (position in field of view, distance to inlets and outlets and different media channels) and time. Each point represents a bin of 400 (a) or 100 (b) points, with the error bars indicating standard error of the mean. c) The induction/repression switch of CI (reported by YFP) occurs when the transcriptional reporter for TetR (CFP) is below the detection limit. Typical time trace of multireporter repressilator without repressor degradation and with PLtet-peptide-asv plasmid (ΔclpXP, LPT117). The production rate of YFP is shown alongside the CFP concentration. The inset shows that the switch from induction to repression occurs below the detection limit of ~ 50 FU. d) The distribution of peak amplitude of the repressilator without degradation but with titration sponge shows significant heterogeneity (LPT64, CV of 35%). e) The peak amplitude has a small influence on the next period, due to exponential dilution. The red line shows a fit to y = 1.99 * log(x)+13.18 and explains 25% of the variance in the periods. Black circles are bins of 15 points of black dots (LPT64) and blue dots (LPT156). f) Estimating partitioning root mean squared (RMS) errors at cell division during the dilution phase showed that it scaled binomially, and allowed us to roughly estimate a fluorescence units to protein scaling factor. Black circles are bins of 50 blue dots (LPT64). The red line shows the fit (after conversion) to (n1-n2)2=N, where ni is the number of proteins in the daughters right after division, and N = n1 + n2 the number in the mother cell. g) Typical time trace of triple reporter repressilator without degradation with titration sponge (LPT127) in estimated protein numbers (concentration × average cell size).
Extended Data Figure 9
Robustness and synchronization of the oscillations. a) The phase of the oscillations is independent of the phase of the cell cycle. The average phase of the oscillation phase is shown as a function of the position in the cell cycle. Each point represents a bin of 3,000 data points, which have been average in x and y after being sorted on their x values. The error bars represent standard error on the mean and are of similar size to the symbols. Similar results were obtained for different strains, but here are shown for the integrated repressilator (LPT25). b) Synchronization of different cells in the microfluidic device was done by introducing 1mM IPTG. The original repressilator (NDL332) shows a modest level of synchrony in the oscillations of the GFP production rate. c) The integrated repressilator shows a more robust synchronization in the YFP production rates, but takes more time to recover from the pertubation.
Extended Data Figure 10
Schematic of the major changes to the repressilator and resulting effects on the oscillations. The original repressilator displays sustained oscillation with a period of 2.4 generations, albeit with a variable amplitude. Integrating the reporter on the pSC101 plasmid decreases the peak amplitude CV from 78% to 36%. Then, removing the presence of ASV-tagged molecules increases the period to 5.7 generations, due to the interference with degradation of the repressors in the former case. Removing degradation entirely increases the period to 10 generations, but significant amplitude and phase drift subsist. Reintroducing a sponge of binding site for the TetR repressors raises the repression threshold and enables the repressilator to exhibit precise oscillations (as well as macroscopic oscillations), by decreasing the period CV from 28% to 14% and increasing the period to 14 generations. Typical time traces are shown from top to bottom of NDL332, LPT54, LPT25, LPT61 and LPT127.
Figure 1
Figure 1
Reducing reporter interference. a) Schematics of the original repressilator plasmids as described in text and microfluidic device where E. coli cells are diffusively fed in growth channels and daughters eventually are washed away. b) Typical time trace of a single cell for original repressilator (NDL332). The GFP concentration (green trace) oscillates noisily while a constantly expressed RFP (red trace) stays constant. Both traces were normalized to their means. c) Autocorrelation functions (ACF) and power spectral densities (PSD) were calculated over the whole population (2,706 generations) and demonstrate oscillations with a mean period of 2.4 average division time. d) Top: oscillations are more regular when the reporter is expressed on the repressilator plasmid rather than on a separate high-copy plasmid (Extended Data Fig. 2). Some cells irreversible shift period from ~2.5 to ~5.5 generations. Bottom: The period change was invariably connected to a loss of the separate mCherry-ASV-expressing reporter plasmid. Analysis of e.g. empty plasmid vectors, various reporter proteins and reporter degradation tags, and circuits with and without repressor degradation (SI §3.1 and 3.3) show that the interference was caused by the reporter ssrA degradation tag where the last three amino acids were substituted to ASV. e) ACF and PSD for the YFP expressing repressilator without separate reporter plasmid (LPT25), calculated over all 8,694 total cell divisions observed. Average period was 5.6 generations. Reporter protein close to fluorescence detection limit at troughs, and the actively degraded repressors should be much lower yet. The PSD was normalized by peak frequency, with width of the window function indicated by red line. f) Histograms of interpeak distances for one, two and three periods in blue, red and black respectively. Orange and grey lines were obtained by summing two or three samples (respectively) from the blue distribution. Consecutive periods are thus independent. Panel on right shows that the variance in period grows linearly with the number of periods elapsed (LPT25).
Figure 2
Figure 2
Identifying and eliminating inherent sources of error. a) Typical time trace in ΔclpXP cells (LPT61) where repressors are not degraded. ACF and PSD calculated over 5,356 cell divisions. The average period was 10 generations, and the correlation coefficient was 0.1. Dashed vertical lines are separated by an average period to illustrate periodicity in a–c. b) (Left) Time trace of multi-reporter repressilator (ΔclpXP, LPT113). TetR represses the production of YFP (yellow trace), LacI inhibits the production of CFP (blue trace) and CI represses the production of RFP (red trace). Peak indicated by asterisk not shown due to its high amplitude of 11.5 units. (Right) Interpeak distances evaluated for YFP to CFP (YtoC, red), CFP to RFP (CtoR, yellow) and RFP to YFP (RtoY, blue) without (LPT113, n = 163, 150 and 173) and with the titration sponge (plasmid with PLtet binding sites, LPT117 and LPT127, combined, n = 109, 86 and 116). Respective contributions to the average and variance shown by bar plot. The RtoY part of the oscillation (induction of YFP, low TetR levels) represents 27% of the period, but contributes 44% of the variance. Addition of the PLtet titration sponge brings down the variance almost fourfold. c) Example time trace of single reporter repressilator with PLtet-mCherry-asvclpXP, LPT64), along with ACF and PSD calculated over 3,695 generations. Oscillations have an average period of 14 generations and a correlation coefficient of 0.5 after one period. Inset shows a time trace from the triple reporter repressilator without degradation and with titration sponge (LPT127, color scheme as in b).
Figure 3
Figure 3
The modified repressilator shows great robustness to growth conditions. a) The repressilator without degradation and with titration sponge (LPT64) has a period of 14 generations at different temperatures (blue bars, division time of 27, 40 and 59 min for 37°C, 30°C and 25°C respectively) and in conditioned media (OD600 ~2, doubling time of 44 min). Repressilator with repressor degradation (LPT25) shows a varying period (yellow bars, doubling time of 26, 34 and 52 min for 37°C, 30°C and 25°C respectively). Error bars indicate STD on the first maximum of the ACF obtained by bootstrapping. b) Cells containing multi-reporter repressilator without repressor degradation and with PLtet-peptide-asv plasmid (ΔclpXP, LPT117) were grown in liquid culture in 25mL flasks. After the culture was initially synchronized with IPTG, it was kept in exponential phase via dilution. Average YFP intensity shown for colored square area, with unsychronized culture for comparison. c) A ~5 mm diameter colony of cells with the triple reporter repressilator (LPT117) reveals tree-like ring patterns in FP levels. The average YFP intensity is reported for the slice in the white rectangle. The decrease in RFP levels towards the edge of the colony is likely due to different response to stationary phase of its promoter.

Comment in

References

    1. Elowitz MB, Leibler S. A synthetic oscillatory network of transcriptional regulators. Nature. 2000;403:335–338. - PubMed
    1. Nakajima M, et al. Reconstitution of Circadian Oscillation of Cyanobacterial KaiC Phosphorylation in Vitro. Science. 2005;308:414–415. - PubMed
    1. Teng SW, Mukherji S, Moffitt JR, de Buyl S, O’Shea EK. Robust circadian oscillations in growing cyanobacteria require transcriptional feedback. Science. 2013;340:737–40. - PMC - PubMed
    1. Mihalcescu I, Hsing W, Leibler S. Resilient circadian oscillator revealed in individual cyanobacteria. Nature. 2004;430:81–85. - PubMed
    1. Chabot JR, Pedraza JM, Luitel P, van Oudenaarden A. Stochastic gene expression out-of-steady-state in the cyanobacterial circadian clock. Nature. 2007;450:1249–1252. - PubMed

Publication types

MeSH terms