. 2016 Oct 11;24(4):616-626.
doi: 10.1016/j.cmet.2016.09.007.

Single-Cell Mass Cytometry Analysis of the Human Endocrine Pancreas

Affiliations

Single-Cell Mass Cytometry Analysis of the Human Endocrine Pancreas

Yue J Wang et al. Cell Metab. .

Abstract

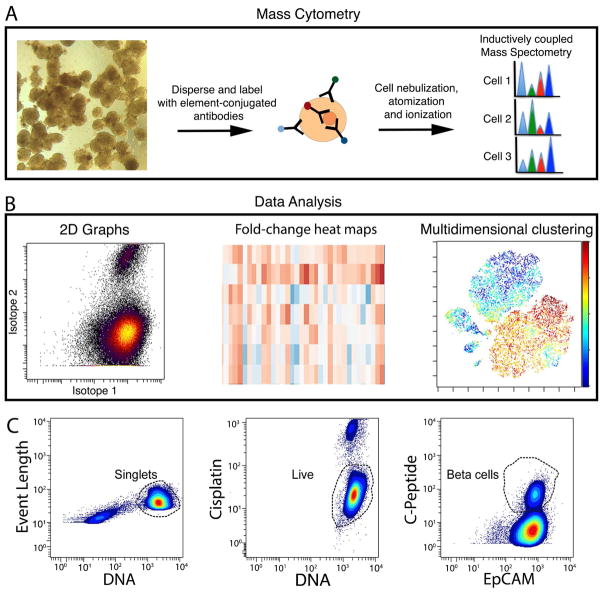
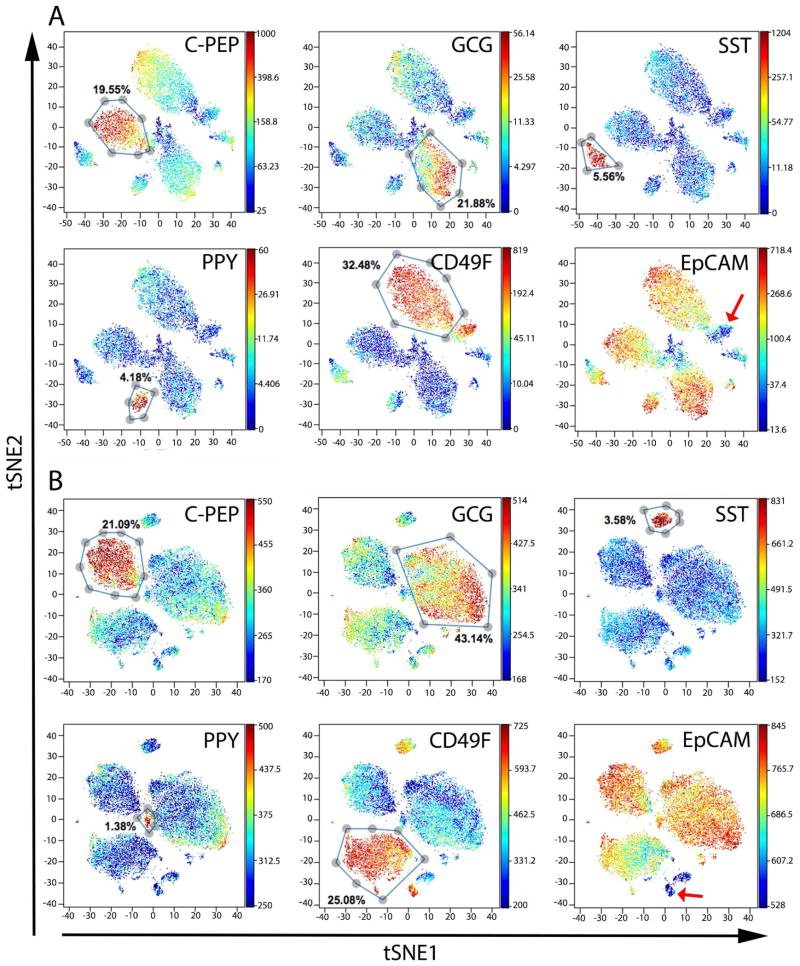
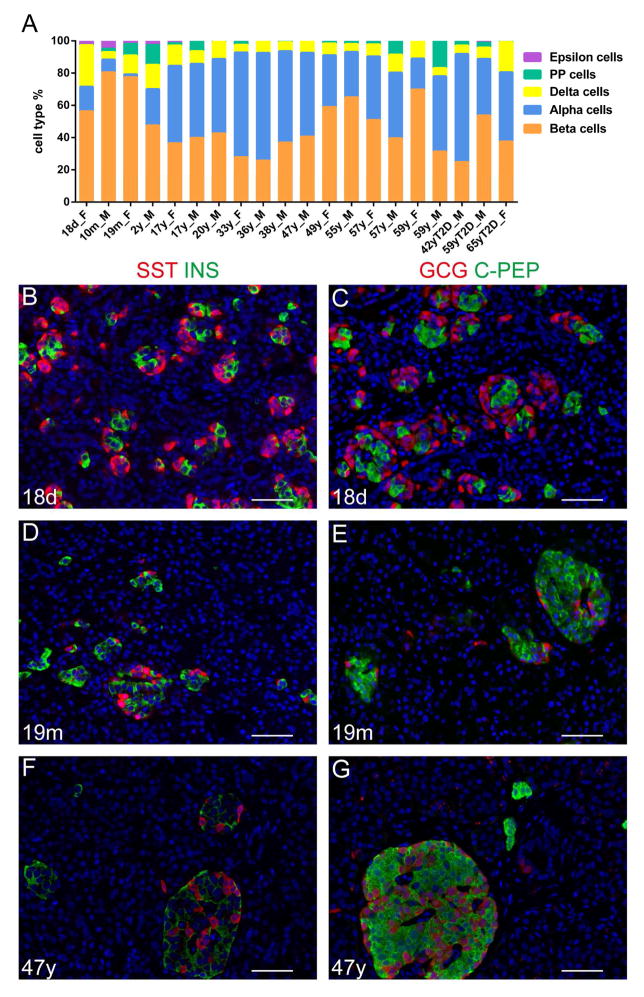
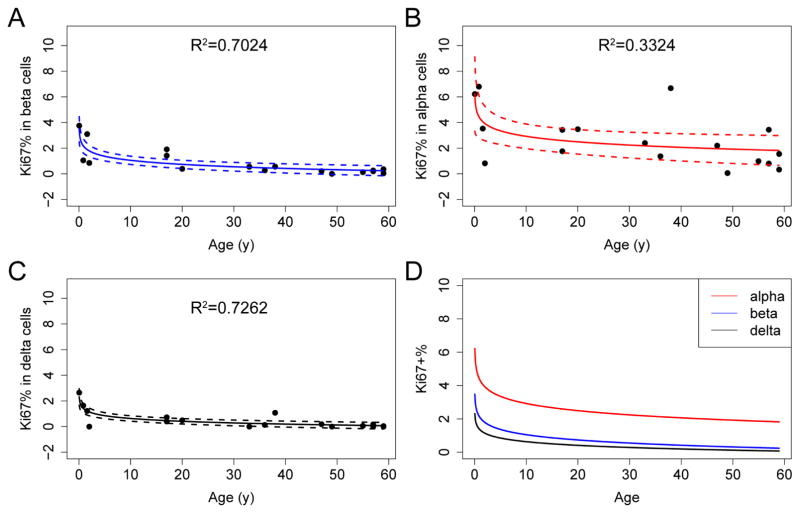
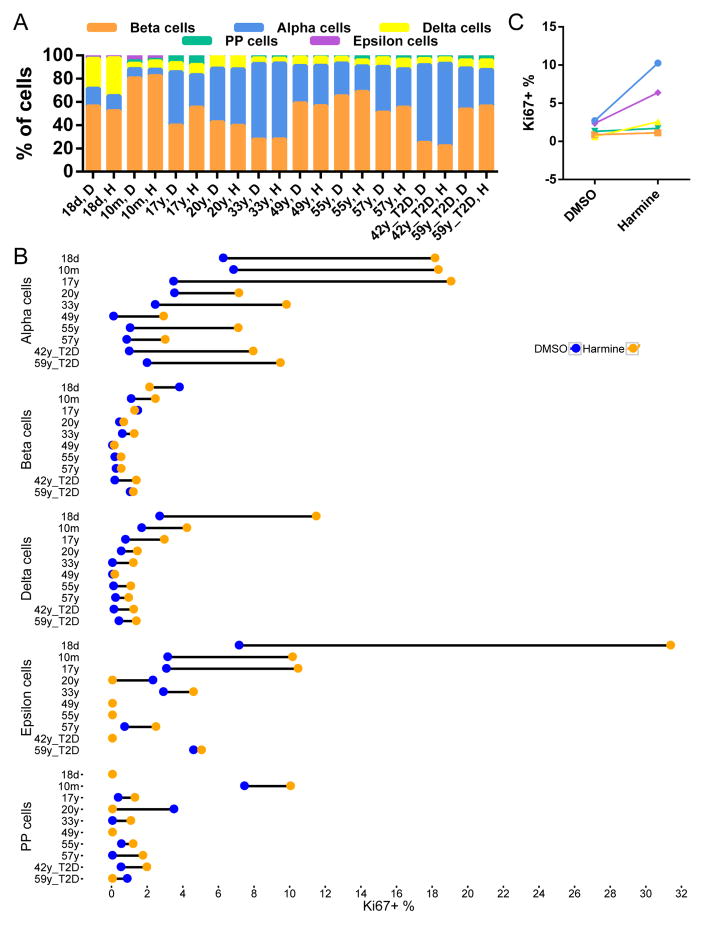
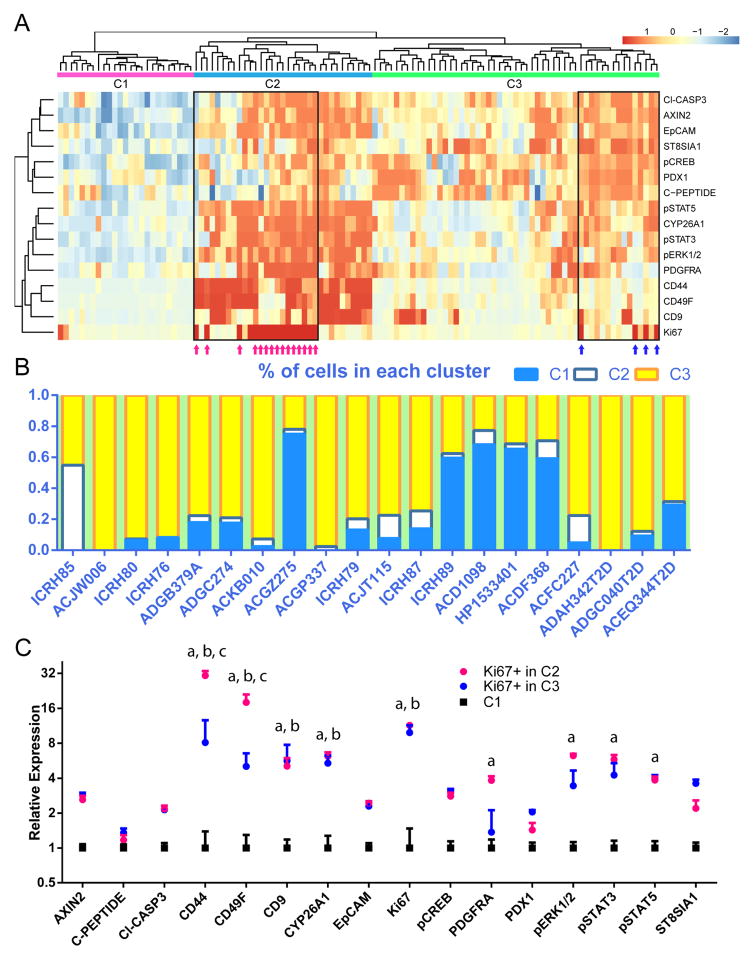
The human endocrine pancreas consists of multiple cell types and plays a critical role in glucose homeostasis. Here, we apply mass cytometry technology to measure all major islet hormones, proliferative markers, and readouts of signaling pathways involved in proliferation at single-cell resolution. Using this innovative technology, we simultaneously examined baseline proliferation levels of all endocrine cell types from birth through adulthood, as well as in response to the mitogen harmine. High-dimensional analysis of our marker protein expression revealed three major clusters of beta cells within individuals. Proliferating beta cells are confined to two of the clusters.


Figures

Figure 1
Figure 1. Overview of experimental procedure
(A) Workflow for sample processing and data analysis. Whole islets were dispersed and labeled with metal conjugated antibodies before loading onto a CyTOF2 instrument. Following nebulization, atomization and ionization, the abundance of different metal-conjugated antibodies within each cell was determined. (B) 2-D biaxial plots, hierarchical clustering, and t-SNE dimension reduction algorithm were employed in downstream data analysis. (C) All events were gated first on singlets, according to DNA content and event length (left). Subsequently, live cells were gated based on cisplatin exclusion (middle). After gating, individual channels were visualized in biaxial plots. An example of C-PEPTIDE versus EpCAM is shown (right). See Table S1 for antibodies used in the current study and Table S2 for antibodies that failed quality control. See Figure S1 for antibody validation and Figure S2A for biaxial plots of individual antibody channel.
Figure 2
Figure 2. viSNE maps show distinct clusters representing different cell types
t-SNE analysis was performed with all antibody markers used in our experiments. Each dot in the viSNE map represents an individual cell. In all panels, the same viSNE map is shown, colored sequentially by the labeling intensity of C-PEPTIDE (C-PEP, beta cells), GLUCAGON (GCG, alpha cells), SOMATOSTATIN (SST, delta cells), POLYPEPTIDE (PPY, PP cells), CD49F, and EpCAM antibodies. Representative data from two normal adult donors are shown. (A) ACD1098 and (B) ACGZ275. See also Figure S2B for viSNE maps colored by each of the 24 antibodies; Figure S3 for barcoding experiments demonstrating sample-to-sample variation and Figure S4 for biaxial plots of EpCAM and CD49F from all donors. See Table S3 for donor information.
Figure 3
Figure 3. Mass cytometry facilitates quantitative determination of human islet cell-type composition
(A) Percentage of different endocrine cell types in 20 donors. Donor ages range from 18 days to 65 years of age. Donor gender is indicated by F (female) or M (male). The three diabetic donors are designated as “T2D”. Endocrine cell percentage is listed as total of endocrine cells. (B–G) Representative images from immuno-labeling of SOMATOSTATIN (SST, red) and INSULIN (INS, green) (B, D, and F) or GLUCAGON (GCG, red) and C-PEPTIDE (C-PEP, green) (C, E, and B) in the 18-day (B, C), 19 month (D, E), and 47-year old (F, G) donors. See Table S4 for percentage of endocrine populations in each donor.
Figure 4
Figure 4. Mass cytometry permits the precise and simultaneous assessment of the proliferation index for different endocrine cell types
(A–C) The percentage of Ki67-positive endocrine cells declines with age in all major endocrine lineages. Each dot represents an individual donor. Regression lines and confidence intervals are also shown. Regression is performed with the linear regression command in R, with the model of (Percentage of Ki67+ cells) ~ log (Age). R2 is shown in each panel. (D) Overlay of regression curves of Ki67 indexes for alpha (red), beta (blue), and delta (black) cells. See Figure S5 for correlation between Ki67 and IdU signals in CyTOF. See Table S5 for quantification of Ki67+ cells in each cell type for each donor.
Figure 5
Figure 5. Alpha cells exhibit a higher baseline replication and are more responsive to the proliferation stimulus harmine than other endocrine cells throughout life
(A) Harmine treatment does not alter the cell-type percentage. (B) Proliferation in individual donors’ endocrine cells with and without harmine treatment. For each donor, the proliferation rate of baseline (DMSO, blue) and harmine treated cells (Harmine, orange) are connected by dumbbell. (C) Summary of effect of harmine. Each dot represents the mean percentage of proliferating cells from all donors. Different endocrine populations are color-coded as in (A). Alpha cells show a significantly higher response to harmine than beta, delta and PP cells (two-way ANOVA with Tukey’s correction). See Figure S6 for representative dot plots demonstrating the response of individual endocrine populations to harmine treatment. See Table S6 for quantification of Ki67+ cells for each donor.
Figure 6
Figure 6. Beta-cells contain multiple subtypes, with proliferating cells concentrated within one cluster
(A) viSNE map displaying subgroups within beta-cells. All antibody channels except non-beta hormone markers were used for t-SNE computing. Colors indicate density of cells. Subgroups were manually gated based on natural occurring groups revealed by different density center. A graph from one representative donor (ADGB379A) is shown. (B) The same viSNE map is shown as in (A), but individual cells are depicted and colored by Ki67 expression level. Red arrows indicate the cluster of Ki67+ cells. See also Figure S7.
Figure 7
Figure 7. Three main clusters of beta-cells are observed from multiple donors, and cells with relatively high levels of Ki67 separate into two of the clusters
(A) Hierarchical clustering of groups of beta cells from all donors reveal three major clusters, labelled C1, C2 and C3. Ki67+ cells separate into two groups, co-segregating either with C2 or C3 clusters (magenta and blue arrows within black box). Each column of the heatmap represents one subgroup from viSNE map (an example of which is shown in Figure 6(A)), with the addition of populations of Ki67+ beta cells gated directly from individual donor. Each row of the heatmap represents the relative expression level of one protein. 16 antibody channels are utilized in samples from all donors. (B) Census of the percentage of cells in each cluster from individual donors, ordered by age. T2D samples are shown on the right. (C) Expression levels of the 16 proteins from cells in C1, Ki67+ cells in C2, and Ki67+ cells in C3. Each data point represents mean expression + standard error of one of the three populations, normalized to C1. a, b, and c indicate significance as calculated by a two-way ANOVA test with Tukey’s correction. a: comparison between C1 and Ki67+ in C2. b: comparison between C2 and Ki67+ in C3. c: comparison between Ki67+ in C2 and Ki67+ in C3. See also Figure S7 for each cluster mapped back onto a viSNE plot.

References

    1. Amir el AD, Davis KL, Tadmor MD, Simonds EF, Levine JH, Bendall SC, Shenfeld DK, Krishnaswamy S, Nolan GP, Pe’er D. viSNE enables visualization of high dimensional single-cell data and reveals phenotypic heterogeneity of leukemia. Nature biotechnology. 2013;31:545–552. - PMC - PubMed
    1. Andralojc KM, Mercalli A, Nowak KW, Albarello L, Calcagno R, Luzi L, Bonifacio E, Doglioni C, Piemonti L. Ghrelin-producing epsilon cells in the developing and adult human pancreas. Diabetologia. 2009;52:486–493. - PubMed
    1. Atkinson MA, von Herrath M, Powers AC, Clare-Salzler M. Current concepts on the pathogenesis of type 1 diabetes--considerations for attempts to prevent and reverse the disease. Diabetes care. 2015;38:979–988. - PMC - PubMed
    1. Balcazar N, Sathyamurthy A, Elghazi L, Gould A, Weiss A, Shiojima I, Walsh K, Bernal-Mizrachi E. mTORC1 activation regulates beta-cell mass and proliferation by modulation of cyclin D2 synthesis and stability. The Journal of biological chemistry. 2009;284:7832–7842. - PMC - PubMed
    1. Bandura DR, Baranov VI, Ornatsky OI, Antonov A, Kinach R, Lou X, Pavlov S, Vorobiev S, Dick JE, Tanner SD. Mass cytometry: technique for real time single cell multitarget immunoassay based on inductively coupled plasma time-of-flight mass spectrometry. Analytical chemistry. 2009;81:6813–6822. - PubMed

Publication types

MeSH terms