. 2016 Oct 11;17(3):821-836.
doi: 10.1016/j.celrep.2016.09.045.

Addiction to Coupling of the Warburg Effect with Glutamine Catabolism in Cancer Cells

Affiliations

Addiction to Coupling of the Warburg Effect with Glutamine Catabolism in Cancer Cells

Bradley Smith et al. Cell Rep. .

Abstract

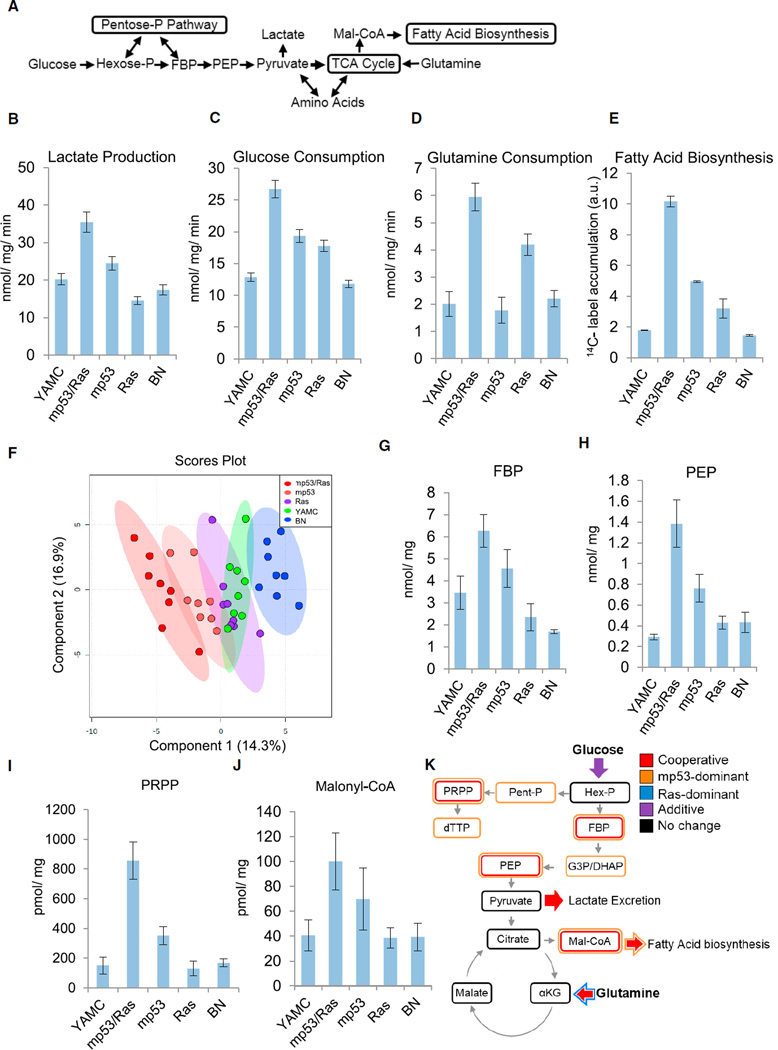
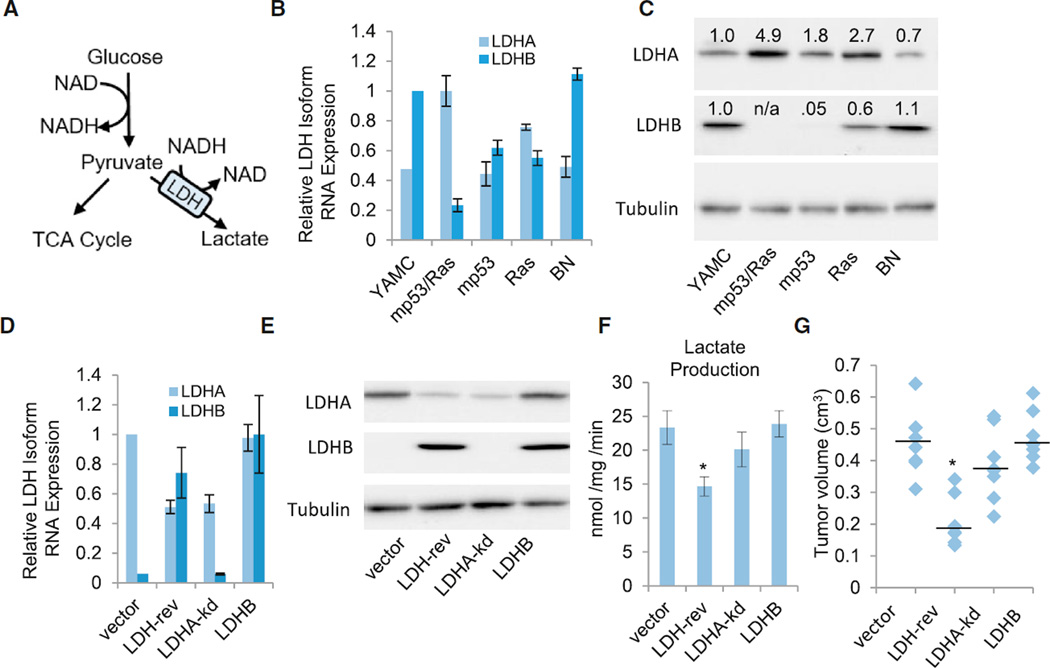
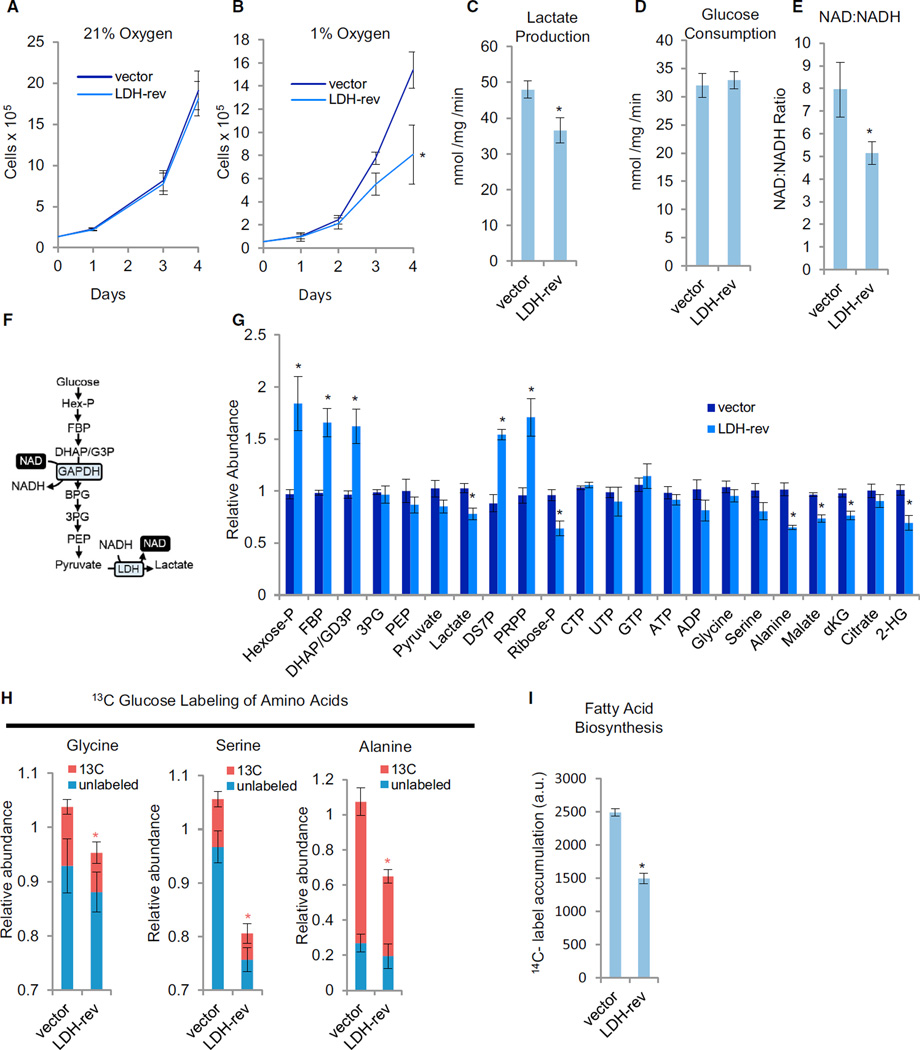
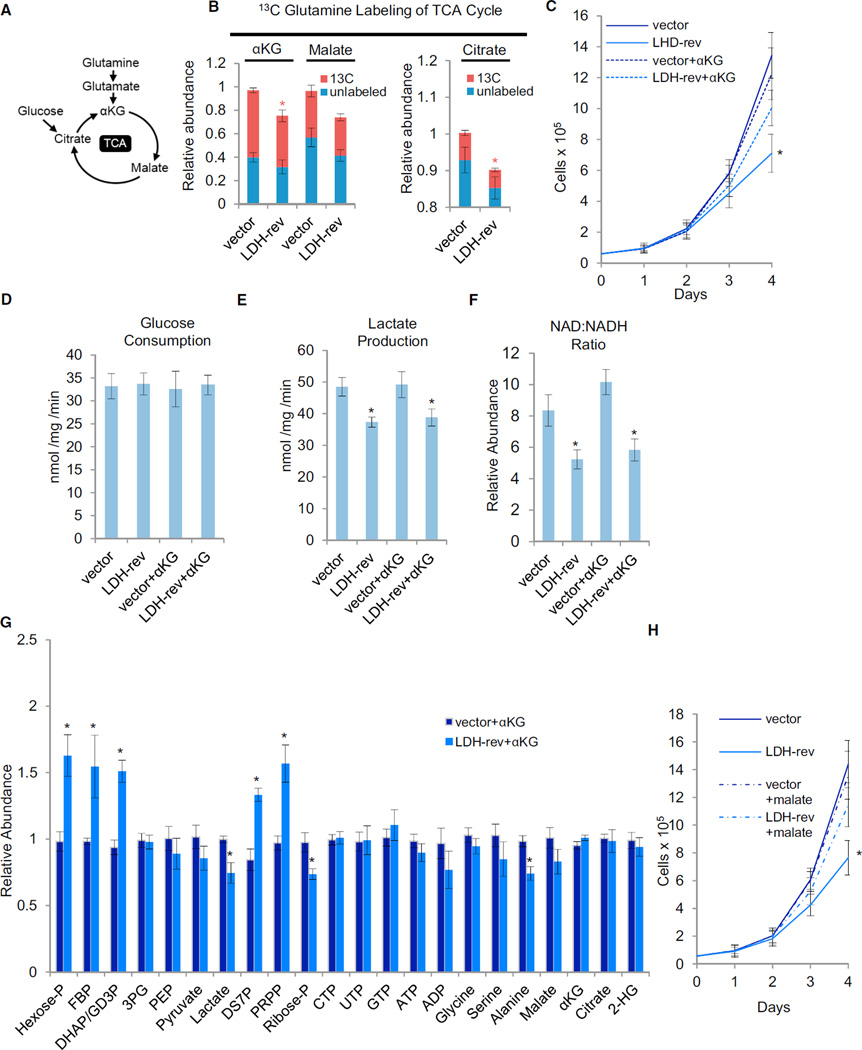
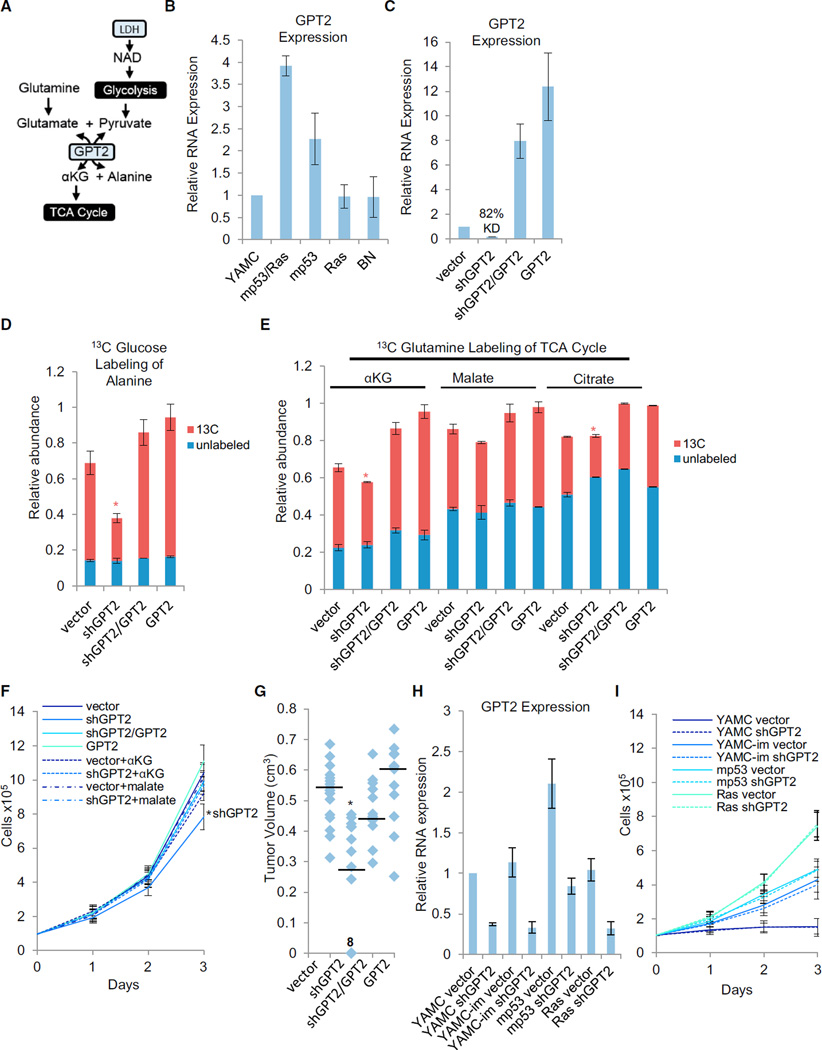
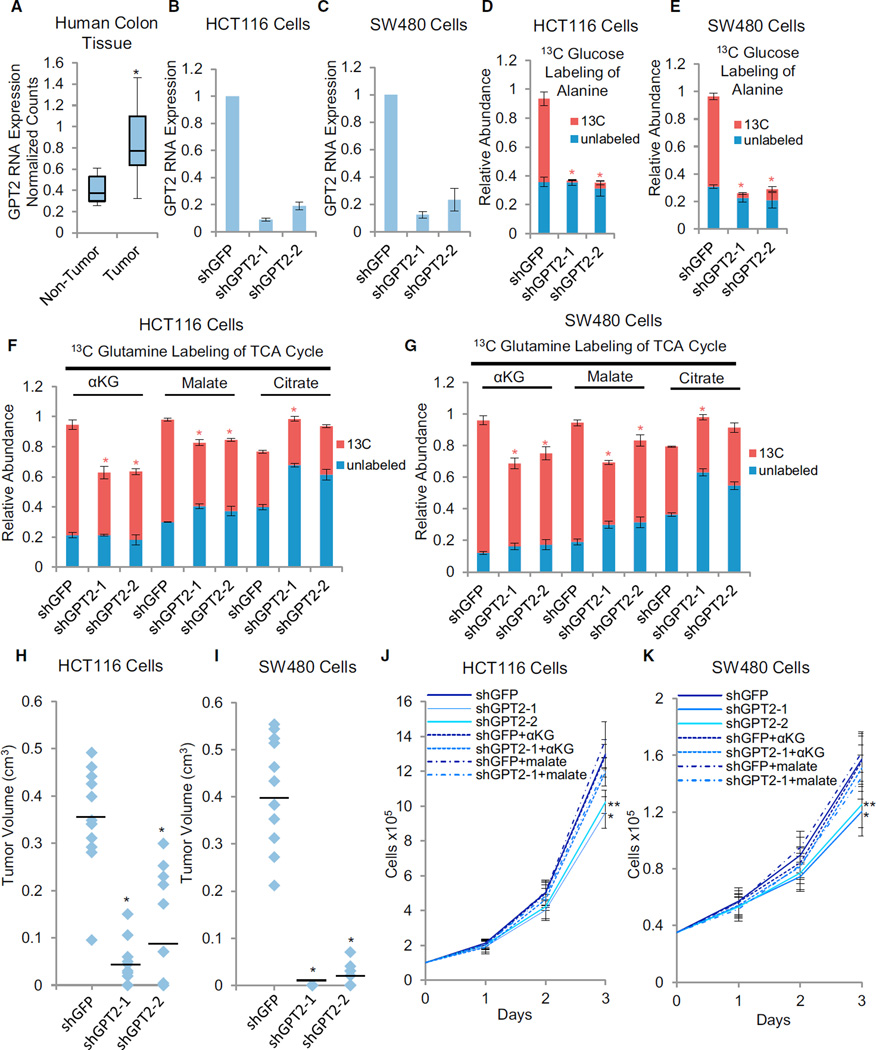
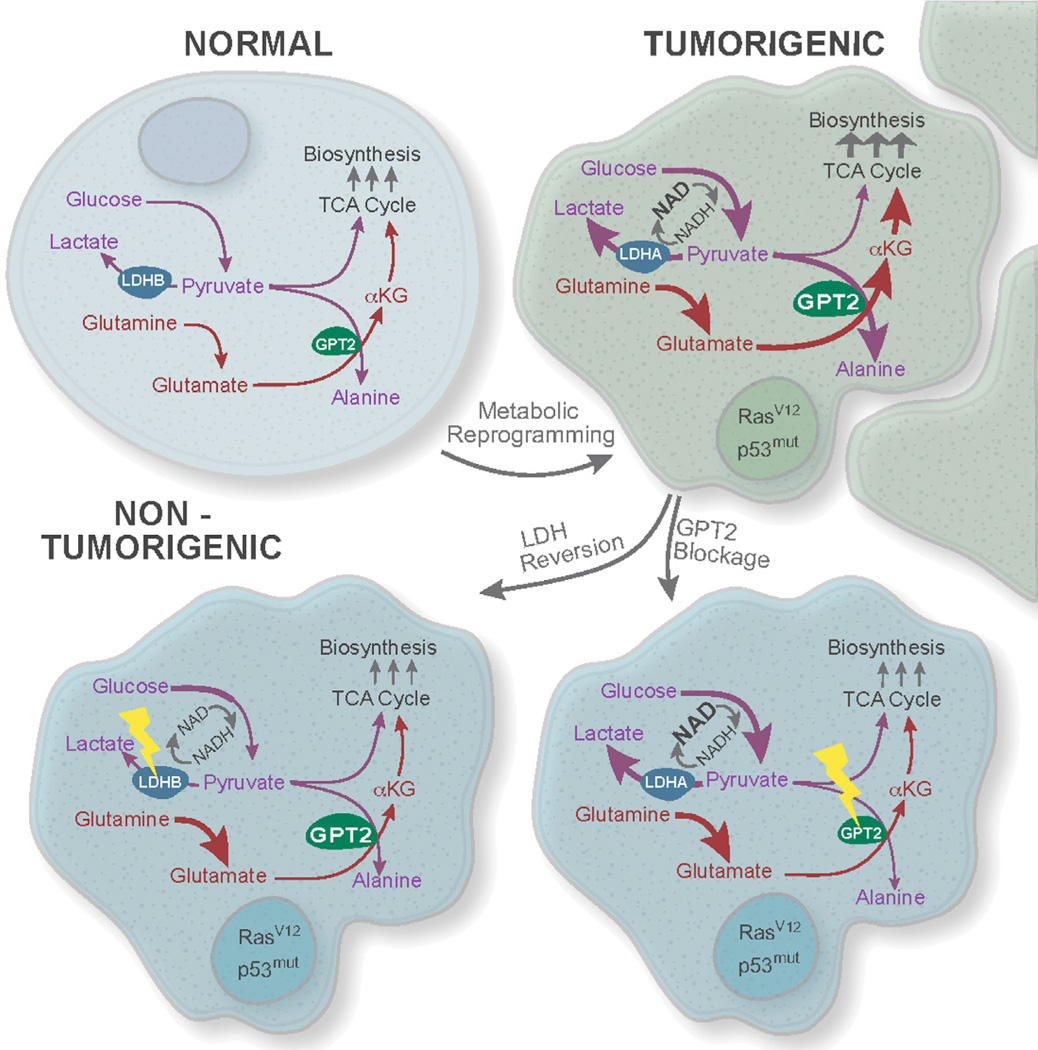
Metabolic reprogramming is critical to oncogenesis, but the emergence and function of this profound reorganization remain poorly understood. Here we find that cooperating oncogenic mutations drive large-scale metabolic reprogramming, which is both intrinsic to cancer cells and obligatory for the transition to malignancy. This involves synergistic regulation of several genes encoding metabolic enzymes, including the lactate dehydrogenases LDHA and LDHB and mitochondrial glutamic pyruvate transaminase 2 (GPT2). Notably, GPT2 engages activated glycolysis to drive the utilization of glutamine as a carbon source for TCA cycle anaplerosis in colon cancer cells. Our data indicate that the Warburg effect supports oncogenesis via GPT2-mediated coupling of pyruvate production to glutamine catabolism. Although critical to the cancer phenotype, GPT2 activity is dispensable in cells that are not fully transformed, thus pinpointing a metabolic vulnerability specifically associated with cancer cell progression to malignancy.

Keywords: GPT2; LDHA; LDHB; TCA cycle; Warburg effect; anaplerosis; cancer metabolism; glycolysis; lactate dehydrogenase; oncogenes.


Figures

Figure 1
Figure 1. Oncogenic Mutations Act Synergistically to Induce the Cancer Cell Metabolic Program
(A) Schematic of central carbon metabolism. (B–D) Extracellular lactate secretion (B), glucose consumption (C), and glutamine consumption (D) of the indicated derivatives of YAMC: combined mutant (mp53/Ras), mp53 alone, Ras alone, or empty vector (BN) cells. (E) Measurement of fatty acid biosynthesis. (B–E) Data are means + SE. (F) Partial least-squares discriminant analysis of metabolic concentrations and the indicated YAMC derivatives. (G–J) Absolute intracellular metabolite concentrations determined by LC-MS/MS. Data are means + SE. (K) Oncogenic cooperativity and allele dominance in metabolic reprogramming of murine colon epithelial cells. Statistically significant differences were assessed by ANOVA as indicated in the Experimental Procedures (Tables S1 and S4). See also Figures S1 and S2 and Tables S1-S4.
Figure 2
Figure 2. The LDH Isoform Switch Is Critical to Tumorigenesis
(A) Glycolysis schematic. (B and C) LDHA or LDHB RNA expression (B) and protein expression (C) in parental (YAMC) cells or the indicated derivatives of YAMC cells: empty vector (BN), mp53, Ras, and combined mutant cells (mp53/Ras). (D and E) LDHA or LDHB RNA expression (D) and protein expression (E) in the indicated derivatives of PR cells: vector control (vector), LDHA knockdown plus LDHB overexpression (LDH-rev), LDHA-kd, or LDHB overexpression (LDHB). (B and E) RNA expression of LDHA or LDHB was measured via real-time PCR using gene-specific primers. (D and C) Protein expression values of LDHA and LDHB were normalized to tubulin expression. (F) Lactate secretion from the indicated derivatives of mp53/Ras cells. (B–F) Data are means + SE. *p < 0.01 versus all other cell lines by Student’s t test. (G) Tumor volumes 4 weeks after eight subcutaneous implantations of the indicated derivatives of mp53/Ras cells in the flanks of nude mice. Median tumor volume is indicated by the horizontal line. *p < 0.01 versus all other cell lines by Student’s t test. See also Figure S3.
Figure 3
Figure 3. The Effect of LDH Isoform Reversal under Hypoxia
(A and B) Adherent cell proliferation of vector control (vector) and LDH isoform-reversed (LDH-rev) mp53/Ras cells under 21 % oxygen (A) or 1 % oxygen (B). Data are means + SD. *p < 0.01 versus vector control by Student’s t test. (C and D) Extracellular lactate secretion (C) and glucose consumption (D) at 1 % oxygen. (E) Total intracellular NAD:NADH ratio at 1 % oxygen determined by LC-MS/MS. (F) Schematic of the glycolytic pathway. (G) Relative intracellular metabolite levels at 1 % oxygen determined by LC-MS/MS. (B–E) Data are means + SE. *p < 0.01 versus vector control by Student’s t test. (H) Cells were labeled with 13C-glucose for 90 min at 1% oxygen, and the relative abundance of 13C and 12C isoforms was determined by LC-MS/MS. Columns represent total relative abundance, and the 13C portion represents the sum of all detectable isotopologues of a given metabolite. *p < 0.01 for 13C isoform abundance of the indicated metabolite versus that metabolite’s 13C isoform abundance in vector control cells by Student’s t test. Data are means + SE. (I) Measurement of fatty acid biosynthesis at 1 % oxygen. Data are means + SE. *p < 0.01 versus vector control by Student’s t test. (C–I) All measurements were made following 8- to 10-hr cell culture in 1 % oxygen. See also Figures S4 and S5 and Table S5.
Figure 4
Figure 4. LDH Supports Glutamine-Driven TCA Anaplerosis under Hypoxia
(A) Schematic of the tricarboxylic acid (TCA) cycle (B) Vector control (vector) or LDH-rev mp53/Ras cells were labeled with 13C-glutamine for 90 min, and the relative abundance of 13C and 12C isoforms was determined by LC-MS/MS. Columns represent total relative abundance, and the 13C portion represents the sum of all detectable isotopologues of a given metabolite. Measurements were made following 8- to 10-hr cell culture in 1 % oxygen. Data are means + SE. *p < 0.01 for 13C isoform abundance of the indicated metabolite versus that metabolite’s 13C isoform abundance in vector control cells by Student’s t test. (C) Adherent cell proliferation in 1 % oxygen and in the presence of 4 mM αKG. Data are means + SD. *p < 0.01 versus all other cell lines by Student’s t test. (D and E) Extracellular lactate secretion (D) and glucose consumption (E) at 1 % oxygen. (F) Total intracellular NAD:NADH ratio at 1 % oxygen determined by LC-MS/MS. (G) Relative intracellular metabolite levels at 1 % oxygen determined by LC-MS/MS. (D–G) Measurements were made following 8- to 10-hr cell culture in 1% oxygen and in the presence of 4 mM αKG where indicated. Data are means + SE. *p< 0.01 versus vector control by Student’s t test. (H) Adherent cell proliferation in 1 % oxygen and in the presence of 4 mM dimethyl malate (mal) where indicated. Data are means + SD. *p < 0.01 versus all other cell lines by Student’s t test. See also Figures S4-S6 and Table S5.
Figure 5
Figure 5. Cooperative Induction of GPT2 Expression Is Important for Glutamine-Driven TCA Anaplerosis and Tumorigenesis
(A) Schematic of GPT2-mediated coupling of glutamine-driven TCA anaplerosis to glycolytic production of pyruvate. (B) GPT2 RNA expression in parental (YAMC) cells or the indicated derivatives of YAMC cells: combined mutant (mp53/Ras), mp53 alone, Ras alone, or empty vector (BN) cells. (C) GPT2 RNA expression in the indicated derivatives of mp53/Ras cells: vector control (vector), GPT2 knockdown (shGPT2), GPT2 knockdown plus shRNA-resistant GPT2 cDNA expression (shGPT2/GPT2), or GPT2 overexpression (GPT2). (B and C) Expression of GPT2 was measured via real-time PCR using gene-specific primers. (D and E) Cells were labeled with 13C-glucose (D) or 13C-glutamine (E) for 90 min, and the relative abundance of 13C and 12C isoforms was determined by LC-MS/MS. Columns represent total relative abundance, and the 13C portion represents the sum of all detectable isotopologues of a given metabolite. *p < 0.01 for 13C isoform abundance of the indicated metabolite versus that metabolite’s 13C isoform abundance in all other cell lines by Student’s t test. Data are means + SE. (F) Adherent cell proliferation in the presence of 4 mM αKG or 4 mM dimethyl malate where indicated. Data are means + SD. *p < 0.01 versus all other cell lines by Student’s t test. (G) Tumor volumes 4 weeks after 12–18 subcutaneous implantations of the indicated derivatives of mp53/Ras cells in the flanks of nude mice. Median tumor volume is indicated by the horizontal line. *p<0.01 versus all other cell lines by Student’s t test. “8” on the graph indicates the number of data points represented by the indicated marker. (H) GPT2 RNA expression in the indicated derivatives of YAMC, immortalized YAMC (YAMC-im), mp53, or Ras cells: vector control (vector) or GPT2 knockdown (shGPT2). Expression of GPT2 was measured via real-time PCR using gene-specific primers. (I) Adherent cell proliferation of the indicated YAMC derivatives. Data are means + SD. See also Figures S5 and S6 and Table S5.
Figure 6
Figure 6. GPT2 Is Critical for Human Colon Cancer Cell Proliferation
(A) GPT2 RNA expression in human colon tumor versus non-tumor samples. *p < 0.01 versus non-tumor by Student’s t test. The y axis values represent linear scale. (B and C) GPT2 RNA expression in the indicated derivatives of HCT116 (B) or SW480 (C) cells: shGFP control (shGFP), GPT2 knockdown-1 (shGPT2-1), or GPT2 knockdown-2 (shGPT2-2). Expression of GPT2 was measured via real-time PCR using gene-specific primers. (D–G). Cells were labeled with 13C-glucose (D and E) or 13C-glutamine (F and G) for 90 min, and the relative abundance of 13C and 12C isoforms was determined by LC-MS/MS. Columns represent total relative abundance, and the 13C portion represents the sum of all detectable isotopologues of a given metabolite. *p<0.01 for 13C isoform abundance of the indicated metabolite versus that metabolite’s 13C isoform abundance in shGFP control by Student’s t test. (B–E) Data are means + SE. (H and I) Tumor volumes 4 weeks after 12 subcutaneous implantations of the indicated cell lines in the flanks of nude mice. Median tumor volume is indicated by the horizontal line. *p < 0.01 versus shGFP by Student’s t test. (J and K) Adherent cell proliferation in the presence of 4 mM αKG or 4 mM dimethyl malate where indicated. Data are means + SD. *p < 0.01 versus all other cell lines, except shGPT2-2, by Student’s t test. **p < 0.01 versus shGFP by Student’s t test. See also Figures S5 and S7 and Tables S6 and S7.
Figure 7
Figure 7. Oncogene-lnduced Coupling of Aerobic Glycolysis and Glutamine-Driven TCA Cycle Anaplerosis Is Mediated by GPT2 and Critical to the Cancer Phenotype
Oncogenic mutations induce metabolic reprogramming in part through switching expression of LDHB to LDHA and inducing GPT2 expression, resulting in both activation and coupling of aerobic glycolysis and TCA cycle anaplerosis to support cancer cell proliferation. We suggest that this link between glycolytically derived pyruvate and glutamine metabolism reflects a critical feature of the Warburg effect.

References

    1. Augoff K, Hryniewicz-Jankowska A, Tabola R. Lactate dehydrogenase 5: an old friend and anew hope in the war on cancer. Cancer Lett. 2015;358:1–7. - PubMed
    1. Baer R, Cintas C, Dufresne M, Cassant-Sourdy S, Schönhuber N, Planque L, Lulka H, Couderc B, Bousquet C, Garmy-Susini B, et al. Pancreatic cell plasticity and cancer initiation induced by oncogenic Kras is completely dependent on wild-type PI 3-kinase p110α. Genes Dev. 2014;28:2621–2635. - PMC - PubMed
    1. Bauer DE, Hatzivassiliou G, Zhao F, Andreadis C, Thompson CB. ATP citrate lyase is an important component of cell growth and transformation. Oncogene. 2005;24:6314–6322. - PubMed
    1. Bensaad K, Tsuruta A, Selak MA, Vidal MN, Nakano K, Bartrons R, Gottlieb E, Vousden KH. TIGAR, a p53-inducible regulator of glycolysis and apoptosis. Cell. 2006;126:107–120. - PubMed
    1. Brownsey RW, Boone AN, Elliott JE, Kulpa JE, Lee WM. Regulation of acetyl-CoA carboxylase. Biochem. Soc. Trans. 2006;34:223–227. - PubMed

Publication types