Expanding anchored hybrid enrichment to resolve both deep and shallow relationships within the spider tree of life
- PMID: 27733110
- PMCID: PMC5062932
- DOI: 10.1186/s12862-016-0769-y
Expanding anchored hybrid enrichment to resolve both deep and shallow relationships within the spider tree of life
Abstract
Background: Despite considerable effort, progress in spider molecular systematics has lagged behind many other comparable arthropod groups, thereby hindering family-level resolution, classification, and testing of important macroevolutionary hypotheses. Recently, alternative targeted sequence capture techniques have provided molecular systematics a powerful tool for resolving relationships across the Tree of Life. One of these approaches, Anchored Hybrid Enrichment (AHE), is designed to recover hundreds of unique orthologous loci from across the genome, for resolving both shallow and deep-scale evolutionary relationships within non-model systems. Herein we present a modification of the AHE approach that expands its use for application in spiders, with a particular emphasis on the infraorder Mygalomorphae.
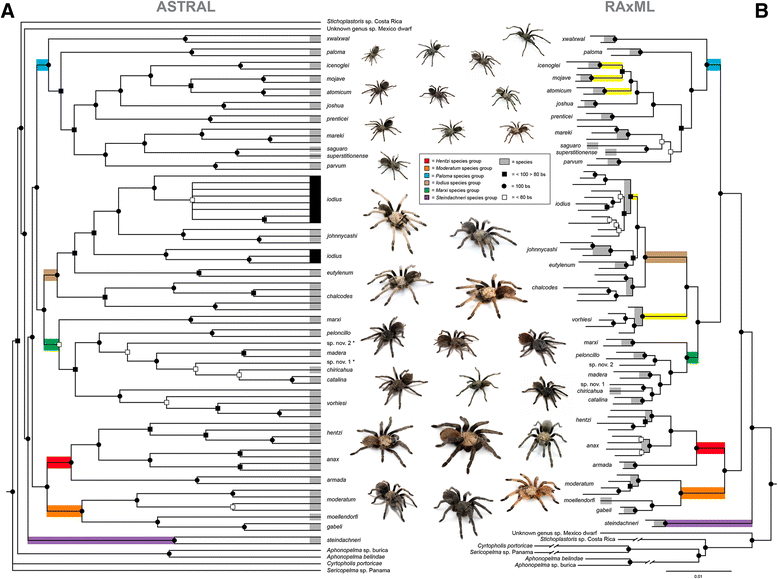
Results: Our aim was to design a set of probes that effectively capture loci informative at a diversity of phylogenetic timescales. Following identification of putative arthropod-wide loci, we utilized homologous transcriptome sequences from 17 species across all spiders to identify exon boundaries. Conserved regions with variable flanking regions were then sought across the tick genome, three published araneomorph spider genomes, and raw genomic reads of two mygalomorph taxa. Following development of the 585 target loci in the Spider Probe Kit, we applied AHE across three taxonomic depths to evaluate performance: deep-level spider family relationships (33 taxa, 327 loci); family and generic relationships within the mygalomorph family Euctenizidae (25 taxa, 403 loci); and species relationships in the North American tarantula genus Aphonopelma (83 taxa, 581 loci). At the deepest level, all three major spider lineages (the Mesothelae, Mygalomorphae, and Araneomorphae) were supported with high bootstrap support. Strong support was also found throughout the Euctenizidae, including generic relationships within the family and species relationships within the genus Aptostichus. As in the Euctenizidae, virtually identical topologies were inferred with high support throughout Aphonopelma.
Conclusions: The Spider Probe Kit, the first implementation of AHE methodology in Class Arachnida, holds great promise for gathering the types and quantities of molecular data needed to accelerate an understanding of the spider Tree of Life by providing a mechanism whereby different researchers can confidently and effectively use the same loci for independent projects, yet allowing synthesis of data across independent research groups.
Keywords: Anchored Hybrid Enrichment; Anchored phylogenomics; Arachnida; Araneae; Conserved regions; Mygalomorphae; Targeted sequence capture; Ultraconserved elements.
Figures


Similar articles
-
Spider-specific probe set for ultraconserved elements offers new perspectives on the evolutionary history of spiders (Arachnida, Araneae).Mol Ecol Resour. 2020 Jan;20(1):185-203. doi: 10.1111/1755-0998.13099. Epub 2019 Oct 28. Mol Ecol Resour. 2020. PMID: 31599100
-
Resolving Relationships among the Megadiverse Butterflies and Moths with a Novel Pipeline for Anchored Phylogenomics.Syst Biol. 2018 Jan 1;67(1):78-93. doi: 10.1093/sysbio/syx048. Syst Biol. 2018. PMID: 28472519
-
Phylogeny of a cosmopolitan family of morphologically conserved trapdoor spiders (Mygalomorphae, Ctenizidae) using Anchored Hybrid Enrichment, with a description of the family, Halonoproctidae Pocock 1901.Mol Phylogenet Evol. 2018 Sep;126:303-313. doi: 10.1016/j.ympev.2018.04.008. Epub 2018 Apr 12. Mol Phylogenet Evol. 2018. PMID: 29656103
-
Advances in the reconstruction of the spider tree of life: A roadmap for spider systematics and comparative studies.Cladistics. 2023 Dec;39(6):479-532. doi: 10.1111/cla.12557. Epub 2023 Oct 3. Cladistics. 2023. PMID: 37787157 Review.
-
Sequence Capture versus Restriction Site Associated DNA Sequencing for Shallow Systematics.Syst Biol. 2016 Sep;65(5):910-24. doi: 10.1093/sysbio/syw036. Epub 2016 Jun 10. Syst Biol. 2016. PMID: 27288477 Review.
Cited by
-
Chromosomal evolution, environmental heterogeneity, and migration drive spatial patterns of species richness in Calochortus (Liliaceae).Proc Natl Acad Sci U S A. 2024 Mar 5;121(10):e2305228121. doi: 10.1073/pnas.2305228121. Epub 2024 Feb 23. Proc Natl Acad Sci U S A. 2024. PMID: 38394215 Free PMC article.
-
Phylogenomic reclassification of the world's most venomous spiders (Mygalomorphae, Atracinae), with implications for venom evolution.Sci Rep. 2018 Jan 26;8(1):1636. doi: 10.1038/s41598-018-19946-2. Sci Rep. 2018. PMID: 29374214 Free PMC article.
-
Rapid radiation of ant parasitic butterflies during the Miocene aridification of Africa.Ecol Evol. 2023 May 13;13(5):e10046. doi: 10.1002/ece3.10046. eCollection 2023 May. Ecol Evol. 2023. PMID: 37193112 Free PMC article.
-
Phylogenomic and morphological relationships among the botryllid ascidians (Subphylum Tunicata, Class Ascidiacea, Family Styelidae).Sci Rep. 2021 Apr 16;11(1):8351. doi: 10.1038/s41598-021-87255-2. Sci Rep. 2021. PMID: 33863944 Free PMC article.
-
Phylogenomic Evidence Overturns Current Conceptions of Social Evolution in Wasps (Vespidae).Mol Biol Evol. 2018 Sep 1;35(9):2097-2109. doi: 10.1093/molbev/msy124. Mol Biol Evol. 2018. PMID: 29924339 Free PMC article.
References
-
- World Spider Catalog. 2016. Natural History Museum Bern, online at http://wsc.nmbe.ch, version 17, Accessed 02/2016.
-
- Agnarsson I, Coddington JA, Kuntner M. Spider Research in the 21st Century Progress in the study of spider diversity and evolution. Manchester: Siri Scientific Press; 2013. Systematics; pp. 58–111.
MeSH terms
Substances
Associated data
LinkOut - more resources
Full Text Sources
Other Literature Sources
Research Materials

