. 2017 Jan;7(1):38-53.
doi: 10.1158/2159-8290.CD-16-0975. Epub 2016 Oct 12.

CREBBP Inactivation Promotes the Development of HDAC3-Dependent Lymphomas

Affiliations

CREBBP Inactivation Promotes the Development of HDAC3-Dependent Lymphomas

Yanwen Jiang et al. Cancer Discov. 2017 Jan.

Abstract

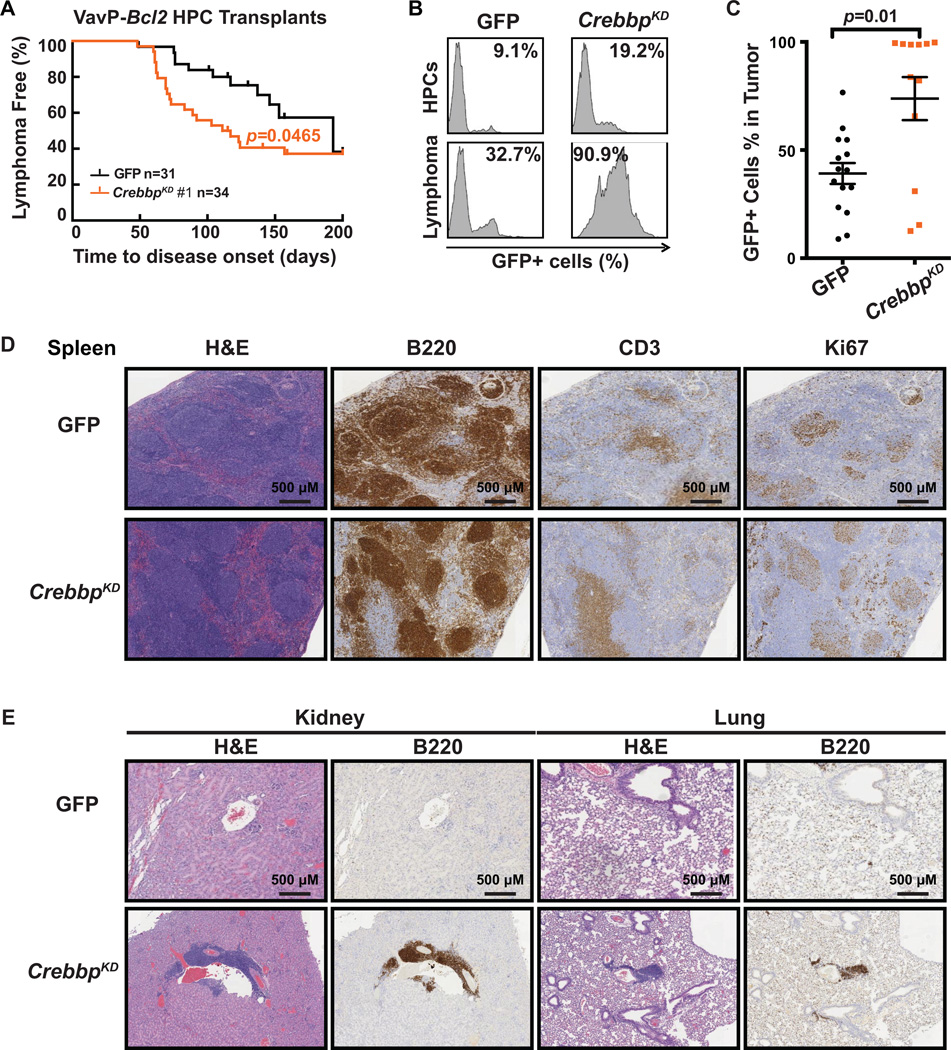
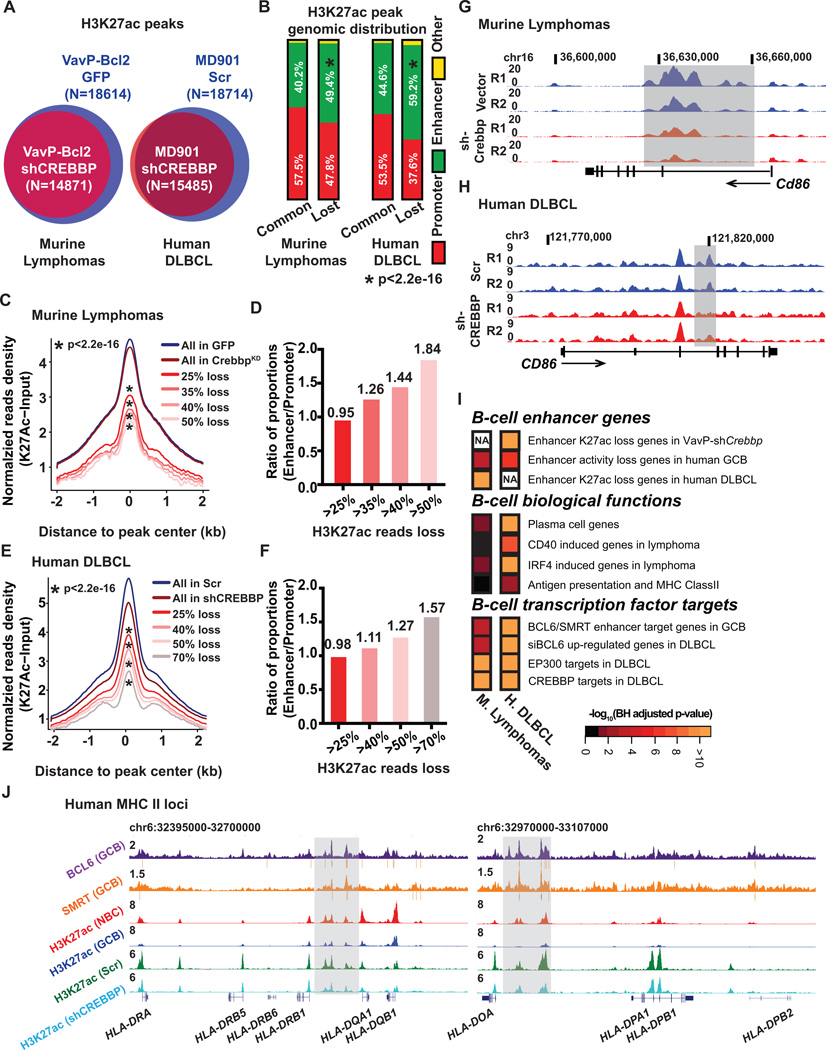
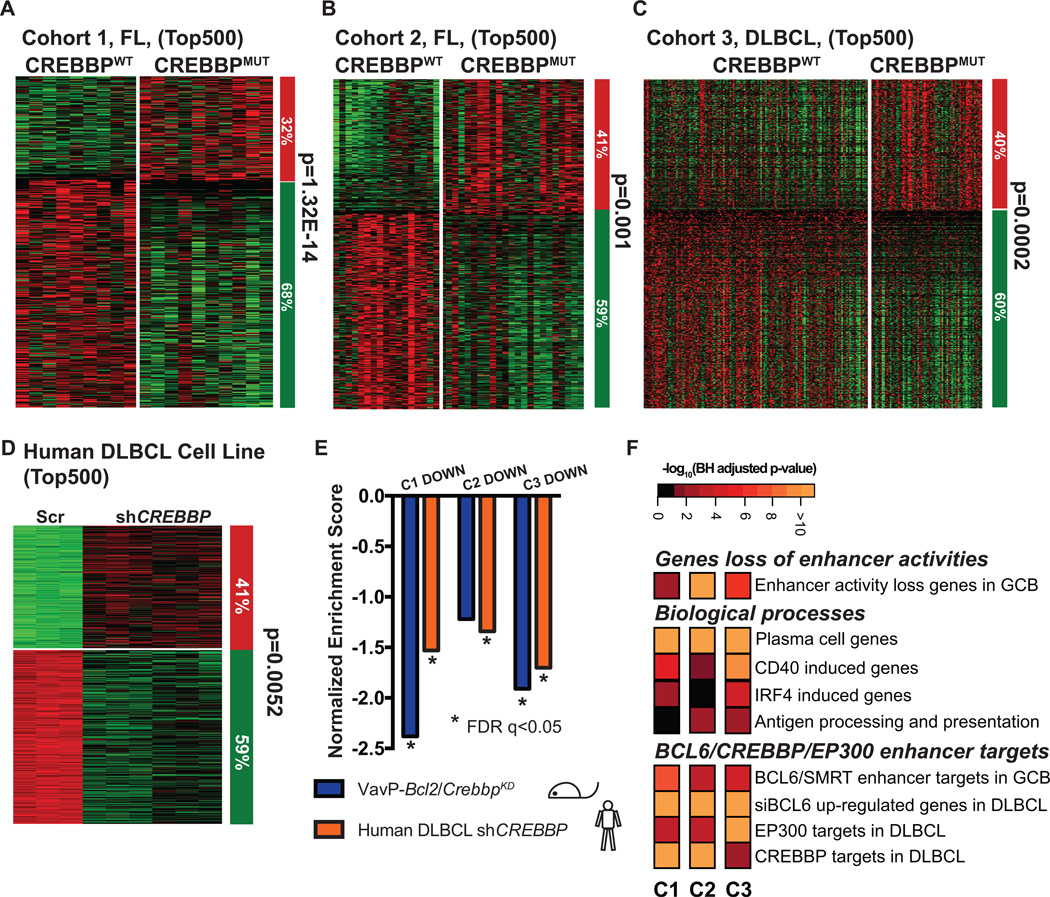
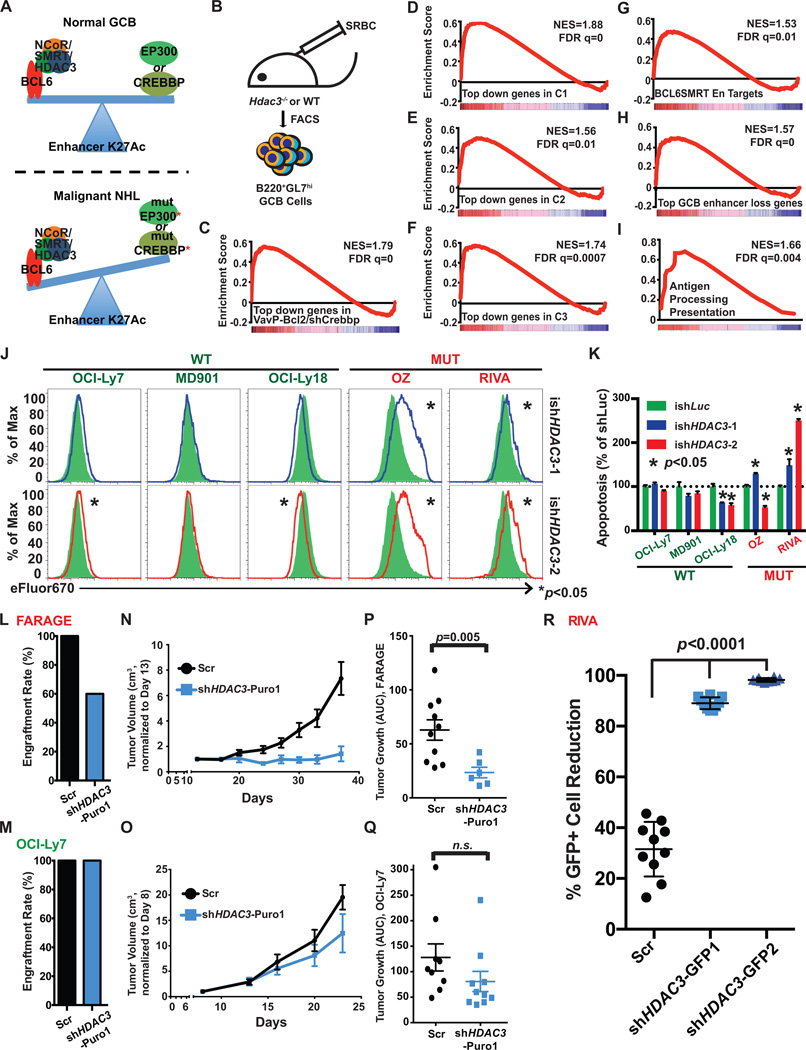
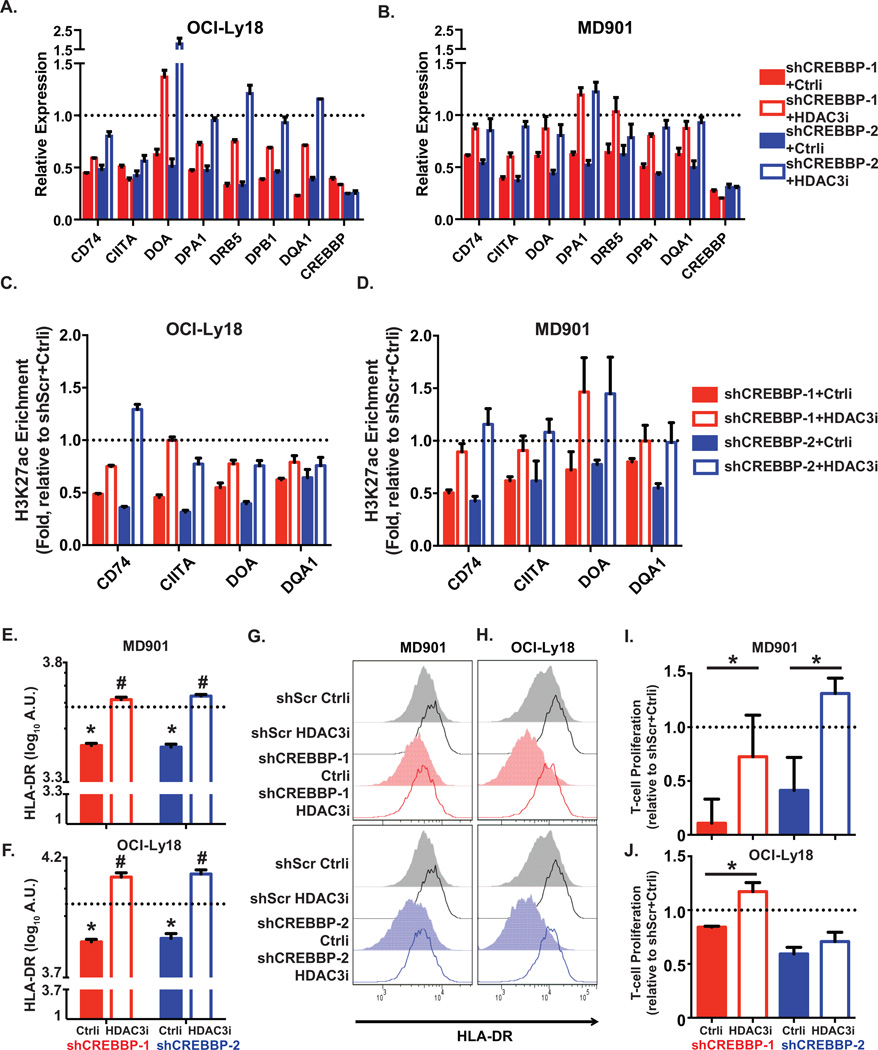
Somatic mutations in CREBBP occur frequently in B-cell lymphoma. Here, we show that loss of CREBBP facilitates the development of germinal center (GC)-derived lymphomas in mice. In both human and murine lymphomas, CREBBP loss-of-function resulted in focal depletion of enhancer H3K27 acetylation and aberrant transcriptional silencing of genes that regulate B-cell signaling and immune responses, including class II MHC. Mechanistically, CREBBP-regulated enhancers are counter-regulated by the BCL6 transcriptional repressor in a complex with SMRT and HDAC3, which we found to bind extensively to MHC class II loci. HDAC3 loss-of-function rescued repression of these enhancers and corresponding genes, including MHC class II, and more profoundly suppressed CREBBP-mutant lymphomas in vitro and in vivo Hence, CREBBP loss-of-function contributes to lymphomagenesis by enabling unopposed suppression of enhancers by BCL6/SMRT/HDAC3 complexes, suggesting HDAC3-targeted therapy as a precision approach for CREBBP-mutant lymphomas.

Significance: Our findings establish the tumor suppressor function of CREBBP in GC lymphomas in which CREBBP mutations disable acetylation and result in unopposed deacetylation by BCL6/SMRT/HDAC3 complexes at enhancers of B-cell signaling and immune response genes. Hence, inhibition of HDAC3 can restore the enhancer histone acetylation and may serve as a targeted therapy for CREBBP-mutant lymphomas. Cancer Discov; 7(1); 38-53. ©2016 AACR.See related commentary by Höpken, p. 14This article is highlighted in the In This Issue feature, p. 1.


Conflict of interest statement

of Potential Conflicts of Interest: E. Holson is chief scientific officer of KDAc Therapeutics, Inc. No potential conflicts of interest were disclosed by other authors.

Figures

Figure 1
Figure 1. Crebbp deficiency accelerates B-cell lymphoma development in mice
A, Kaplan-Meier curve of C57BL/6 mice transplanted with VavP-Bcl2 HPCs transduced with MSCV-GFP retroviral vector alone (GFP, black, n=31), or containing shRNAs against Crebbp (red, n=34). Statistical significance of survival difference was determined by the log-rank test between shCrebbp and vector alone. B, Representative flow cytometry histograms showing the GFP positive cell percentage of the pre-injection HPCs and the splenic murine lymphoma cells that derived from the same HPC. C, Dot plot representing the GFP positive cell percentage in the splenic murine lymphoma cells in individual recipient animal. The mean and standard error of the mean (S.E.M.) were represented for each transplant group. Statistical significance was determined by Mann-Whitney test. D, H&E, B220, CD3, and Ki67 staining of spleen tissues extracted from recipient mice upon sacrifice. Scale bars, 500 µm. E, H&E and B220 staining of kidney and lung tissues extracted from recipient mice upon sacrifice. Scale bars, 500 µm.
Figure 2
Figure 2. Crebbp deficiency results in focal H3K27ac loss in mouse and human lymphoma
A, Venn diagrams showing the overlap between the H3K27ac peaks in B220+ cells from VavP-Bcl2/GFP tumors (n=4) or from VavP-Bcl2/shCrebbp tumors (n=6) (left panel), or the overlap between the H3K27ac peaks in MD901 cells transduced with either control scramble shRNA (n=3) or shRNAs against CREBBP (n=6) (right panel). B, Stacked bar plot representing the genomic distribution of common and lost H3K27ac peaks between VavP-Bcl2/GFP and VavP-Bcl2/shCrebbp tumor cells (left panel), or between MD901 cells transduced with either control scramble or CREBBP shRNAs (n=6). C, Normalized average H3K27ac read density plot at loci identified as H3K27ac peaks in MACS-purified B220+ B cells from VavP-Bcl2/GFP tumors. The black line represents the average values in VavP-Bcl2/EV tumors (n=4), and the dark red line represents the values in VavP-Bcl2/shCrebbp tumors (n=6). Average values of peaks that exhibited more than 25%, 35%, 40%, and 50% reads loss in VavP-Bcl2/shCrebbp tumors as compared to VavP-Bcl2/GFP tumors are shown as lines in different shades of red. * representing statistical significant loss of normalized H3K27ac read density as determined by Kolmogorov-Smirnov test. D, Bar plot representing ratio of the proportions of enhancer peaks or promoter peaks that exhibited more than 25%, 35%, 40%, and 50% reads loss in VavP-Bcl2/shCrebbp tumors as compared to VavP-Bcl2/GFP tumors. E, Normalized average H3K27ac read density plot at loci identified as H3K27ac peaks in scramble shRNA transduced MD901 cells. The black line represents the average values in scramble shRNA transduced MD901 cells (n=3), and the dark red line represents the values in CREBBP shRNAs transduced MD901 cells (n=6). Average values of peaks that exhibited more than 25%, 40%, 50%, and 70% reads loss in CREBBP KD cells as compared to control scramble cells are shown as lines in different shades of red. * representing statistical significant loss of normalized H3K27ac read density as determined by Kolmogorov-Smirnov test. F, Bar plot representing ratio of the proportions of enhancer peaks or promoter peaks that exhibited more than 25%, 40%, 50%, and 70% reads loss in CREBBP KD cells as compared to control scramble MD901 cells. G, UCSC read-density tracks of normalized H3K27ac ChIP-seq reads at murine Cd86 locus in two representative VavP-Bcl2/GFP tumors and two representative VavP-Bcl2/shCrebbp tumors. Shaded areas highlight the regions showed loss of H3K27ac in VavP-Bcl2/shCrebbp tumors. H, UCSC read-density tracks of normalized H3K27ac ChIP-seq reads at human CD86 locus in two representative biological replicates of control scramble (Scr) MD901 cells and two representative biological replicates of CREBBP KD (shCREBBP) MD901 cells. Shaded areas highlight the regions showed loss of H3K27ac in KD cells. I, Pathways analysis of genes (n=1147) with > 25% reduction of H3K27ac reads at enhancers in murine VavP-Bcl2/shCrebbp tumors, or genes (n=2928) with > 25% reduction of H3K27ac reads at enhancers in CREBBP knockdown cells. Heatmap represents the BH-adjusted p value of each geneset tested. J, UCSC read-density tracks of normalized BCL6 (purple) and SMRT (orange) ChIP-seq reads in human tonsilar GCBs, H3K27ac ChIP-seq reads in human tonsilar NBCs (red) and GCBs (blue), and H3K27ac ChIP-seq in control scramble (Scr, green) and CREBBP KD (shCREBBP, turquoise) MD901 cells at the human MHC II loci. BCL6 and SMRT peaks determined by MACS2 are indicated by grey bars under the read density track. Shaded areas highlight the enhancers that were bound by BCL6 and SMRT, and showed loss of H3K27ac in CREBBP KD cells.
Figure 3
Figure 3. CREBBP loss of function results in gene expression repression signature
A–D, Supervised analysis of the top 500 most differentially expression genes between CREBBP WT (CREBBPWT) and mutant (CREBBPMUT) FL (A, B), DLBCL patients (C), or between scramble and CREBBP knockdown MD901 cells (D). Columns represent individual samples, rows correspond to the genes. Heatmap represents the z-scores of the expression value (RPKM) characterized by RNA-seq. The column on the right represents the proportion of the genes that were repressed (green) or upregulated (red) CREBBPMUT patient samples as compared to CREBBPWT patient samples (A–C), or in CREBBP knockdown cells as compared to scramble control samples of the respective cohorts (D). Statistical significance was determined by Fisher Exact test. E, Summary of the GSEA of the down-regulated genes in the top 500 most differentially expressed genes of respective cohorts as compared to ranked gene expression changes between either murine VavP-Bcl2/CrebbpKD and VavP-Bcl2/EV murine tumors (purple bars) or between CREBBP KD and Scr MD901 cells (orange bars). * indicates statistical significant enrichment (FDR q<0.05). F, Pathway analysis of the down-regulated genes within the top 500 most differentially expressed genes of respective cohorts. Heatmap represents the –log10 BH-adjusted p-value of each geneset tested.
Figure 4
Figure 4. Loss of HDAC3 inhibits CREBBP mutant lymphoma growth in vitro and in vivo
A, A schematic model showing the opposing effects on enhancer H3K27ac regulation between CREBBP and EP300 and BCL6/SMRT/HDAC3 corepressor complex in normal GCB cells and in malignant lymphoma cells. B, A cartoon outlining the generation and collection of GC B-cells in Hdac3−/− and Hdac3fl/fl mice for RNAseq. C–I, GSEA enrichment plots showing correlation of different genesets with ranked expression change between murine Hdac3−/− and Hdac3fl/fl germinal centre B-cells, n=2 from each group. NES, normalized enrichment score. J, Representative flow cytometry histograms demonstrating proliferation of CREBBP WT lymphoma cell lines (OCI-Ly7, MD901 and OCI-Ly18) and mutant lymphoma cell lines (OZ and RIVA). Each cell line was transduced with inducible shRNAs against either control Luciferase gene (ishLuc, green shaded area) or HDAC3 (ishHDAC3-1, blue, top panel, and ishHDAC3-2, red, bottom panel). Transduced cells were labeled with cell proliferation dye eFluor 670 and cultured for 5 days with the presence of 0.2 µg/ml Doxycycline. * represents statistical difference between ishLuc (n=3) and respective ishHDAC3 (n=3), determined by T-test. K, Bar plot showing the relative apoptotic cells in CREBBP mutant or WT cells with ishHDAC3-1 (blue), and ishHDAC3-2 (red) as compared to ishLuc (green), measured by Annexin V staining. The numbers represent mean and S.E.M. of the percentage of Annexin V+/DAPI- cells of three replicates normalized to the average in the shLuc samples. L,M, Engraftment rate of FARAGE (L, CREBBP mutant) or OCI-Ly7 (M, CREBBP WT) in SCID mice. SCID mice were s.c. injected with 1E7 FARAGE or OCI-Ly7 cells either transduced with a scramble shRNA (black) or a shRNA against HDAC3 (blue), 10 animals per group. N,O, Tumor growth plots of FARAGE (N) and OCI-Ly7 (O) xenografted mice. P,Q. Dot plots showing the growth of each tumor measured as area under the curve. Average tumor growth (mean ± S.E.M.) is represented on the y-axis, which represents tumor volume (cm3)/time (days). Statistical significance was determined by Mann-Whitney U test. R, Dot plots showing the percentages of GFP positive tumor cell population reduction in RIVA xenograft model with either HDAC3 shRNAs (shHDAC3-GFP1, shHDAC3-GFP2) or scramble shRNA (Scr). For each group, mean ± S.D. was presented. Statistical significance was calculated by Mann-Whitney test.
Figure 5
Figure 5. CREBBP regulates antigen processing and presentation gene enhancers
A,B, Bar plots representing the relative expression of antigen presentation and MHC II genes in OCI-Ly18 (A) and MD901 (B) cells upon CREBBP depletion and treated with either a selective HDAC3 inhibitor (HDAC3i) or a control compound (Ctrli), as compared to scramble shRNA induced cells (set as 1, dotted lines). Bar graph represents mean and S.E.M. from three replicates. C,D, Bar plots representing the relative H3K27ac enrichment at enhancers of MHC II genes in OCI-Ly18 (C) and MD901 (D) cells upon CREBBP depletion and treated with either a selective HDAC3 inhibitor (HDAC3i) or a control compound (Ctrli), as compared to scramble shRNA induced cells (set as 1, dotted lines). Bar graph represents mean and S.E.M. from three replicates. E,F, Quantification of HLA-DR measured by flow cytometry in shCREBBP or scramble transduced lymphoma MD901 (E) and OCI-Ly18 (F) cells treated with either a selective HDAC3 inhibitor (HDAC3i) or a control compound (Ctrli). Cells were transduced with shRNAs for 3 days and then treated with compounds for 96hr. The data was represented as mean ± S.D. Statistical significance was determined by Student’s T-test. * indicates significant difference between control compound-treated scamble or shCREBBP transduced cells (p<0.05). # indicates significant difference between control compound and selective HDAC3 inhibitor treated cells (p<0.05). G,H, Representative flow cytometry histograms showing cell surface level of MHC II molecule HLA-DR that were quantified in E and F. I,J, Bar plots showing the relative proliferation of T-cells stimulated by shCREBBP or scramble transduced lymphoma MD901 (I) or OCI-Ly18 (J) cells treated with either a selective HDAC3 inhibitor (HDAC3i) or a control compound (Ctrli). The data indicate relative folds of T cell proliferation, represented as ratio of fluorescence (560nm/590nm) from each treatments to that from scramble shRNA transduced cells treated with control compound (set as 1, dotted lines). Statistical significance was determined by Student’s T-test.

Comment in

References

    1. Al-Tourah AJ, Gill KK, Chhanabhai M, Hoskins PJ, Klasa RJ, Savage KJ, et al. Population-based analysis of incidence and outcome of transformed non-Hodgkin's lymphoma. J Clin Oncol. 2008;26:5165–5169. - PubMed
    1. Pasqualucci L, Dominguez-Sola D, Chiarenza A, Fabbri G, Grunn A, Trifonov V, et al. Inactivating mutations of acetyltransferase genes in B-cell lymphoma. Nature. 2011;471:189–195. - PMC - PubMed
    1. Pasqualucci L, Trifonov V, Fabbri G, Ma J, Rossi D, Chiarenza A, et al. Analysis of the coding genome of diffuse large B-cell lymphoma. Nat Genet. 2011;43:830–837. - PMC - PubMed
    1. Lohr JG, Stojanov P, Lawrence MS, Auclair D, Chapuy B, Sougnez C, et al. Discovery and prioritization of somatic mutations in diffuse large B-cell lymphoma (DLBCL) by whole-exome sequencing. Proc Natl Acad Sci U S A. 2012;109:3879–3884. - PMC - PubMed
    1. Zhang J, Grubor V, Love CL, Banerjee A, Richards KL, Mieczkowski PA, et al. Genetic heterogeneity of diffuse large B-cell lymphoma. Proc Natl Acad Sci U S A. 2013;110:1398–1403. - PMC - PubMed

Publication types

MeSH terms