

Optimization and Reproducibility of Aortic Valve 18F-Fluoride Positron Emission Tomography in Patients With Aortic Stenosis
- PMID: 27733431
- PMCID: PMC5068186
- DOI: 10.1161/CIRCIMAGING.116.005131
Optimization and Reproducibility of Aortic Valve 18F-Fluoride Positron Emission Tomography in Patients With Aortic Stenosis
Abstract
Background: 18F-Fluoride positron emission tomography (PET) and computed tomography (CT) can measure disease activity and progression in aortic stenosis. Our objectives were to optimize the methodology, analysis, and scan-rescan reproducibility of aortic valve 18F-fluoride PET-CT imaging.
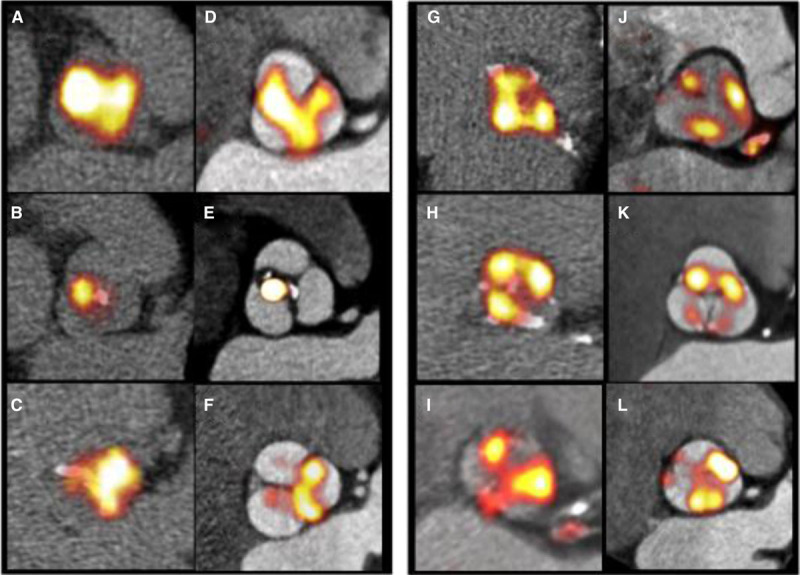
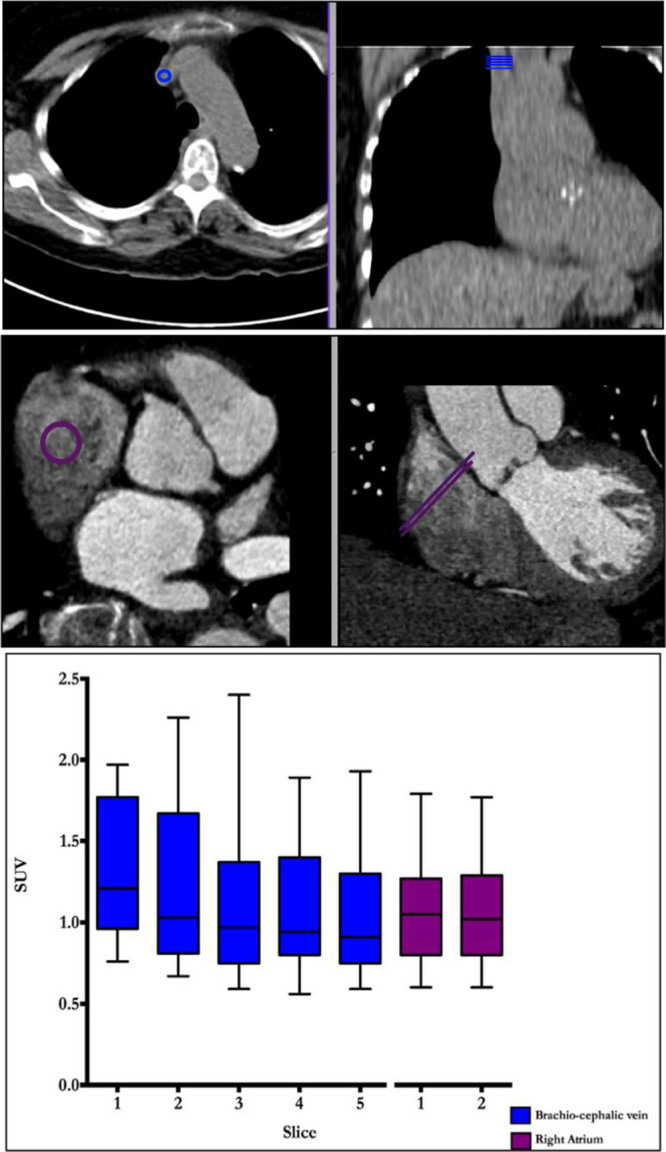
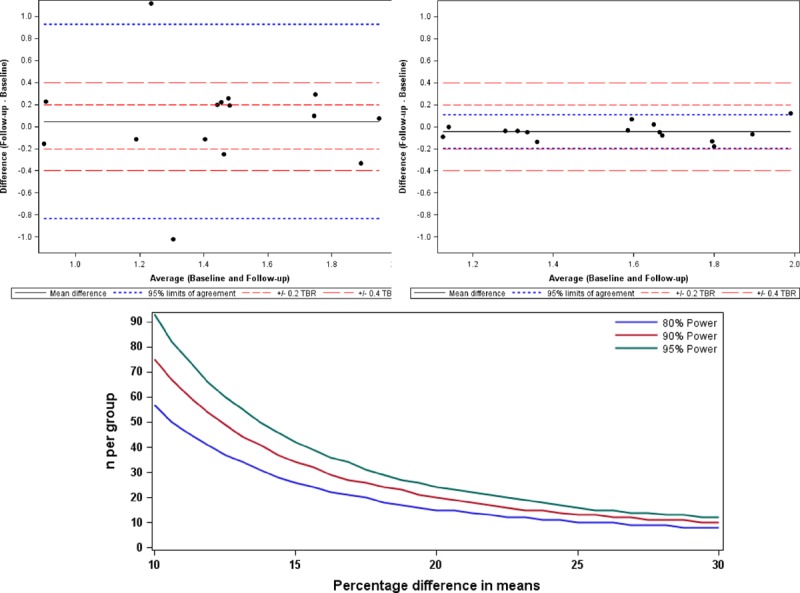
Methods and results: Fifteen patients with aortic stenosis underwent repeated 18F-fluoride PET-CT. We compared nongated PET and noncontrast CT, with a modified approach that incorporated contrast CT and ECG-gated PET. We explored a range of image analysis techniques, including estimation of blood-pool activity at differing vascular sites and a most diseased segment approach. Contrast-enhanced ECG-gated PET-CT permitted localization of 18F-fluoride uptake to individual valve leaflets. Uptake was most commonly observed at sites of maximal mechanical stress: the leaflet tips and the commissures. Scan-rescan reproducibility was markedly improved using enhanced analysis techniques leading to a reduction in percentage error from ±63% to ±10% (tissue to background ratio MDS mean of 1.55, bias -0.05, limits of agreement -0·20 to +0·11).
Conclusions: Optimized 18F-fluoride PET-CT allows reproducible localization of calcification activity to different regions of the aortic valve leaflet and commonly to areas of increased mechanical stress. This technique holds major promise in improving our understanding of the pathophysiology of aortic stenosis and as a biomarker end point in clinical trials of novel therapies.
Clinical trial registration: URL: http://www.clinicaltrials.gov. Unique identifier: NCT02132026.
Keywords: 18F-Fluoride; aortic valve stenosis; calcification; disease progression; echocardiography; positron emission tomography.
© 2016 The Authors.
Conflict of interest statement
None.
Figures

Comment in
-
Aortic Valve 18F-Fluoride Positron Emission Tomography: Can the Skeleton Key Be Copied?Circ Cardiovasc Imaging. 2016 Oct;9(10):e005574. doi: 10.1161/CIRCIMAGING.116.005574. Circ Cardiovasc Imaging. 2016. PMID: 27733432 No abstract available.
References
-
- Pawade TA, Newby DE, Dweck MR. Calcification in a ortic atenosis: the skeleton key. J Am Coll Cardiol. 2015;66:561–577. doi: 10.1016/j.jacc.2015.05.066. - PubMed
-
- Rossebø AB, Pedersen TR, Boman K, Brudi P, Chambers JB, Egstrup K, Gerdts E, Gohlke-Bärwolf C, Holme I, Kesäniemi YA, Malbecq W, Nienaber CA, Ray S, Skjaerpe T, Wachtell K, Willenheimer R SEAS Investigators. Intensive lipid lowering with simvastatin and ezetimibe in aortic stenosis. N Engl J Med. 2008;359:1343–1356. doi: 10.1056/NEJMoa0804602. - PubMed
-
- Irkle A, Vesey AT, Lewis DY, Skepper JN, Bird JL, Dweck MR, Joshi FR, Gallagher FA, Warburton EA, Bennett MR, Brindle KM, Newby DE, Rudd JH, Davenport AP. Identifying active vascular microcalcification by (18)F-sodium fluoride positron emission tomography. Nat Commun. 2015;6:7495. doi: 10.1038/ncomms8495. - PMC - PubMed
-
- Dweck MR, Jenkins WS, Vesey AT, Pringle MA, Chin CW, Malley TS, Cowie WJ, Tsampasian V, Richardson H, Fletcher A, Wallace WA, Pessotto R, van Beek EJ, Boon NA, Rudd JH, Newby DE. 18F-sodium fluoride uptake is a marker of active calcification and disease progression in patients with aortic stenosis. Circ Cardiovasc Imaging. 2014;7:371–378. doi: 10.1161/CIRCIMAGING.113.001508. - PubMed
Publication types
MeSH terms
Substances
Supplementary concepts
Associated data
Grants and funding
LinkOut - more resources
Full Text Sources
Other Literature Sources
Medical
Research Materials
Miscellaneous
