. 2016 Dec;172(4):2261-2274.
doi: 10.1104/pp.16.01191. Epub 2016 Oct 12.

Reversible Leaf Xylem Collapse: A Potential "Circuit Breaker" against Cavitation

Affiliations

Reversible Leaf Xylem Collapse: A Potential "Circuit Breaker" against Cavitation

Yong-Jiang Zhang et al. Plant Physiol. 2016 Dec.

Abstract

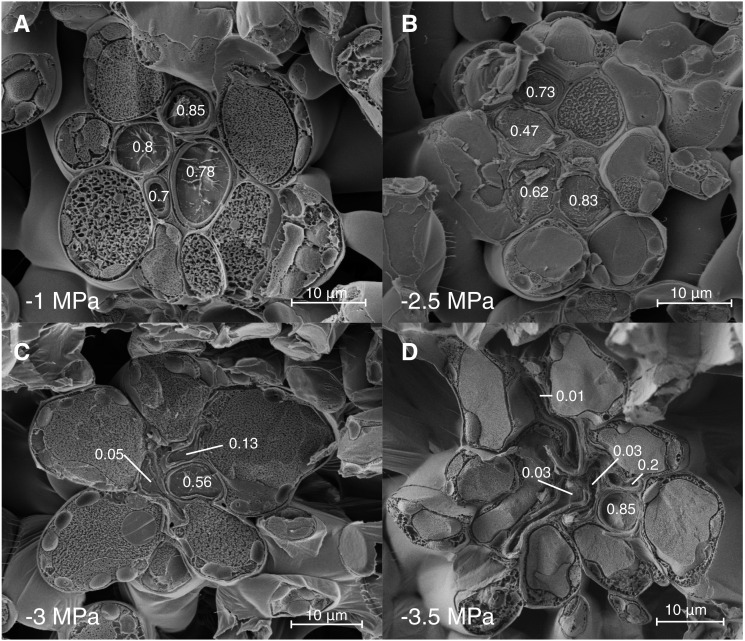
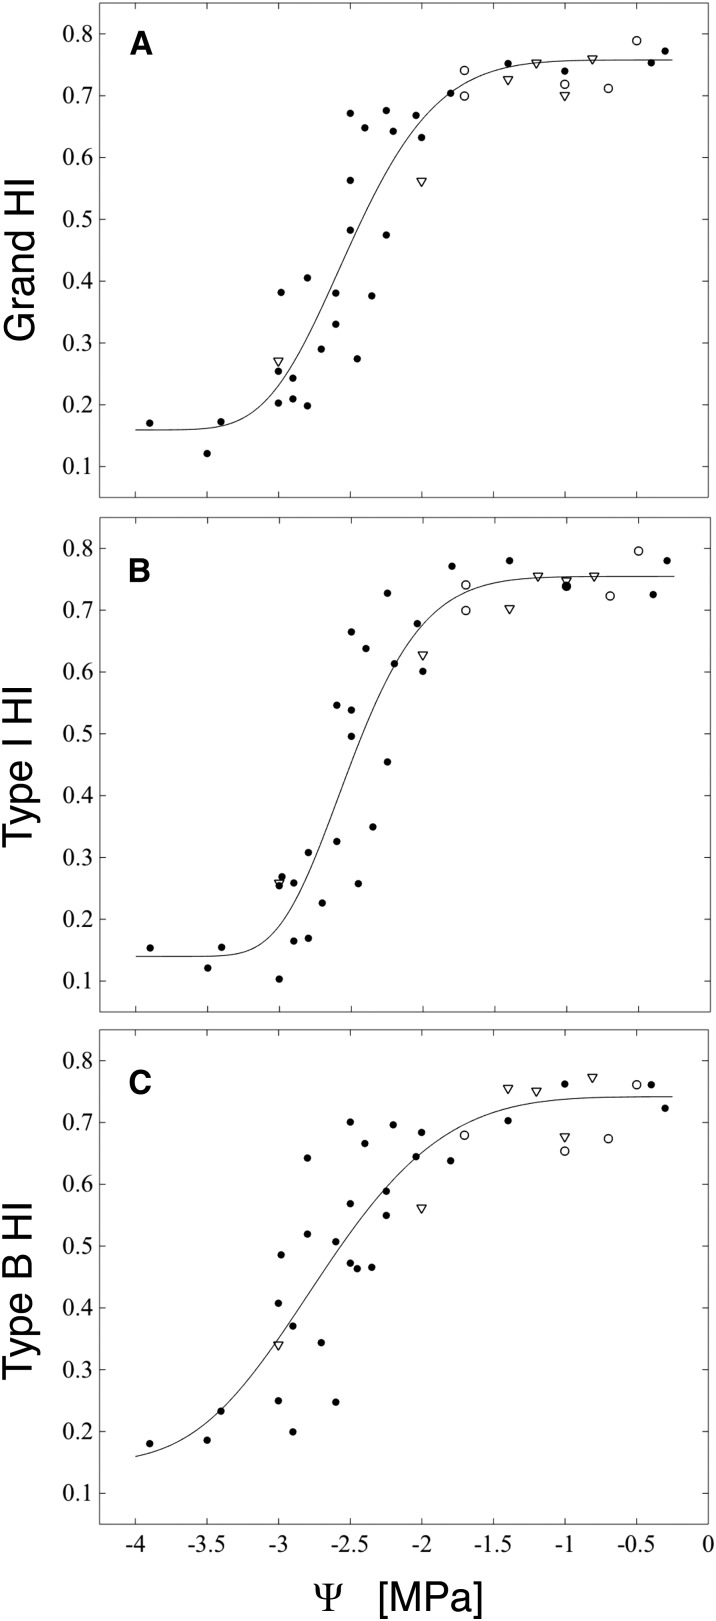
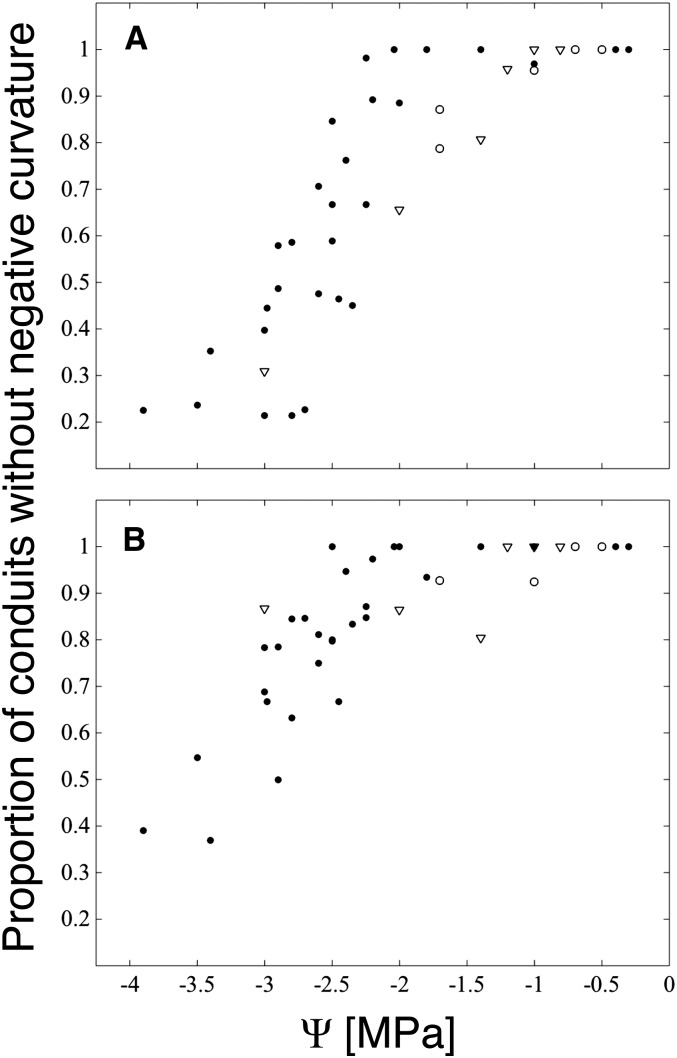
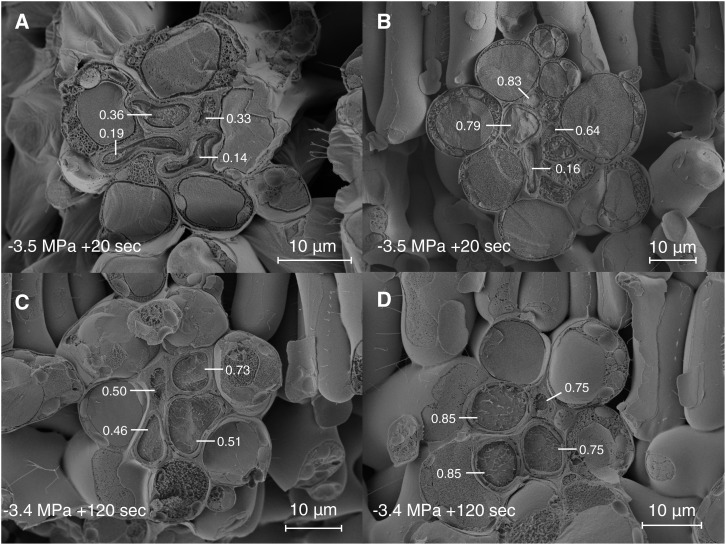
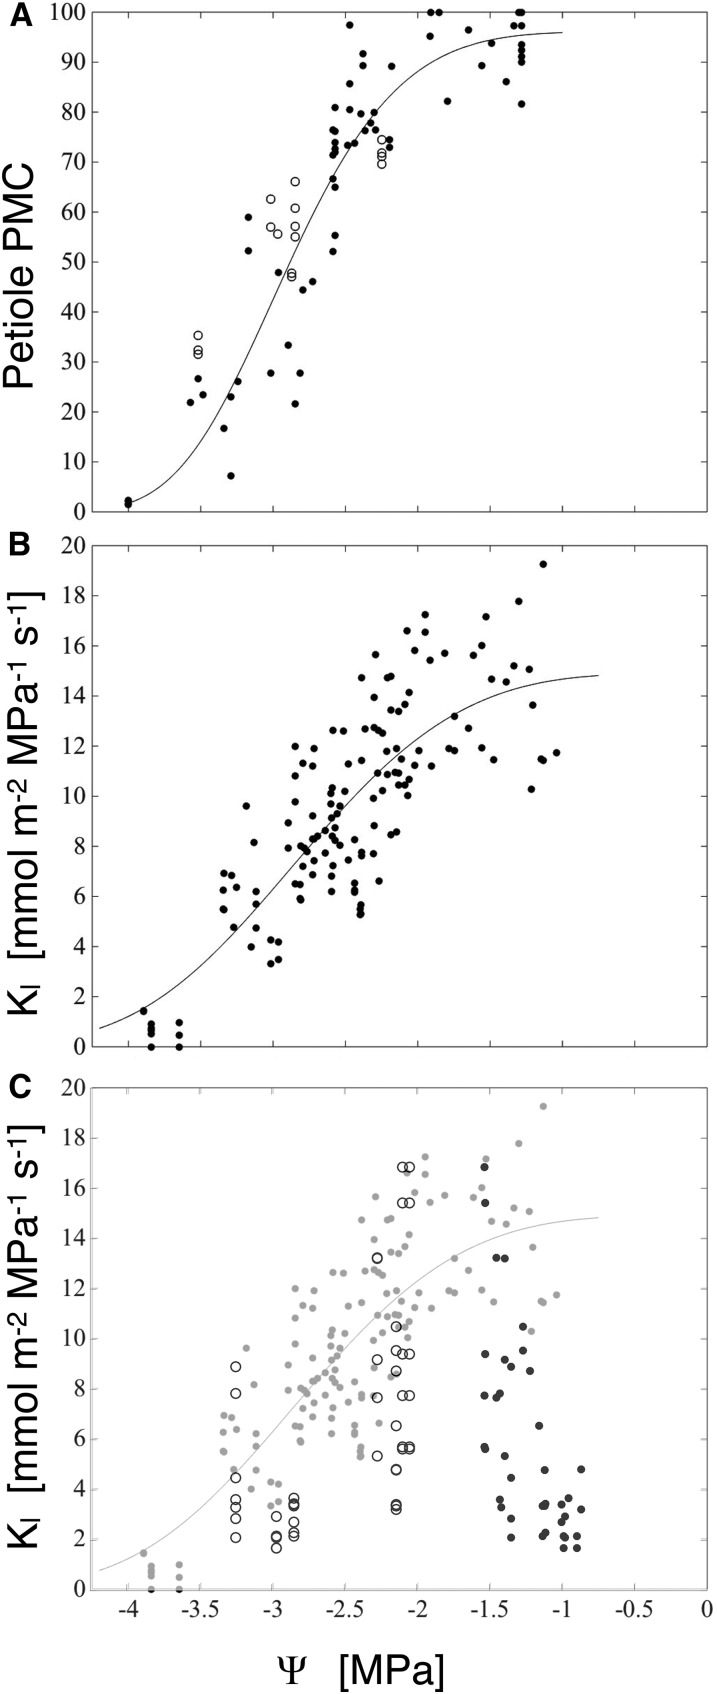
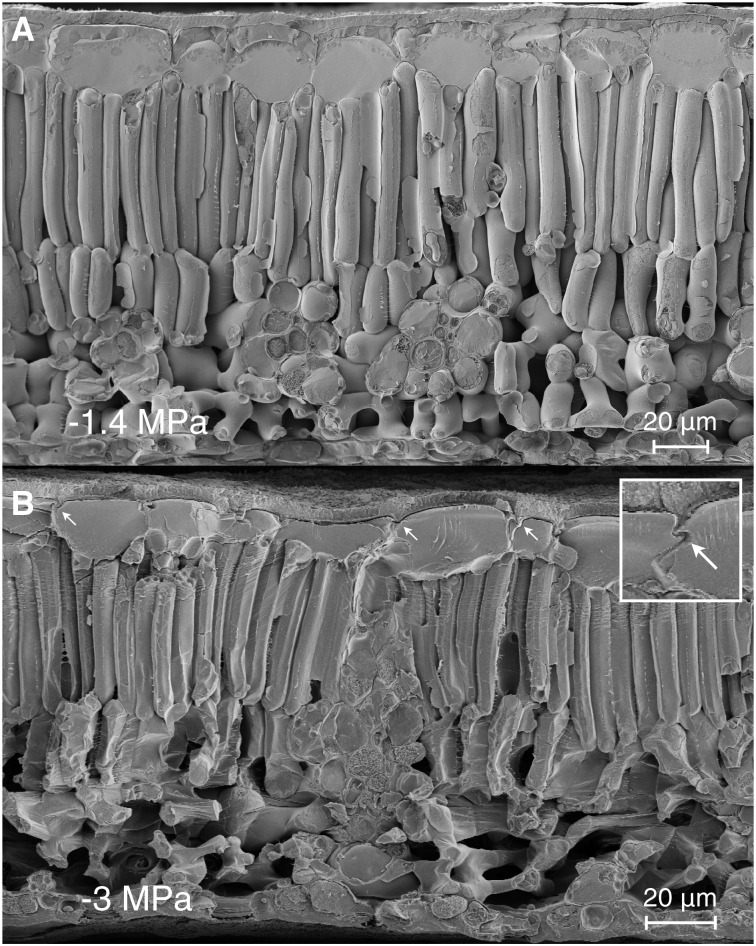
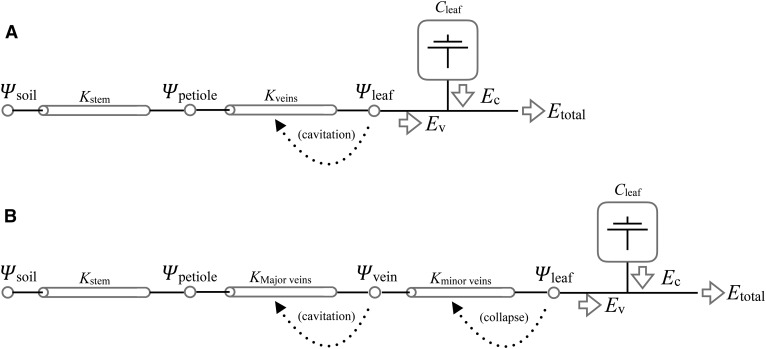
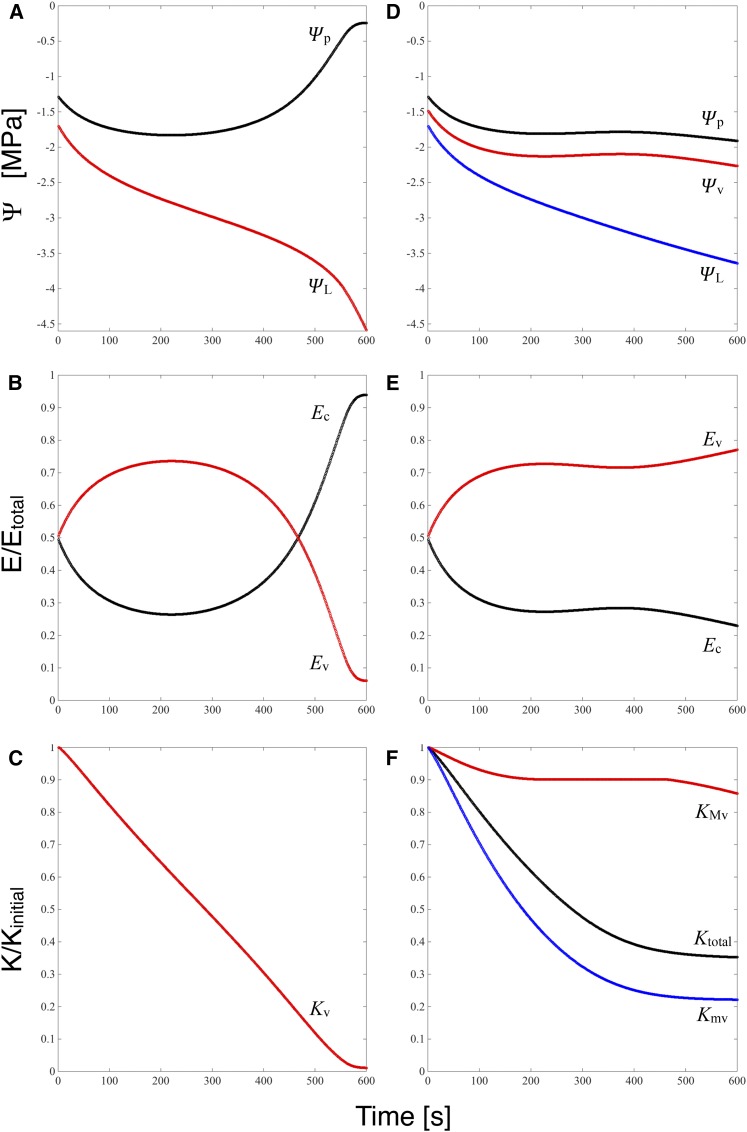
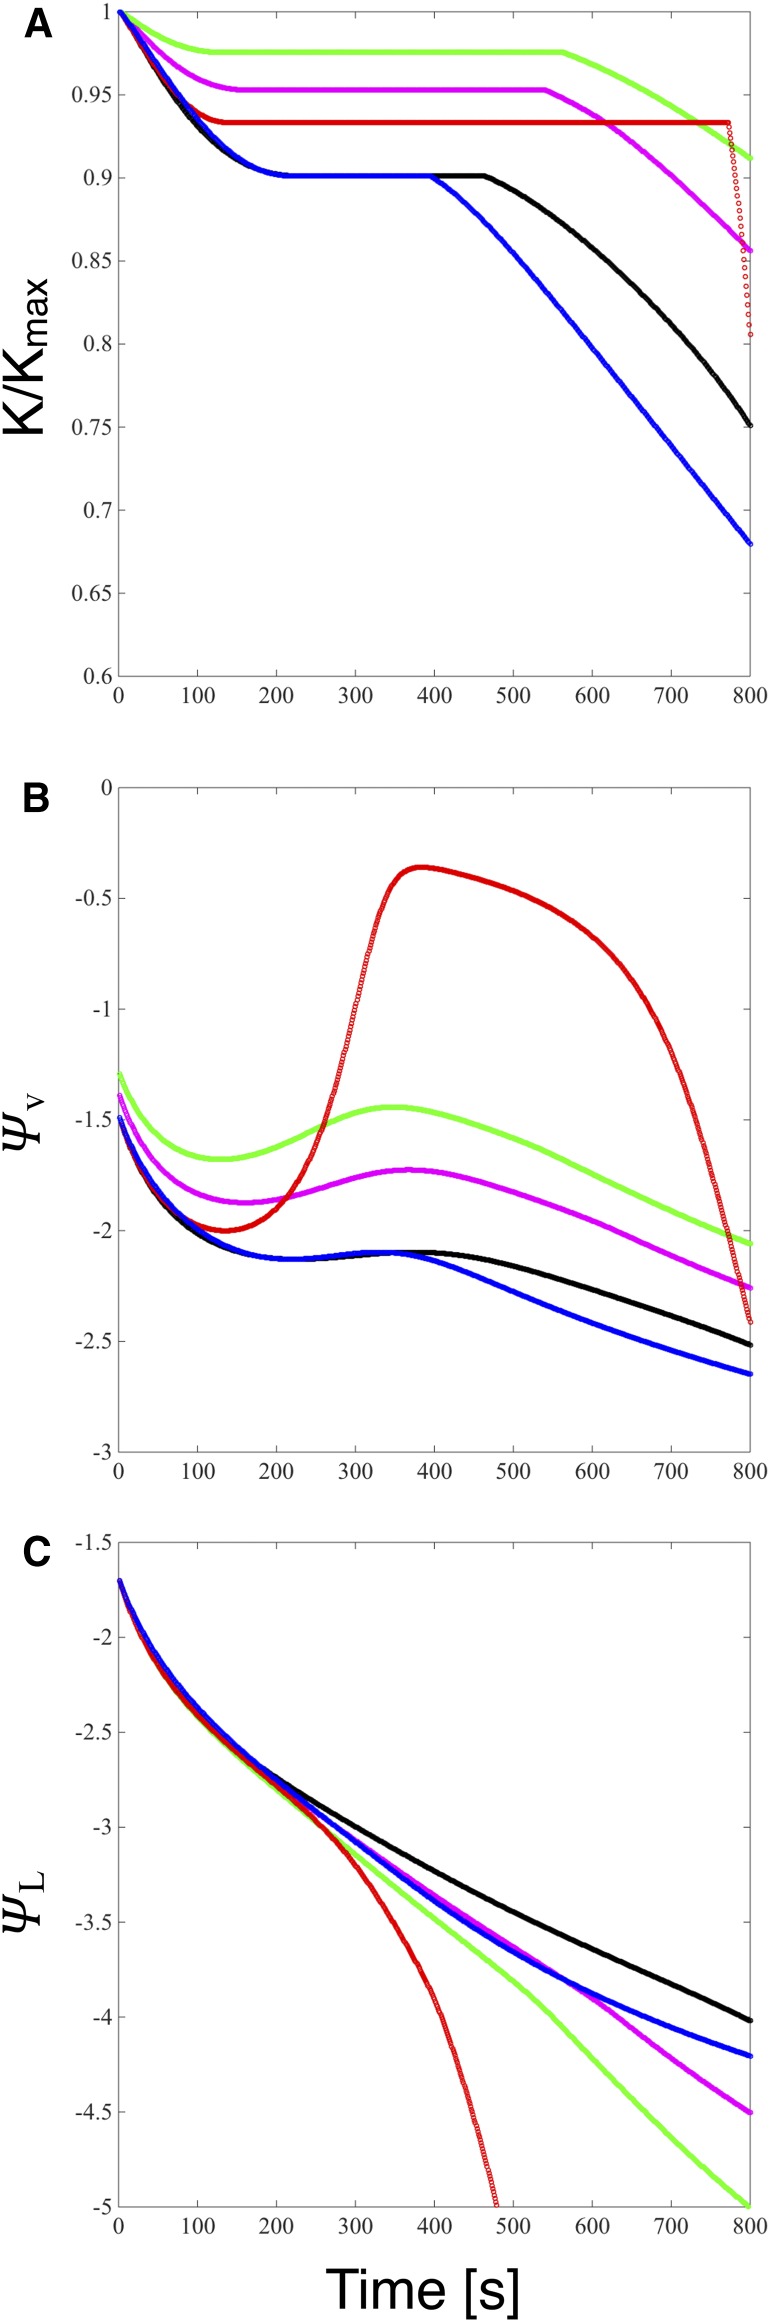
We report a novel form of xylem dysfunction in angiosperms: reversible collapse of the xylem conduits of the smallest vein orders that demarcate and intrusively irrigate the areoles of red oak (Quercus rubra) leaves. Cryo-scanning electron microscopy revealed gradual increases in collapse from approximately -2 MPa down to -3 MPa, saturating thereafter (to -4 MPa). Over this range, cavitation remained negligible in these veins. Imaging of rehydration experiments showed spatially variable recovery from collapse within 20 s and complete recovery after 2 min. More broadly, the patterns of deformation induced by desiccation in both mesophyll and xylem suggest that cell wall collapse is unlikely to depend solely on individual wall properties, as mechanical constraints imposed by neighbors appear to be important. From the perspective of equilibrium leaf water potentials, petioles, whose vessels extend into the major veins, showed a vulnerability to cavitation that overlapped in the water potential domain with both minor vein collapse and buckling (turgor loss) of the living cells. However, models of transpiration transients showed that minor vein collapse and mesophyll capacitance could effectively buffer major veins from cavitation over time scales relevant to the rectification of stomatal wrong-way responses. We suggest that, for angiosperms, whose subsidiary cells give up large volumes to allow large stomatal apertures at the cost of potentially large wrong-way responses, vein collapse could make an important contribution to these plants' ability to transpire near the brink of cavitation-inducing water potentials.


Figures

Figure 1.
Figure 1.
Freeze-fracture cryo-SEM images of the intrusive veins of red oak leaves. The hydraulic index (HI) of the xylem conduits, a measure of roundness, decreases as the water potential falls (bottom left corner). At −1 MPa (A), none of the xylem conduits show any negative curvature; by −2.5 MPa (B), two of the four conduits show signs of buckling (HI = 0.47 and 0.62); at −3 MPa (C), all conduits have buckled, but there is a broad range in the degree of deformation; by −3.5 MPa (D), most conduits are highly deformed (HI = 0.01, 0.03, 0.03, 0.2), while one (HI = 0.85) persists in an undeformed state. HI scores for each vein in total were as follows: 0.79 (A), 0.6 (B), 0.2 (C), and 0.05 (D).
Figure 2.
Figure 2.
Boundary and intrusive vein collapse as functions of water potential (Ψ). A, Grand HI for each leaf is calculated over all conduits from both vein types. B, Type I HI is calculated over all conduits from intrusive veins only. C, Type B HI is calculated over all conduits from boundary veins. HI scores for each leaf are plotted at the branch water potential (black circles) or for rehydrated leaves at the final equilibrium water potential (white circles; initial Ψ = −3.5 to −2.7) and at the predicted final equilibrium water potential for leaves frozen immediately after rehydration (white triangles; initial Ψ = −3.5 to −2.5 MPa).
Figure 3.
Figure 3.
Proportion of conduits whose perimeters lack instances of negative (concave) curvature. A, Intrusive veins (type I). B, Boundary veins (type B). Scores for each leaf sample imaged are plotted at the parent branch water potential (black circles) or for rehydrated leaves at the final equilibrium water potential (white circles; initial Ψ = −3.5 to −2.7) and at the predicted final equilibrium water potential for leaves frozen immediately after rehydration (white triangles; initial Ψ = −3.5 to −2.5 MPa).
Figure 4.
Figure 4.
Freeze-fracture cryo-SEM images of intrusive vein xylem recovery from deformation during rehydration. HI index scores are given for each conduit. In a leaf initially at −3.5 MPa and frozen after 20 s of hydration (A and B), the degree of recovery varies between different intrusive veins from no apparent recovery (A) with shrunken mesophyll to almost full recovery (B) with turgid mesophyll. In a leaf hydrated from −3.4 MPa for 120 s, recovery in conduit shape and mesophyll turgor is uniform (C and D). The expected equilibrium water potentials, had the leaves come to internal equilibrium rather than been frozen, were −3 MPa (A and B) and −1.4 MPa (C and D).
Figure 5.
Figure 5.
A, Petiole conductance, as percentage maximum flushed values, versus branch water potential. Black circles, Petioles sampled at native water potentials; white circles, petioles sampled after relaxing branches to −1.7 to −0.1 MPa from their native minimum water potentials (plotted). B, Kl versus initial branch water potential; the line is a best-fit Weibull function. C, Leaf conductances from branches dried to a minimum water potential and rehydrated to between −1.6 and −0.9 MPa, then reequilibrated before measuring Kl. Rehydrated Kl is plotted versus branch minimum water potential (white circles), and the rehydrated branch water potential was measured at the time of the experiment (black circles); data in gray are Kl values replotted from B for comparison.
Figure 6.
Figure 6.
Heterogeneity across leaf cell types in deformation due to dehydration. A, At water potentials above the buckling point, all tissues appear equally turgid. B, At water potentials below the buckling point, the spongy mesophyll cells appear crumpled, while the palisade mesophyll cells are faceted along their long axes. The cells with the least mechanical freedom from their neighbors (epidermal and vascular parenchyma) show the least deformation. In the epidermal cells at top, deformation is seen in the lateral walls (white arrows), consistent with larger changes in thickness relative to area. The inset shows a 2× digital magnification of a deformed region of the lateral wall.
Figure 7.
Figure 7.
Schematics for two models of the loss of vascular function in leaves. A, In the cavitation-only model, the conductance of the leaf vasculature (Kveins) is determined by transpiring leaf water potential (Ψleaf). B, In the cavitation-and-collapse model, the conductance of the vasculature is split into two conductors in series, such that the major veins are subject to cavitation and the minor veins are subject to collapse, as driven by their vulnerability curves and the downstream water potentials. In both models, Etotal, Ψsoil, and Kstem are specified and invariant, and the flux from the living cells (Cleaf) is the capacitive discharge specified by a PV curve and Ψleaf.
Figure 8.
Figure 8.
Model results for an oak leaf subject to a doubling of transpiration and xylem subject to cavitation (A–C) or with cavitation restricted to the major veins and the minor veins subject to collapse (D–F). Quantities in red are related to cavitation, and those in blue are related to collapse. A and D, Water potentials at the stem-petiole junction (black), at the transition from major to minor veins (red), and at the vascular-mesophyll interface, equivalent in the model to the bulk-averaged ΨL (red in A and blue in D). B and E, Proportions of the transpiration flux E accounted for by flow through the veins (red) and capacitive discharge from living cells (black). C and F, Effect of cavitation on the conductance of the entire vasculature (C; red) or just the major veins (F; red); effect of collapse on the conductance of the minor veins (F; blue); and total conductance of the vascular network as affected by both cavitation and collapse (F; black).
Figure 9.
Figure 9.
Sensitivity of model results for the protective effect of collapse (A), vein water potential (B), and ΨL (C) to various parameters. Black, Baseline model with vascular resistance partitioned equally between major and minor veins. Blue, Using the lower 2015 capacitance curve shortens the duration of the plateau in conductance in B. Red, Lowering the residual conductance of the minor veins to 1% extends the plateau in the fall in conductance in A, greatly increasing the buffering of vein potential (Ψv) in B but at the cost of a catastrophic fall in ΨL (C). Increasing the proportion of total vascular resistance assigned to the minor veins from the 50% baseline to 75% (magenta) and 99% (green) shows a pattern of diminishing returns with respect to protective benefits (A) and ΨL costs (C).

References

    1. Blackman CJ, Brodribb TJ, Jordan GJ (2010) Leaf hydraulic vulnerability is related to conduit dimensions and drought resistance across a diverse range of woody angiosperms. New Phytol 188: 1113–1123 - PubMed
    1. Boyer J. (1995) Measuring the Water Status of Plants and Soils. Academic Press, San Diego, CA
    1. Brodribb TJ, Holbrook NM (2003) Stomatal closure during leaf dehydration, correlation with other leaf physiological traits. Plant Physiol 132: 2166–2173 - PMC - PubMed
    1. Brodribb TJ, Holbrook NM (2004) Stomatal protection against hydraulic failure: a comparison of coexisting ferns and angiosperms. New Phytol 162: 663–670 - PubMed
    1. Brodribb TJ, Holbrook NM (2005) Water stress deforms tracheids peripheral to the leaf vein of a tropical conifer. Plant Physiol 137: 1139–1146 - PMC - PubMed

Publication types

LinkOut - more resources