. 2017 Jan 1;117(1):93-103.
doi: 10.1152/jn.00134.2016. Epub 2016 Oct 12.

Clarithromycin increases neuronal excitability in CA3 pyramidal neurons through a reduction in GABAergic signaling

Affiliations

Clarithromycin increases neuronal excitability in CA3 pyramidal neurons through a reduction in GABAergic signaling

Edyta K Bichler et al. J Neurophysiol. .

Abstract

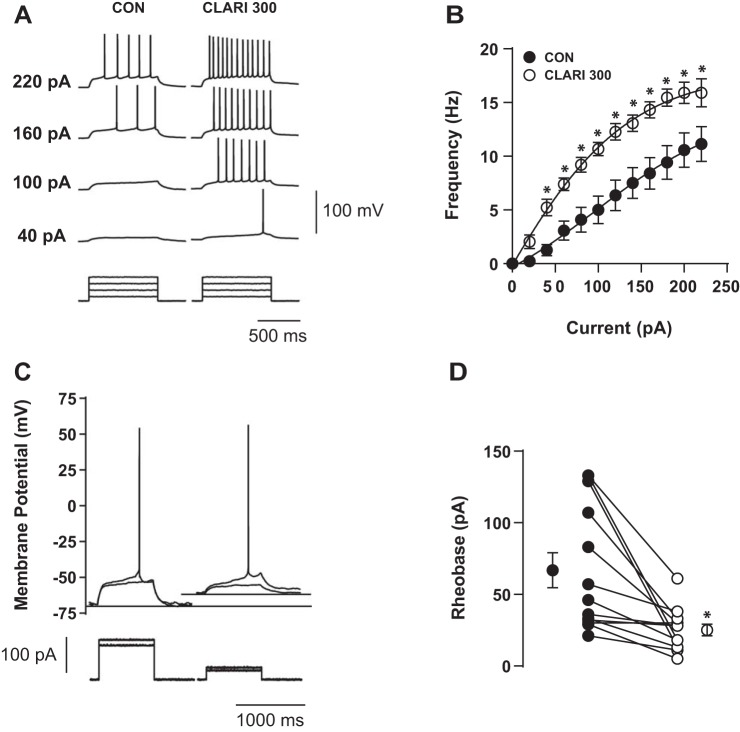
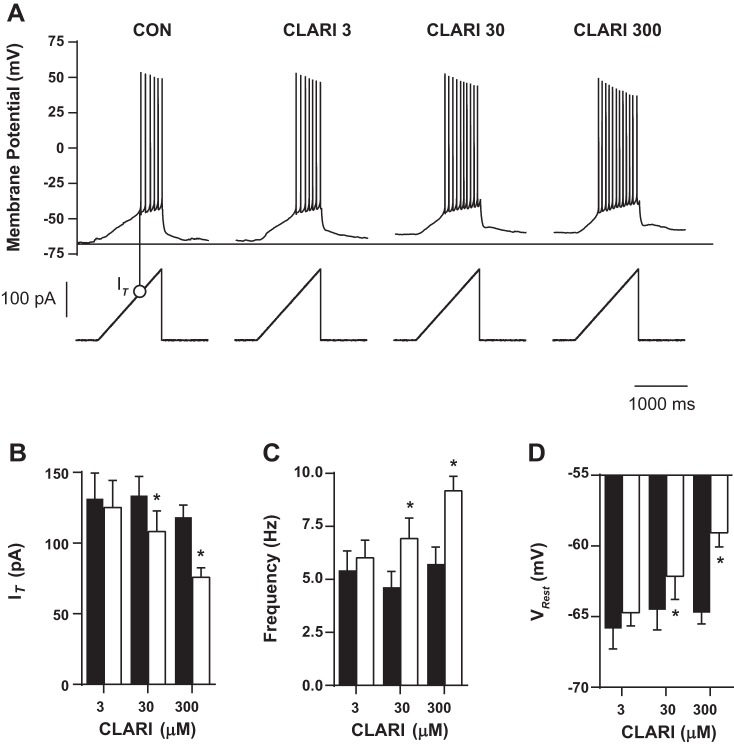
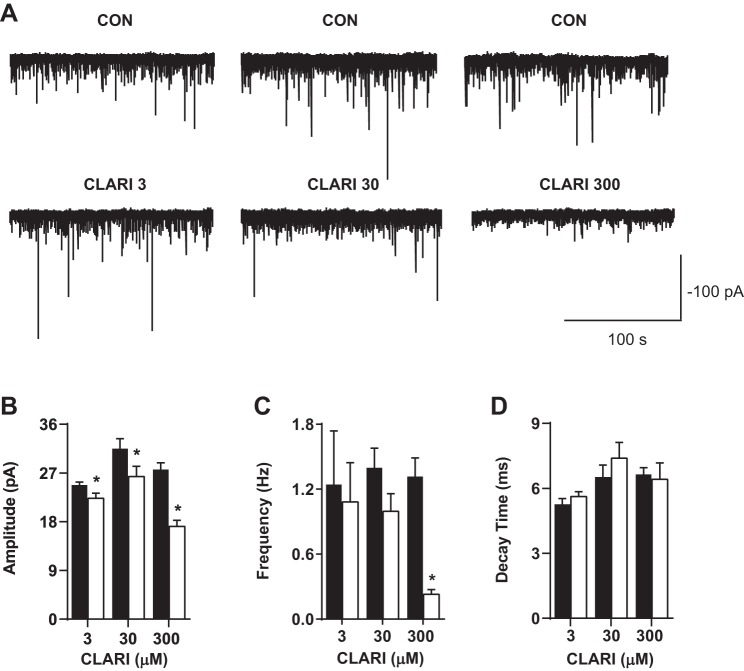
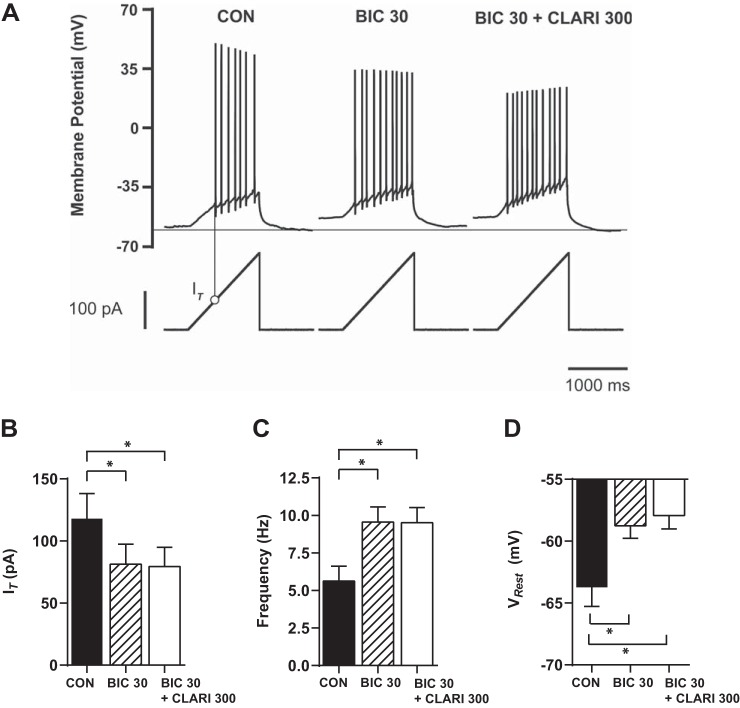
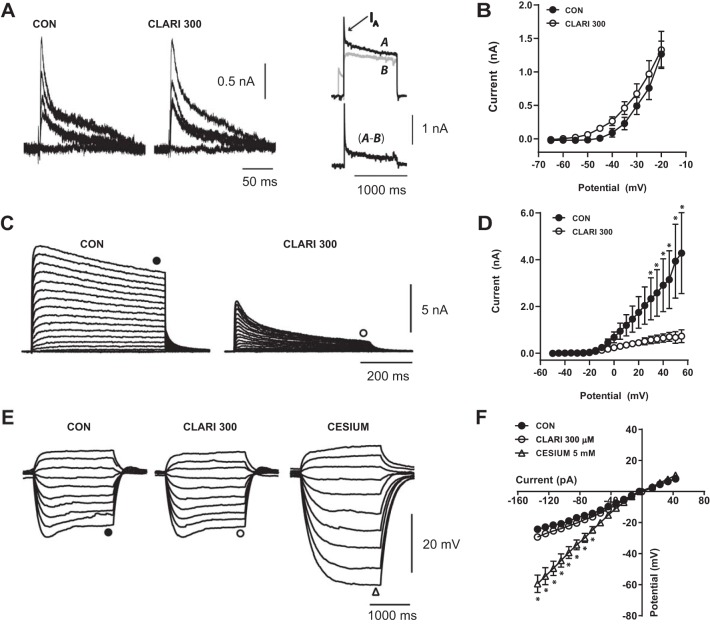
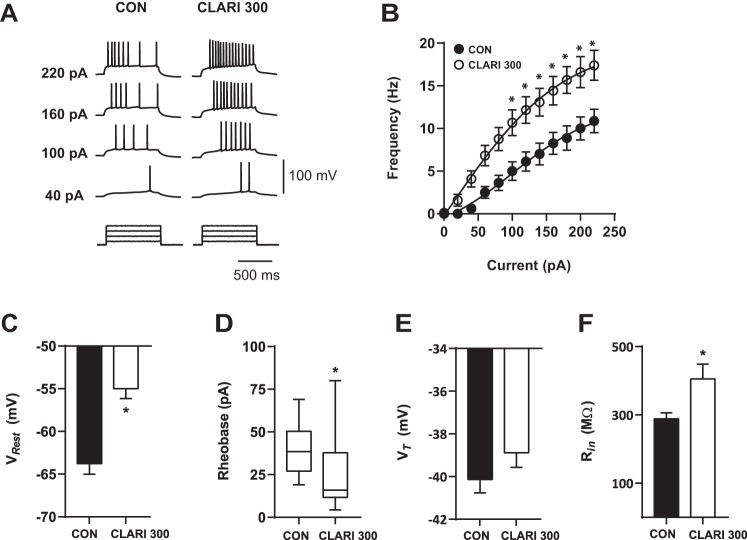
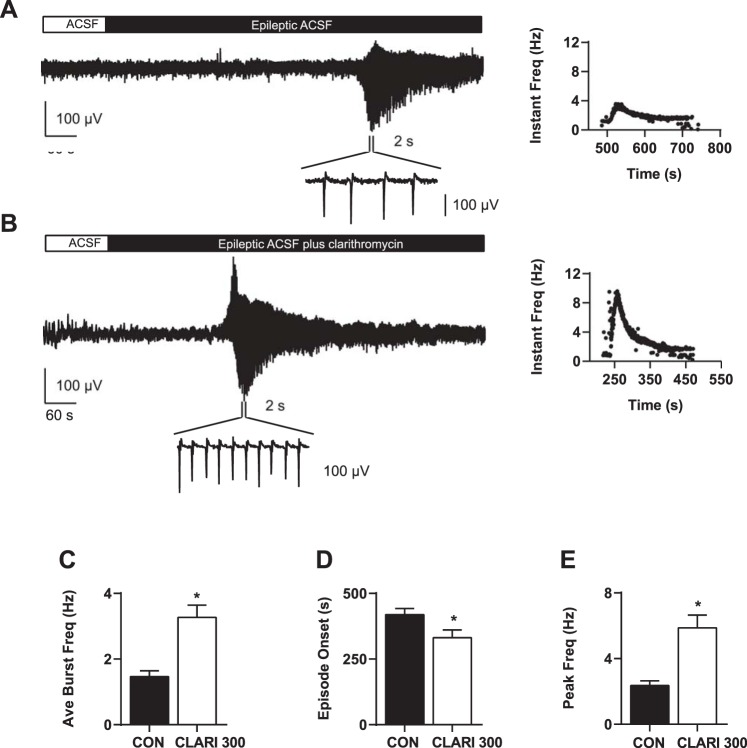
Antibiotics are used in the treatment and prevention of bacterial infections, but effects on neuron excitability have been documented. A recent study demonstrated that clarithromycin alleviates daytime sleepiness in hypersomnia patients (Trotti LM, Saini P, Freeman AA, Bliwise DL, García PS, Jenkins A, Rye DB. J Psychopharmacol 28: 697-702, 2014). To explore the potential application of clarithromycin as a stimulant, we performed whole cell patch-clamp recordings in rat pyramidal cells from the CA3 region of hippocampus. In the presence of the antibiotic, rheobase current was reduced by 50%, F-I relationship (number of action potentials as a function of injected current) was shifted to the left, and the resting membrane potential was more depolarized. Clarithromycin-induced hyperexcitability was dose dependent; doses of 30 and 300 μM clarithromycin significantly increased the firing frequency and membrane potential compared with controls (P = 0.003, P < 0.0001). We hypothesized that clarithromycin enhanced excitability by reducing GABAA receptor activation. Clarithromycin at 30 μM significantly reduced (P = 0.001) the amplitude of spontaneous miniature inhibitory GABAergic currents and at 300 μM had a minor effect on action potential width. Additionally, we tested the effect of clarithromycin in an ex vivo seizure model by evaluating its effect on spontaneous local field potentials. Bath application of 300 μM clarithromycin enhanced burst frequency twofold compared with controls (P = 0.0006). Taken together, these results suggest that blocking GABAergic signaling with clarithromycin increases cellular excitability and potentially serves as a stimulant, facilitating emergence from anesthesia or normalizing vigilance in hypersomnia and narcolepsy. However, the administration of clarithromycin should be carefully considered in patients with seizure disorders.

New & noteworthy: Clinical administration of the macrolide antibiotic clarithromycin has been associated with side effects such as mania, agitation, and delirium. Here, we investigated the adverse effects of this antibiotic on CA3 pyramidal cell excitability. Clarithromycin induces hyperexcitability in single neurons and is related to a reduction in GABAergic signaling. Our results support a potentially new application of clarithromycin as a stimulant to facilitate emergence from anesthesia or to normalize vigilance.

Keywords: GABAA receptor; clarithromycin; hippocampus; neuronal excitability.


Figures

Fig. 1.
Fig. 1.
Clarithromycin induced hyperexcitability in CA3 region of hippocampus. A: characteristic voltage responses to increasing current injections (bottom) recorded in a representative neuron in control bath solution (CON; left) and after 5-min acute application of 300 μM clarithromycin (CLARI 300; right). To block glutamatergic synaptic inputs, AMPA/kainate and NMDA receptor antagonists CNQX (10 μM) and d-AP5 (50 μM) were applied in both situations. B: short-term bath exposure to 300 μM clarithromycin significantly enhanced firing frequency and shifted the F-I curve to the left compared with controls (CON) (n = 11, 2-way repeated-measures ANOVA, *P < 0.0001). Each symbol represents mean ± SE. C: characteristic single action potential response (top) to minimum current injection (bottom) from the neuron in A. Rheobase current was reduced by half in the presence of 300 μM clarithromycin (right). Thin horizontal lines illustrate levels of resting membrane potential (VRest). In this example, clarithromycin administration depolarized VRest ∼5 mV compared with baseline (−65 mV). D: lines indicate paired measurements in the same neuron in controls (●) and washed in clarithromycin ACSF (○). In 13 tested cells, 5- to 10-min exposure to antibiotic+ACSF significantly decreased rheobase current vs. controls (CON: 66.8 ± 12.2 pA, CLARI 300: 25.1 ± 4.1 pA; paired t-test, *P = 0.003). Symbols on left and right represent average values ± SE.
Fig. 2.
Fig. 2.
Clarithromycin-induced hyperexcitability is dose dependent. A: characteristic voltage responses (top) to an injected current ramp (bottom). Minimum injected ramp current initializing action potentials was measured. Action potential threshold current (IT) is designated for the control experiment by a thin vertical line with an open circle and summarized in B. Horizontal line indicates level of VRest in control conditions (CON). B–D: neurons were exposed to different clarithromycin concentrations. Each neuron was also exposed to control conditions and acts as its own control. Bar graph pairs represent average values ± SE in controls (filled bars) and in clarithromycin (open bars). Doses of 30 and 300 μM clarithromycin significantly affected neuronal firing expressed as IT (CON vs. CLARI 3: n = 7, CON vs. CLARI 30: n = 12, CON vs. CLARI 300: n = 20; paired t-test, P = 0.2, *P = 0.002, *P = 0.0001, respectively), frequency (n = 7, n = 12, n = 20; paired t-test, P = 0.1, *P = 0.003, *P < 0.0001), and depolarized VRest (n = 7, n = 13, n = 21; paired t-test, P = 0.3, *P = 0.04, *P < 0.0001).
Fig. 3.
Fig. 3.
Clarithromycin inhibits miniature GABAergic currents. A: representative traces of mIPSC recordings from 3 representative neurons bathed in ACSF containing CNQX, d-AP5, and TTX before (top) and after (bottom) application of clarithromycin. B–D: bar graph pairs represent average values ± SE in controls (filled bars) and in 3, 30, and 300 μM clarithromycin (open bars). B: mIPSC amplitude was significantly reduced in the presence of all tested concentrations of clarithromycin (CON vs. CLARI 3: 24.8 ± 0.6 pA vs. 22.3 ± 0.9 pA, n = 15; CON vs. CLARI 30: 31.5 ± 1.9 pA vs. 26.4 ± 1.9 pA, n = 12; CON vs. CLARI 300: 27.6 ± 1.2 pA vs. 17.1 ± 1.1 pA, n = 9; paired t-test, *P = 0.02, *P = 0.001, *P = 0.0001, respectively). C: the frequency of current events was almost completely abolished at high dose (CON vs. CLARI 300: 1.3 ± 0.5 Hz vs. 0.23 ± 0.14 Hz; n = 9; paired t-test, *P = 0.0001). D: decay time was not changed with clarithromycin application (P > 0.1).
Fig. 4.
Fig. 4.
GABAA receptor antagonism occludes the effect of 300 μM clarithromycin. A: characteristic voltage responses (top) to an injected current ramp (bottom) for a representative neuron in control ACSF (left), 5 min after acute bath application of 30 μM bicuculline (BIC 30; center) and in ACSF containing both 300 μM clarithromycin and 30 μM bicuculline (BIC 30+CLARI 300; right). B–D: bar graphs represents average values ± SE in control conditions (filled bars), in the presence of bicuculline (hatched bars), and in the presence of bicuculline and clarithromycin combined (open bars). Bicuculline alone significantly affected neuronal firing expressed as reduction in IT (B; CON vs. BIC 30: n = 11; 2-way repeated-measures ANOVA, *P = 0.02), increased firing frequency (C; n = 14; 2-way repeated-measures ANOVA, *P < 0.001), and depolarized VRest (D; n = 14; 2-way repeated-measures ANOVA, *P < 0.0001). Application of clarithromycin to neurons previously exposed to bicuculline did not induce additional effects on IT (BIC 30 vs. BIC 30+CLARI 300: 81.3 ± 16.1 pA vs. 79.4 ± 15.5 pA; n = 11; 2-way repeated-measures ANOVA, P > 0.9), frequency (BIC 30 vs. BIC 30+CLARI 300: 9.5 ± 1.0 Hz vs. 9.5 ± 1.0 Hz; n = 14; 2-way repeated-measures ANOVA, P > 0.9), and VRest (BIC 30 vs. BIC 30+CLARI 300: −58.7 ± 1.0 mV vs. −57.9 ± 1.1 mV; n = 14; 2-way repeated-measures ANOVA, P > 0.9).
Fig. 5.
Fig. 5.
Acute 300 μM clarithromycin affects sustained K+ currents during repolarization. A: representative isolated IA current traces activated by 1-s steps to potentials −65, −35, −30, −25, −20 mV from a holding potential of −80 mV in controls (left) and after 5 min of clarithromycin treatment (center). Top right: representative K+ currents (A, black trace) elicited by depolarizing step to −10 mV from a holding potential of −80 mV. To isolate IA from total K+ current the same voltage step was preceded by a brief (100 ms) prepulse to −40 mV (B, gray trace). Bottom right: difference current (A − B) reveals a fast-inactivating K+ current IA. B: peak current-voltage relationships remain the same after 5-min exposure to clarithromycin (n = 7, 2-way repeated-measures ANOVA, P > 0.9). C: representative sustained K+ current evoked by depolarizing 5-mV steps (ranging from −55 to 50 mV) from a −40-mV holding potential obtained in control (left) and in the presence of clarithromycin ACSF (right) in the same neuron. D: clarithromycin reduces sustained K+ current compared with controls (n = 5, 2-way repeated-measures ANOVA, *P < 0.01). E and F: characteristic membrane potential responses to hyperpolarizing and depolarizing 20-pA current steps (ranged from −130 to 50 pA of resting membrane potential −65.4 mV) in the representative neuron. E: voltage “sag” resulting from activation of Ih in controls (left) was still present in 300 μM of clarithromycin (center). F: I-V relationship between steady-state amplitude and injected current did not change after antibiotic exposure (CON vs. CLARI 300; n = 7; 2-way repeated-measures ANOVA, P ≥ 0.26). To distinguish Ih currents, external Cs+ (Ih antagonist) was added, resulting in blockade of characteristic “sag” current (E, right) and a linear voltage-current relationship below −15 mV (cesium vs. CON, cesium vs. CLARI 300; n = 7; 2-way repeated-measures ANOVA, *P ≤ 0.025; F). Each symbol represents mean ± SE.
Fig. 6.
Fig. 6.
Preincubation of clarithromycin maintains hyperexcitability in CA3 neurons. A: characteristic voltage responses to increasing current injections (bottom) recorded in a representative neuron in control bath solution (left) and after 2–4 h of incubation in ACSF containing 300 μM clarithromycin (right). To block glutamatergic synaptic inputs, AMPA/kainate and NMDA receptor antagonists CNQX (10 μM) and d-AP5 (50 μM) were applied in both situations. Neurons recorded after preincubation in clarithromycin solution showed an increase in firing frequency compared with matched controls. B: enhanced firing frequency is demonstrated after preincubation in clarithromycin compared with controls (CON: n = 10; CLARI 300: n = 11; 2-way repeated-measures ANOVA, *P ≤ 0.018). Each circle represents mean ± SE. C: differences in VRest appeared in neurons after preincubation in the antibiotic (CON vs. CLARI 300; unpaired t-test, *P = 0.00001). D: clarithromycin induced a decrease in rheobase current compared with controls (CON vs. CLARI 300; Mann-Whitney test, *P = 0.035). Box and whisker plots represent medians, quartiles, and 5–95% percentiles. E: voltage threshold (VT) showed no changes in clarithromycin-preincubated neurons compared with controls (unpaired t-test, P = 0.2). F: input resistance (Rin) after preincubation of 300 μM clarithromycin changed significantly (unpaired t-test, *P = 0.03).
Fig. 7.
Fig. 7.
Clarithromycin-enhanced seizurelike activity in an ex vivo epilepsy model. A and B: examples of spontaneous local field potential recordings from representative slices perfused with epileptogenic solution (A) and with epileptogenic solution + 300 μM clarithromycin in ACSF (B). Relative distributions of instantaneous burst frequencies are shown on right. C–E: epileptogenic ACSF + 300 μM clarithromycin elicited greater average burst frequencies (C) and higher peak frequency (E) compared with control conditions (burst frequency CON vs. CLARI 300: 1.5 ± 0.2 Hz vs. 3.3 ± 0.4 Hz; n = 11 each; unpaired t-test, *P = 0.0006; peak frequency CON vs. CLARI 300: 2.4 ± 0.3 Hz vs. 5.9 ± 0.8 Hz; unpaired t-test, *P = 0.001). D: onset of seizure burst activity in the clarithromycin/epileptic condition occurred significantly earlier compared with the control group (CON vs. CLARI 300: 419.3 ± 23.0 s, n = 10 vs. 331 ± 29.8 s, n = 11; unpaired t-test, *P = 0.03). All bars represent means ± SE.

References

    1. Abouesh A, Stone C, Hobbs WR. Antimicrobial-induced mania (antibiomania): a review of spontaneous reports. J Clin Psychopharmacol 22: 71–81, 2002. - PubMed
    1. Bhattacharyya S, Darby RR, Raibagkar P, Castro LN, Berkowitz AL. Antibiotic-associated encephalopathy. Neurology 86: 963–971, 2016. - PubMed
    1. Bianchi MT. Context dependent benzodiazepine modulation of GABAA receptor opening frequency. Curr Neuropharmacol 8: 10–17, 2010. - PMC - PubMed
    1. Chu S, Deaton R, Cavanaugh J. Absolute bioavailability of clarithromycin after oral administration in humans. Antimicrob Agents Chemother 36: 1147–1150, 1992. - PMC - PubMed
    1. Chu SY, Sennello LT, Sonders RC. Simultaneous determination of clarithromycin and 14(R)-hydroxyclarithromycin in plasma and urine using high-performance liquid chromatography with electrochemical detection. J Chromatogr 571: 199–208, 1991. - PubMed

Publication types

MeSH terms

LinkOut - more resources