. 2016 Dec;359(3):460-470.
doi: 10.1124/jpet.116.236000. Epub 2016 Oct 12.

Modafinil Activates Phasic Dopamine Signaling in Dorsal and Ventral Striata

Affiliations

Modafinil Activates Phasic Dopamine Signaling in Dorsal and Ventral Striata

Martin J Bobak et al. J Pharmacol Exp Ther. 2016 Dec.

Abstract

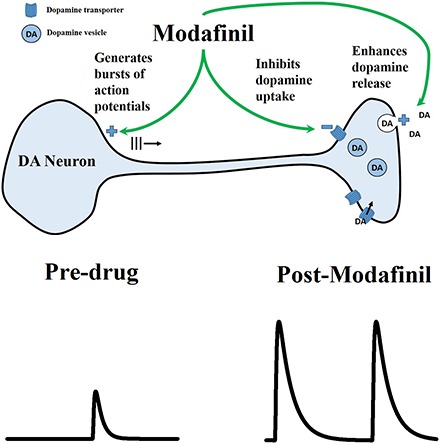
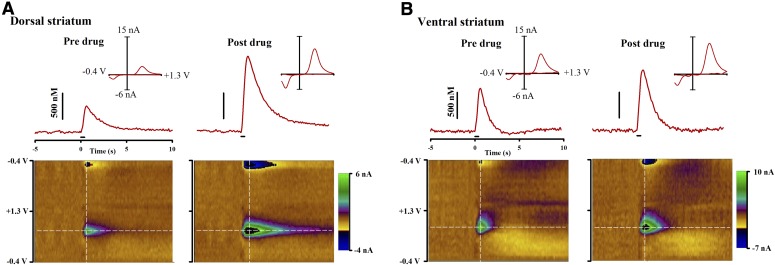
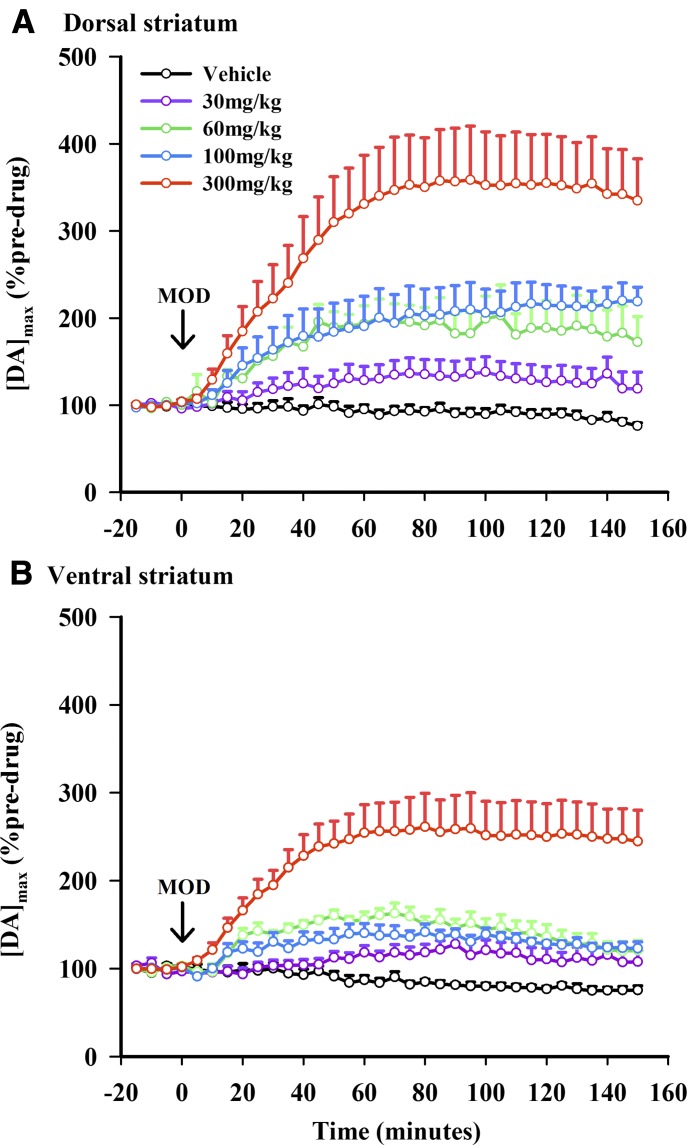
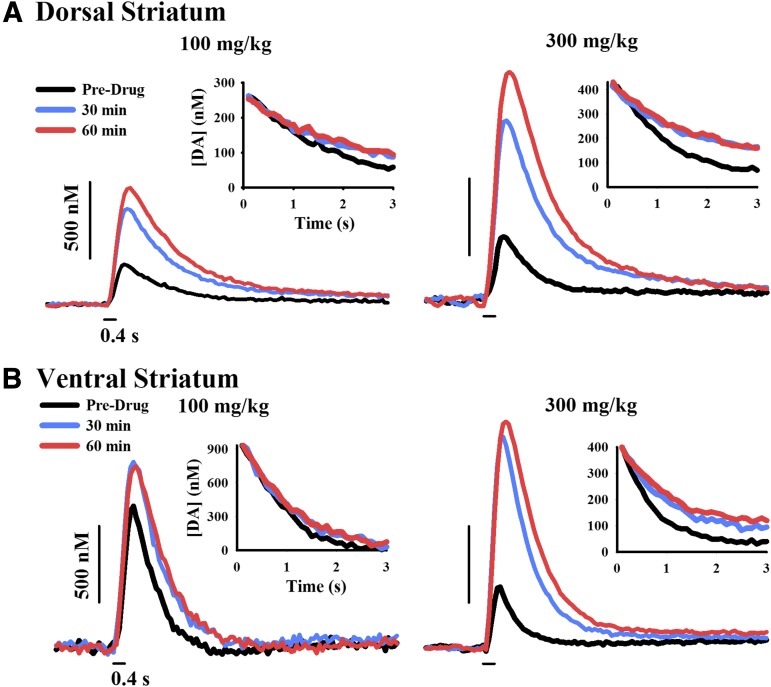
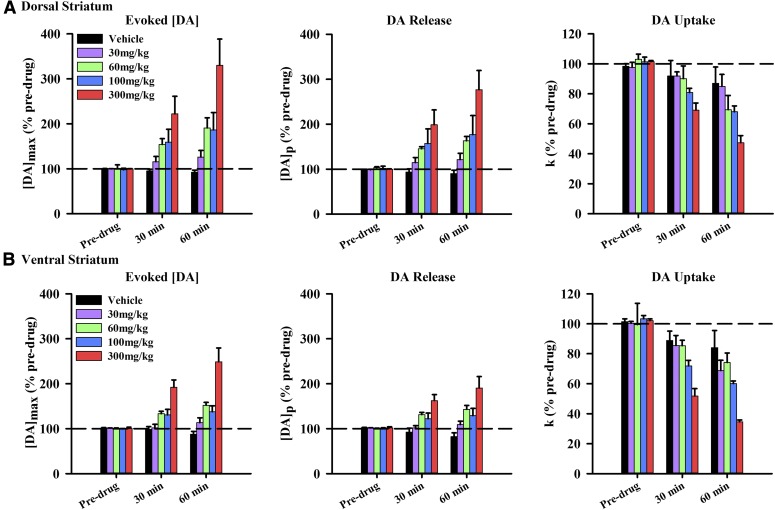
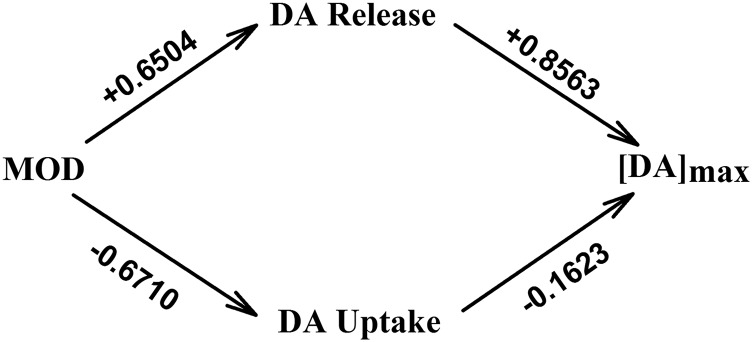
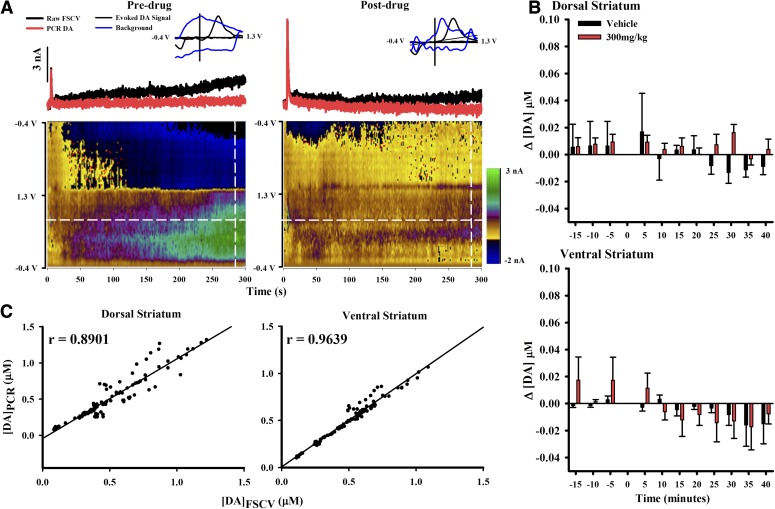
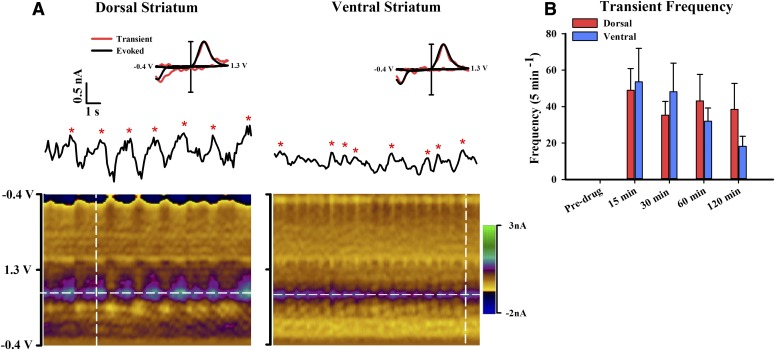
Modafinil (MOD) exhibits therapeutic efficacy for treating sleep and psychiatric disorders; however, its mechanism is not completely understood. Compared with other psychostimulants inhibiting dopamine (DA) uptake, MOD weakly interacts with the dopamine transporter (DAT) and modestly elevates striatal dialysate DA, suggesting additional targets besides DAT. However, the ability of MOD to induce wakefulness is abolished with DAT knockout, conversely suggesting that DAT is necessary for MOD action. Another psychostimulant target, but one not established for MOD, is activation of phasic DA signaling. This communication mode during which burst firing of DA neurons generates rapid changes in extracellular DA, the so-called DA transients, is critically implicated in reward learning. Here, we investigate MOD effects on phasic DA signaling in the striatum of urethane-anesthetized rats with fast-scan cyclic voltammetry. We found that MOD (30-300 mg/kg i.p.) robustly increases the amplitude of electrically evoked phasic-like DA signals in a time- and dose-dependent fashion, with greater effects in dorsal versus ventral striata. MOD-induced enhancement of these electrically evoked amplitudes was mediated preferentially by increased DA release compared with decreased DA uptake. Principal component regression of nonelectrically evoked recordings revealed negligible changes in basal DA with high-dose MOD (300 mg/kg i.p.). Finally, in the presence of the D2 DA antagonist, raclopride, low-dose MOD (30 mg/kg i.p.) robustly elicited DA transients in dorsal and ventral striata. Taken together, these results suggest that activation of phasic DA signaling is an important mechanism underlying the clinical efficacy of MOD.


Figures

None
Graphical abstract
Fig. 1.
Fig. 1.
MOD (100 mg/kg i.p.) effects on electrically evoked phasic-like DA signals in dorsal (A) and ventral (B) striata measured by FSCV. (Top) Evoked DA signals elicited by electrical stimulation (demarcated by black line at time 0 seconds) predrug (left) and 60 minutes post-MOD (right). (Inset) Individual background-subtracted cyclic voltammogram taken from the peak signal (white vertical line) identifies the analyte as DA. (Bottom) Pseudo-color plot serially displaying all background-subtracted cyclic voltammograms (x-axis: time; y-axis: applied potential; z-axis: current). White horizontal line identifies the DA peak oxidative potential where the evoked DA trace was collected.
Fig. 2.
Fig. 2.
MOD elicits time- and dose-dependent effects on the maximal concentration of the electrically evoked phasic-like DA signal ([DA]max) in dorsal (A) and ventral (B) striata. Data are expressed as a percentage of predrug and are the mean ± S.E.M. Arrow demarcates MOD administration at time 0 minutes. Data were analyzed for significance using three-way repeated measures ANOVA (n = 4–7).
Fig. 3.
Fig. 3.
Representative time- and dose-dependent effects of MOD on the extracellular clearance of electrically evoked DA in dorsal (A) and ventral (B) striata. FSCV traces of the electrically evoked DA signal (stimulus demarcated by short black lines) are shown for 100 mg/kg MOD (left) and 300 mg/kg MOD (right) at select time points. (Inset) Pre- and postdrug clearance curves are overlaid beginning at the same DA concentration and illustrate DA uptake inhibition.
Fig. 4.
Fig. 4.
Effects of MOD on presynaptic DA release and uptake. Increases in the maximal concentration of the electrically evoked phasic-like DA signal ([DA]max) (left) are associated with an increase in DA release or [DA]p (middle) and a decrease in DA uptake or k (right) in dorsal (A) and ventral (B) striata. Data are expressed as a percentage of predrug and are the mean ± S.E.M. Data were analyzed for significance using three-way repeated measures ANOVA (n = 4–7).
Fig. 5.
Fig. 5.
Path analysis model demonstrating the direct relationships between dose, DA release ([DA]p), DA uptake (k), and [DA]max. Values given above each arrow are standardized path coefficients describing each direct effect. Two indirect effects of MOD on [DA]max are described by the two paths from MOD to [DA]max through DA release and DA uptake.
Fig. 6.
Fig. 6.
MOD effects on changes in basal DA in dorsal and ventral striata. (A) The red line displays PCR-resolved DA changes from the black FSCV trace (taken at the white horizontal line) for predrug and 60 minutes postdrug (300 mg/kg). A pseudo-color plot beneath displays all background-subtracted cyclic voltammograms. (Inset) Representative voltammogram (blue) collected at 285 seconds (white vertical line) overlaid with a voltammogram taken at peak electrically evoked signal (black). The y-axis is the normalized current. (B) PCR reveals no significant effect of MOD on basal DA in dorsal (top) and ventral (bottom) striata. Data were analyzed for significance using three-way repeated measures ANOVA (n = 4). (C) Verification of PCR selectivity for the DA component in FSCV recordings. There was a strong correlation between [DA]max measured with FSCV ([DA]FSCV) and PCR ([DA]PCR) in both dorsal (left) and ventral (right) striata.
Fig. 7.
Fig. 7.
DA transients are elicited in both dorsal and ventral striata by coadministration of MOD (30 mg/kg) and raclopride (2 mg/kg). (A) Representative recording of DA transients in dorsal (left) and ventral (right) striata. The pseudo-color plots (underneath) serially display all background-subtracted cyclic voltammograms. Transients (denoted by red asterisks) are displayed in the FSCV current trace collected at the peak oxidative potential of DA (white horizontal lines). (Inset) Normalized background-subtracted cyclic voltammograms taken from the electrically evoked response (black lines) and a DA transient (red lines) collected at the white vertical lines in the pseudo-color plots. (B) Average transient frequency per 5-minute epoch for pre- and postdrug administration expressed as mean ± S.E.M. Data were analyzed for significance using two-way repeated measures ANOVA.

References

    1. Anderson AL, Li SH, Biswas K, McSherry F, Holmes T, Iturriaga E, Kahn R, Chiang N, Beresford T, Campbell J, et al. (2012) Modafinil for the treatment of methamphetamine dependence. Drug Alcohol Depend 120:135–141. - PMC - PubMed
    1. Anderson AL, Reid MS, Li SH, Holmes T, Shemanski L, Slee A, Smith EV, Kahn R, Chiang N, Vocci F, et al. (2009) Modafinil for the treatment of cocaine dependence. Drug Alcohol Depend 104:133–139. - PMC - PubMed
    1. Anderson DR. (2008) Model Based Inference in the Life Sciences. A Primer on Evidence, Springer Science Business Media, New York.
    1. Aragona BJ, Cleaveland NA, Stuber GD, Day JJ, Carelli RM, Wightman RM. (2008) Preferential enhancement of dopamine transmission within the nucleus accumbens shell by cocaine is attributable to a direct increase in phasic dopamine release events. J Neurosci 28:8821–8831. - PMC - PubMed
    1. Atcherley CW, Wood KM, Parent KL, Hashemi P, Heien ML. (2015) The coaction of tonic and phasic dopamine dynamics. Chem Commun (Camb) 51:2235–2238. - PMC - PubMed