

Charging of Proteins in Native Mass Spectrometry
- PMID: 27734326
- PMCID: PMC5283922
- DOI: 10.1007/s13361-016-1517-7
Charging of Proteins in Native Mass Spectrometry
Abstract
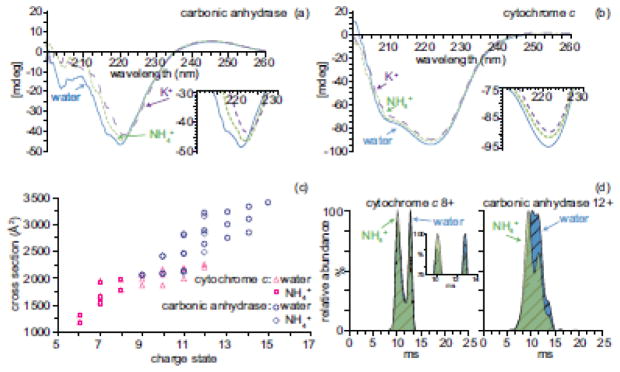
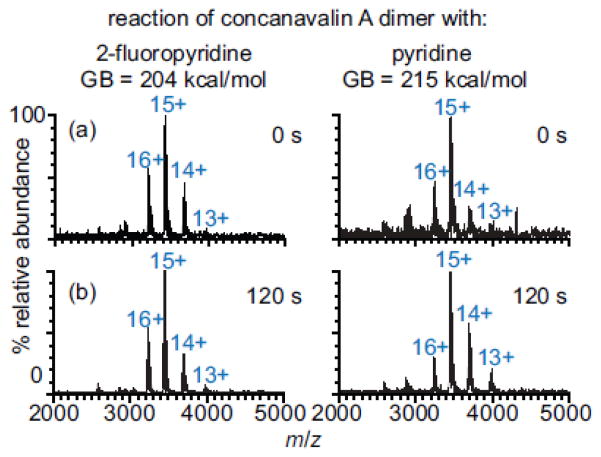
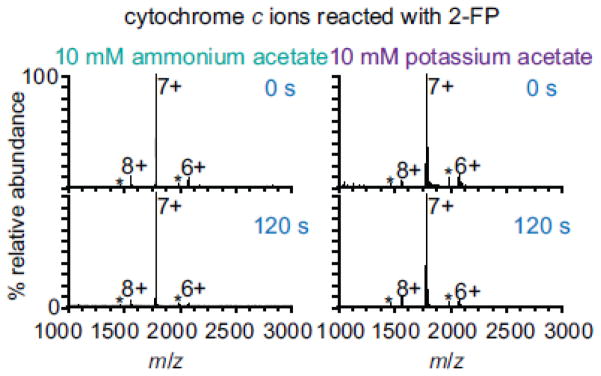
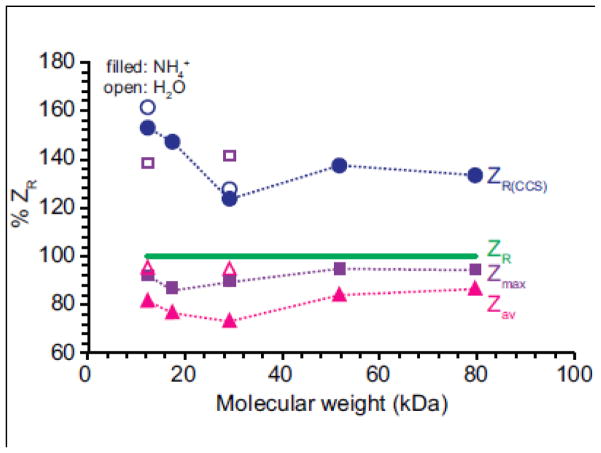
Factors that influence the charging of protein ions formed by electrospray ionization from aqueous solutions in which proteins have native structures and function were investigated. Protein ions ranging in molecular weight from 12.3 to 79.7 kDa and pI values from 5.4 to 9.6 were formed from different solutions and reacted with volatile bases of gas-phase basicities higher than that of ammonia in the cell of a Fourier-transform ion cyclotron resonance mass spectrometer. The charge-state distribution of cytochrome c ions formed from aqueous ammonium or potassium acetate is the same. Moreover, ions formed from these two solutions do not undergo proton transfer to 2-fluoropyridine, which is 8 kcal/mol more basic than ammonia. These results provide compelling evidence that proton transfer between ammonia and protein ions does not limit protein ion charge in native electrospray ionization. Both circular dichroism and ion mobility measurements indicate that there are differences in conformations of proteins in pure water and aqueous ammonium acetate, and these differences can account for the difference in the extent of charging and proton-transfer reactivities of protein ions formed from these solutions. The extent of proton transfer of the protein ions with higher gas-phase basicity bases trends with how closely the protein ions are charged to the value predicted by the Rayleigh limit for spherical water droplets approximately the same size as the proteins. These results indicate that droplet charge limits protein ion charge in native mass spectrometry and are consistent with these ions being formed by the charged residue mechanism. Graphical Abstract ᅟ.
Keywords: Ammonium; Apparent gas-phase basicity; Charged residue mechanism; Charging; Charging mechanism; Circular dichroism; Combined charged residue-field emission model; ESI; Electrospray; Electrospray ionization; Gas-phase basicity; Ion mobility; Mechanism; Native ESI; Native MS; Native electrospray; Native mass spec; Native mass spectrometry; Protein ion charging; Proton transfer; Rayleigh limit; Salts.
Figures
References
-
- Fenn JB, Mann M, Meng CK, Wong SF, Whitehouse CM. Electrospray ionization–principles and practice. Mass Spectrom Rev. 1990;9:37–70.
-
- Kebarle P, Verkerk UH. Electrospray: from ions in solution to ions in the gas phase, what we know now. Mass Spectrom Rev. 2009;28:898–917. - PubMed
-
- Chowdhury SK, Katta V, Chait BT. Probing conformational changes in proteins by mass spectrometry. J Am Chem Soc. 1990;112:9012–9013.
-
- Dobo A, Kaltashov IA. Detection of multiple protein conformational ensembles in solution via deconvolution of charge-state distributions in ESI MS. Anal Chem. 2001;73:4763–4773. - PubMed
-
- Loo JA, Loo RRO, Udseth HR, Edmonds CG, Smith RD. Solvent-induced conformational changes of polypeptides probed by electrospray-ionization mass spectrometry. Rapid Commun Mass Spectrom. 1991;5:101–105. - PubMed
MeSH terms
Substances
Grants and funding
LinkOut - more resources
Full Text Sources
Other Literature Sources
Research Materials
Miscellaneous
