. 2016 Nov;5(11):3147-3155.
doi: 10.1002/cam4.851. Epub 2016 Oct 13.

Hyperbaric oxygen therapy sensitizes nimustine treatment for glioma in mice

Affiliations

Hyperbaric oxygen therapy sensitizes nimustine treatment for glioma in mice

Zhaohui Lu et al. Cancer Med. 2016 Nov.

Abstract

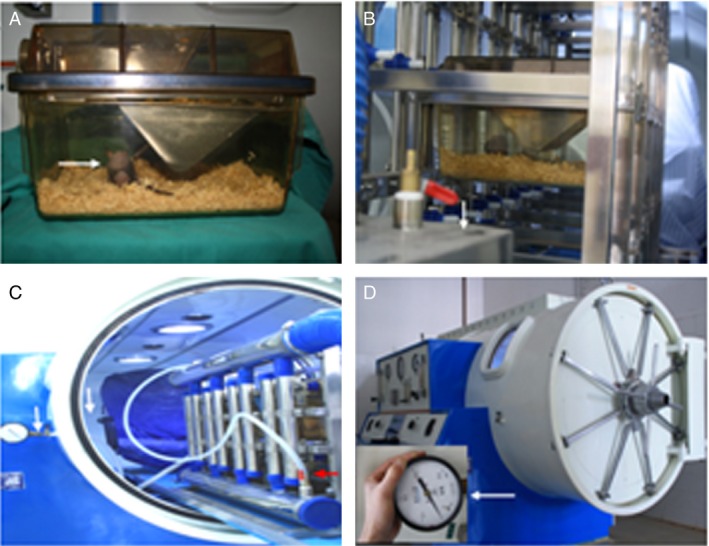
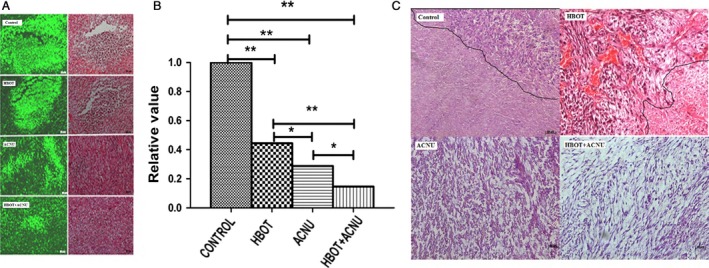
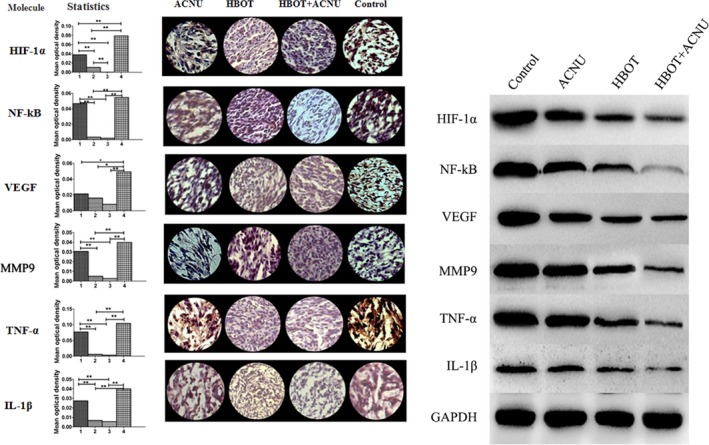
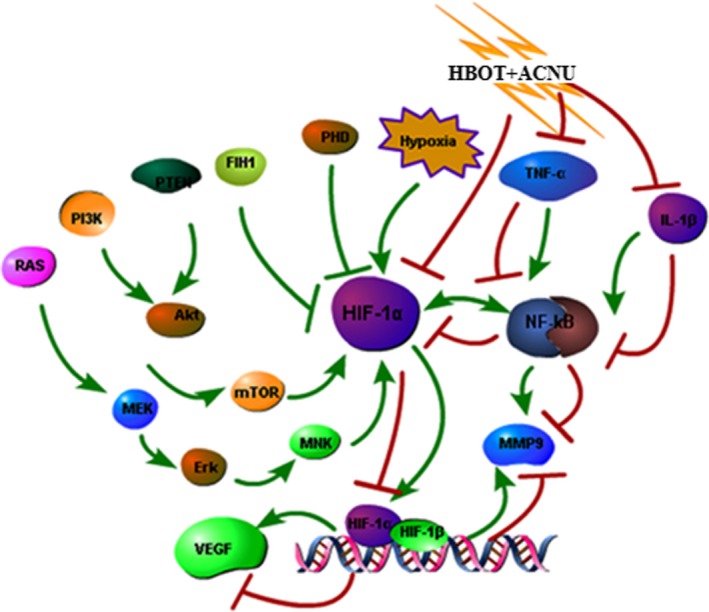
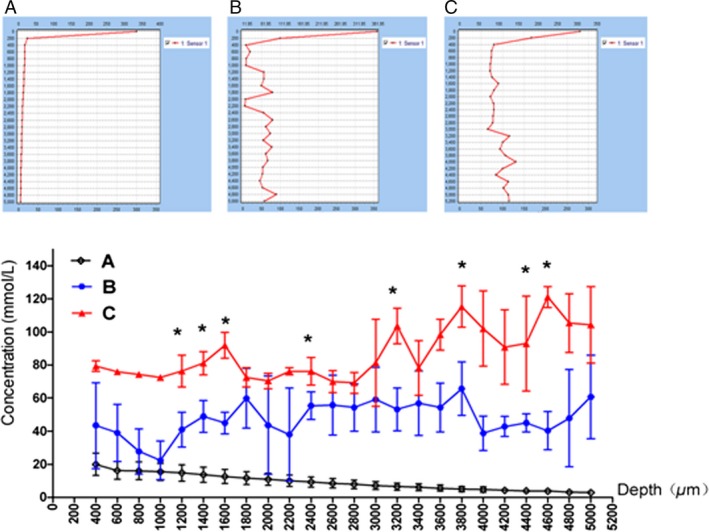
Nimustine (ACNU) has antitumor activities in patients with malignant glioma. Hyperbaric oxygen (HBO) may enhance the efficacy of certain therapies that are hampered by the hypoxic microenvironment. We examined the combined effects of ACNU and HBO in a GFP transgenic nude mice bearing human glioma model. Mice inoculated with human glioma cells SU3 were randomly divided into the four groups: (A) the control group, (B) the HBOT (HBO therapy) group, (C) the ACNU group, and (D) the HBOT+ACNU group. Tumor size was measured at the indicated time intervals with a caliper; mice were sacrificed 28 days after treatment, and immunohistochemistry staining and western blot analysis were carried out. By the end of the trial, the tumor weights of groups A, B, C, and D were (P < 0.05), 6.03 ± 1.47, 4.13 ± 1.82 (P < 0.05), 2.39 ± 0.25 (P < 0.05), and 1.43 ± 0.38 (P < 0.01), respectively. The expressions of TNF-α, MMP9, HIF-α, VEGF, NF-κB, and IL-1β were associated with the infiltration of inflammatory cells and the inhibition rate of tumor cells. Hyperbaric oxygen therapy (HBOT) could inhibit glioma cell proliferation and inflammatory cell infiltration, and exert a sensitizing effect on ACNU therapy partially through enhancing oxygen pressure (PO2 ) in tumor tissues and lower expression levels of HIF-1α, TNF-α, IL-1β, VEGF, MMP9, and NF-κB.

Keywords: Chemotherapy; glioma stem cell; green fluorescence transgenic nude mice; hyperbaric oxygen therapy; immunity inflammation; transplantation model.


Figures

Figure 1
Figure 1
Hyperbaric oxygen—individual‐ventilated cage (HBO‐IVC) system. (A) A tumor‐bearing mouse (arrow) inside the IVC; (B) fully enclosed transport channel and the air filter apparatus (arrow) connecting the feeding room to the hyperbaric oxygen therapy (HBOT) room; (C) standby HBOIVC with plastic hose connecting the exhaust manifold (red arrow) and the pressure valve (white arrow) on the window; (D) working HBOIVC with manometer monitoring the pressure inside IVC. The mice were divided into the four groups randomly, and each group had five mice, as shown in the Material and Methods section.
Figure 2
Figure 2
The tumor volume and weight of the tumor‐bearing mice. (A) A comparison of the proliferation rates of transplanted tumors in different groups: proliferation rates in the control group, the hyperbaric oxygen therapy (HBOT) group, the nimustine (ACNU) group, and the HBOT+ACNU group reduced in turn. (B) Comparison of tumor mass in different groups. *< 0.05, **< 0.01. The mice were divided into the four groups randomly, and each group had five mice, as shown in the Material and Methods section.
Figure 3
Figure 3
Observation of host cell infiltration (green) in necrotic tumor tissue and H&E‐stained transplanted tumors. (A) Host cell infiltration (green) in necrotic tumor tissue under a microscope. One H&E‐stained tissue section under fluorescent light and white light of a fluorescent microscope. The numbers of infiltrating cells with green fluorescence were different between the groups due to various sizes of necrotic areas; (B) for host cell infiltration (green) in necrotic tumor tissue, the relative ratios of the total intensity of green fluorescence in the control group to those in the other groups measured by Image‐Pro Plus 6.0 software. (C) H&E‐stained transplanted tumors under an optical microscope. The control group: necrotic areas with unclear tissue structure on the bottom left of the figure and non‐necrotic areas on the upper right, with a compact oncocytes arrangement, deeply stained nucleus, and distinct morphological changes. The hyperbaric oxygen therapy (HBOT) group: necrotic areas with unclear tissue structure on the bottom right of the figure and non‐necrotic areas on the upper left, with a compact oncocytes arrangement, deeply stained nucleus, distinct morphological changes, and many blood vessels. It was hard to determine necrotic areas in the nimustine (ACNU) group and the HBOT+ACNU group under an optical microscope. The cell arrangement of non‐necrotic areas was looser in the ACNU group than in the HBOT+ACNU group. The scale bar: 20×. The mice were divided into the four groups randomly, and each group had five mice, as shown in the Material and Methods section. *P < 0.05; **P < 0.01
Figure 4
Figure 4
Statistical chart of the gray values obtained from immunohistochemical analysis of relevant proteins in hyperbaric oxygen therapy (HBOT) combined with nimustine (ACNU) therapy. The left side showed the gray values; the middle part showed immunohistochemically stained samples under a microscope (40×); the right side showed expression levels of HIF‐1α, TNFα, IL‐1β, VEGF, MMP9, and NFκB, using western blotting method, with endogenous GAPDH as internal control. The x‐axis of the histogram showed the ACNU group (1), the HBOT group (2), the HBOT+ACNU group (3), and the control group (4), respectively; the y‐axis indicated mean optical density. The mice were divided into the four groups randomly, and each group had five mice, as shown in the Material and Methods section. *P < 0.05; **P < 0.01
Figure 5
Figure 5
Diagram of hyperbaric oxygen therapy‐induced HIFTNFNFκB regulatory network.
Figure 6
Figure 6
Determination of oxygen content in brain of rats after hyperbaric oxygen therapy (HBOT) by microelectrode. The vertical coordinate was oxygen concentration (mmol/L) and the horizontal coordinate was the probe into the depth of brain tissue (mm).*< 0.05. The mice were divided into the four groups randomly, and each group had five mice, as shown in the Material and Methods section.

References

    1. Yan, L. , Liang T., and Cheng O.. 2015. Hyperbaric oxygen therapy in China. Med. Gas Res. 5:3. - PMC - PubMed
    1. Wenwu, L. , Xuejun S., Hengyi T., and L. Kan . 2013. Hyperbaric oxygen and cancer: more complex than we expected. Target Oncol. 8:79–81. - PubMed
    1. Moen, I. , and Stuhr L. E.. 2012. Hyperbaric oxygen therapy and cancer–a review. Target Oncol. 7:233–242. - PMC - PubMed
    1. Stuhr, L. E. , Raa A., Oyan M., et al. 2007. Hyperoxia retards growth and induces apoptosis, changes in vascular density and gene expression in transplanted gliomas in nude rats. J. Neurooncol. 85:191–202. - PubMed
    1. Takiguchi, N. , Saito N., Nunomura M., et al. 2001. Use of 5‐FU plus hyperbaric oxygen for treating malignant tumors: evaluation of antitumor effect and measurement of 5‐FU in individual organs. Cancer Chemother. Pharmacol. 47:11–14. - PubMed

Publication types

MeSH terms

LinkOut - more resources