

Review
doi: 10.1038/nature19790.
The evolution of Ebola virus: Insights from the 2013-2016 epidemic
Affiliations
- PMID: 27734858
- PMCID: PMC5580494
- DOI: 10.1038/nature19790
Item in Clipboard
Review
The evolution of Ebola virus: Insights from the 2013-2016 epidemic
Nature.
.
Abstract
The 2013-2016 epidemic of Ebola virus disease in West Africa was of unprecedented magnitude and changed our perspective on this lethal but sporadically emerging virus. This outbreak also marked the beginning of large-scale real-time molecular epidemiology. Here, we show how evolutionary analyses of Ebola virus genome sequences provided key insights into virus origins, evolution and spread during the epidemic. We provide basic scientists, epidemiologists, medical practitioners and other outbreak responders with an enhanced understanding of the utility and limitations of pathogen genomic sequencing. This will be crucially important in our attempts to track and control future infectious disease outbreaks.
Figures

(a) Sampling during the 2013–2016 EVD epidemic. Sequencing efforts closely match confirmed and suspected case numbers in each administrative division of Guinea (green), Liberia (red) and Sierra Leone (blue) (Spearman correlation coefficient = 0.91). (b) Map of the three countries most affected by EVD during the 2013–2016 EVD epidemic. Administrative divisions in Guinea, Liberia and Sierra Leone are shown in green, red and blue, respectively, and colored according to the cumulative numbers of confirmed and suspected cases throughout the epidemic. Hatched areas indicate divisions that never reported any cases. The boundary data for the maps is from GADM (http://www.gadm.org ). (c) Temporal phylogeny of all publicly available EBOV genomes estimated using BEAST. Three lineages identified in previous studies,, are marked with colored backgrounds. The sequence alignment was partitioned into 4 categories: codon positions 1, 2 and 3, and non-coding intergenic regions. Changes in each of the 4 partitions were modelled according to the HKY+Γ4 nucleotide substitution model with relative rates between partitions. Tip dates were used to calibrate a relaxed molecular clock with rates drawn from a lognormal distribution with an uninformative prior placed on the mean of the distribution. A flexible ‘skygrid’ tree prior was used to allow for changes in effective population sizes over time. Each tip is colored according to the country where the patient was most likely infected: green for Guinea, red for Liberia and blue for Sierra Leone. All panels are current as of April 19th, 2016.

(a) Estimates of evolutionary rate in diverse RNA viruses. Green points at the top indicate the mean evolutionary rates estimated for EBOV during the 2013–2016 EVD epidemic from different studies, with dashed lines showing the 95% credible intervals derived from BEAST analyses. Points at the bottom represent equivalent estimates (without uncertainty intervals) published previously for negative-sense single-strand RNA viruses (red), positive-sense single-strand RNA viruses (blue) and double-strand RNA viruses (purple). Points colored the same shade belong to the same family. Evolutionary rate estimates for EBOV Makona occupy a narrow distribution within the range of rates observed in RNA viruses as a whole. (b) 95% credible intervals for the distribution of evolutionary rates for EBOV from the 2013–2016 EVD epidemic published previously. *An erratum revised the mean evolutionary rate estimate for Ref. to 1.32 × 10⁻³ [95% credible intervals: 0.89, 1.75 × 10⁻³] subs/site/year.
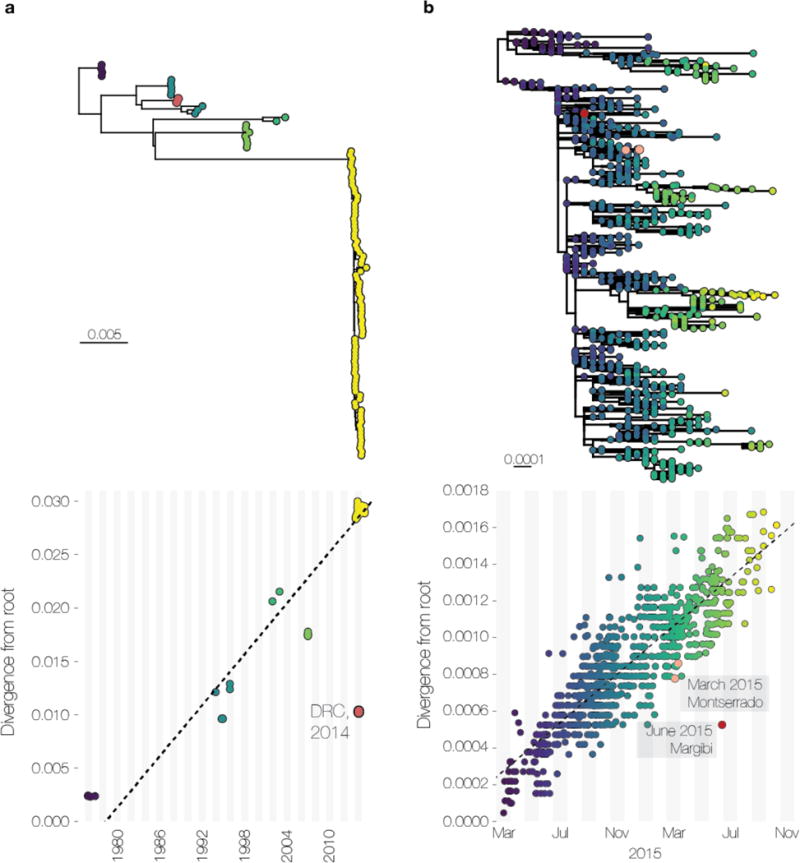
(a) Root-to-tip regression of genetic distances against time (month and year) of sampling for 105 representative EBOV variant sequences collected between 1976 and 2016 based on a maximum likelihood tree. (b) Equivalent root-to-tip regression of publicly available sequences from the 2013–2016 EVD epidemic utilizing data on the day of sampling, and the maximum likelihood tree on which the estimates were made. RAxML (panel A) and PhyML (panel B) were used to find the maximum likelihood phylogenies under an HKY+Γ4 substitution model which was rooted via least squares regression in TempEst. Substitutions accumulate linearly with time, with some variation. Sequences recovered from transmission events that occurred as a result of persistent EBOV infection often exhibit temporal anomalies. In this scenario, EBOV may accumulate substitutions at a lower rate during persistence in individuals compared to regular person-to-person transmission. Larger red points indicate sequences of EBOV sampled from EVD survivor-associated transmission chains,.

Mutations accumulate with time. This phenomenon is at the core of molecular clocks, a class of methods that aim to convert molecular phylogenies with branch lengths given in expected substitutions per site into plausible temporal phylogenies where branch lengths are given in time units and the trees themselves are embedded in time. By making use of sequences sampled at different times, such methods can estimate the evolutionary rate that provides the conversion from genetic distance into time. As phylogenetic methods have become ever more powerful and easily accessible, confusion has resulted from the frequent and interchangeable use of the terms mutation rate and substitution rate to signify the ‘molecular clock’ rate. Mutation and substitution rates, however, sit on the opposite ends of the evolutionary rate continuum and neither is the appropriate term for the molecular clock rate derived from densely sequenced epidemics.
References
-
- Baize S, et al. Emergence of Zaire Ebola virus disease in Guinea. N Engl J Med. 2014;371:1418–1425. The first paper to describe the emergence of EBOV Makona in Guinea in December 2013, providing the sequences of three full-length viral genomes. - PubMed
-
- Gire SK, et al. Genomic surveillance elucidates Ebola virus origin and transmission during the 2014 outbreak. Science. 2014;345:1369–1372. Obtained the first large-scale near-real-time EBOV genomic data from 78 patients in Sierra Leone, which provided critical insights into virus spread during the early stages of the epidemic. - PMC - PubMed
Publication types
MeSH terms
Grants and funding
LinkOut - more resources
Full Text Sources
Other Literature Sources
Medical
