. 2016 Oct 13:6:35234.
doi: 10.1038/srep35234.

Bone marrow-derived and peritoneal macrophages have different inflammatory response to oxLDL and M1/M2 marker expression - implications for atherosclerosis research

Affiliations

Bone marrow-derived and peritoneal macrophages have different inflammatory response to oxLDL and M1/M2 marker expression - implications for atherosclerosis research

Line S Bisgaard et al. Sci Rep. .

Abstract

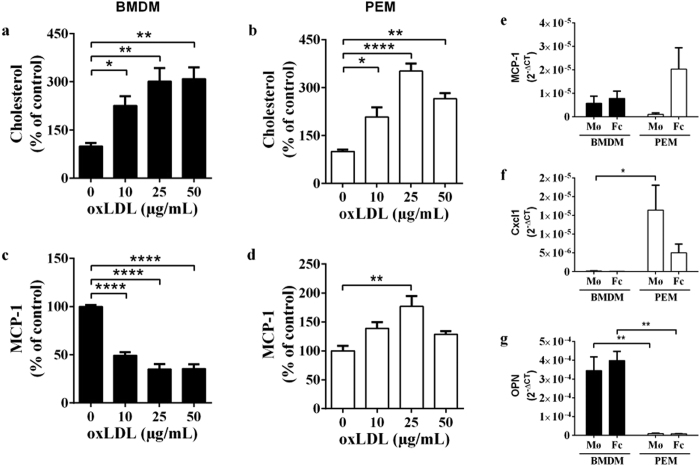
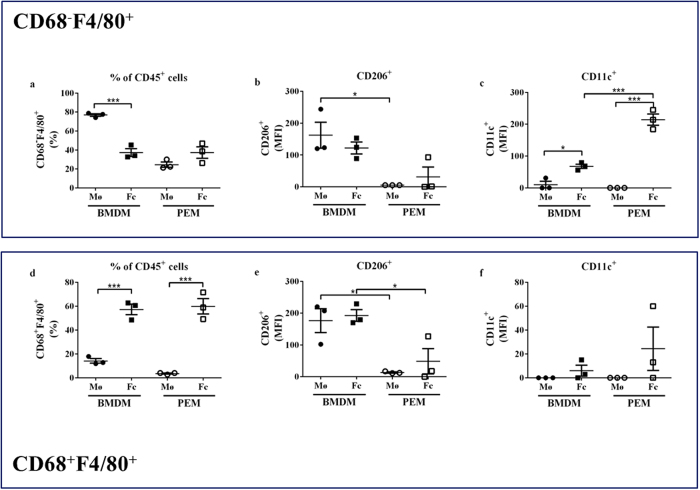
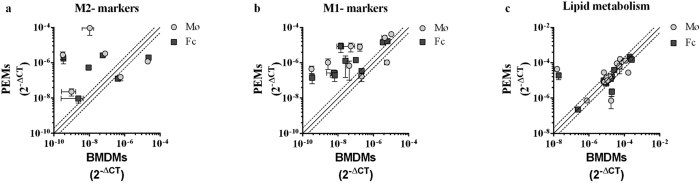
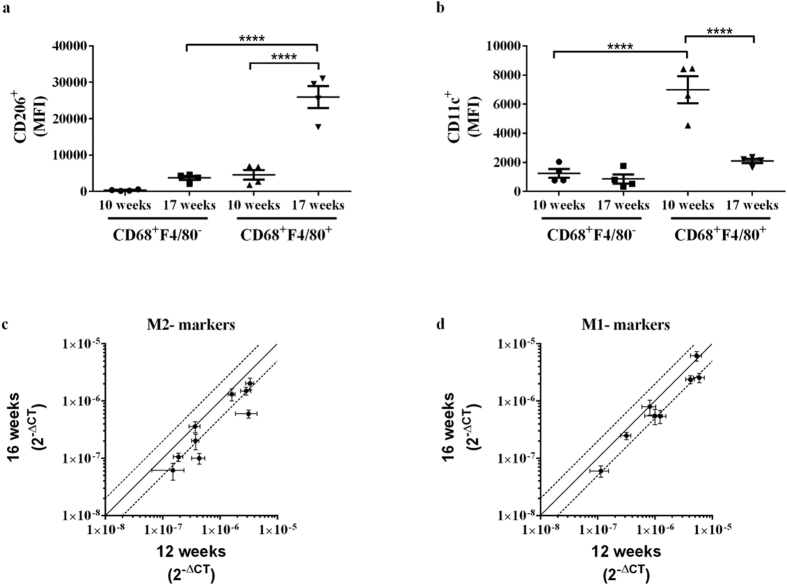
Macrophages are heterogeneous and can polarize into specific subsets, e.g. pro-inflammatory M1-like and re-modelling M2-like macrophages. To determine if peritoneal macrophages (PEMs) or bone marrow derived macrophages (BMDMs) resembled aortic macrophages from ApoE-/- mice, their M1/M2 phenotype, inflammatory status, and lipid metabolism signatures were compared. oxLDL accumulation was similar in PEMs and BMDMs. On protein expression level, BMDMs showed an M2-like CD206highCD11clow profile, while cholesterol loading led to enhanced CD11c expression and reduced MCP-1 secretion. In contrast, PEMs expressed low levels of CD206 and CD11c, and responded to cholesterol loading by increasing CD11c expression and MCP-1 secretion. mRNA expression of M1/M2 markers was higher in PEMS than BMDMs, while lipid metabolism genes were similarly expressed. Whole aorta flow cytometry showed an accumulation of M2-like CD206highCD11clow macrophages in advanced versus early atherosclerotic disease in ApoE-/- mice. In isolated lesions, mRNA levels of the M2 markers Socs2, CD206, Retnla, and IL4 were downregulated with increasing disease severity. Likewise, mRNA expression of lipid metabolism genes (SREBP2, ACSL1, SRB1, DGAT1, and cpt1a) was decreased in advanced versus early lesions. In conclusion, PEMs and BMDMs are phenotypically distinct and differ from macrophages in lesions with respect to expression of M1/M2 markers and lipid metabolism genes.


Conflict of interest statement

L.S.B., S.E.R., C.K.M., A.R. and H.C. has been or are employed at Novo Nordisk.

Figures

Figure 1
Figure 1. BMDMs and PEMs have a different inflammatory response to oxLDL stimulation.
(a–d) Cholesterol or MCP-1 content (% of control (0 μg/mL oxLDL)) in BMDMs (a,c) and PEMs (b,d) after stimulation with 0–50 μg/mL oxLDL for 24 hours (each graph represents 3 separate experiments (n = 3–4 wells per experiment)). *p < 0.05, **p < 0.01, ****p < 0.0001, as determined by 1-way ANOVA with Dunnets post-test. Each graph represents one representative experiment (triplicate analyses of BMDMs from one mouse or PEMs from a pool 4–5 of mice). Experiments were triplicated with similar results (i.e. n = 3 mice for BMDMs and 3 pools of 4–5 mice for PEMs). (e–g) mRNA expression (2−ΔCT) of monocyte chemoattractant protein 1 (MCP-1) (e), chemokine (C-X-C motif) ligand 1 (Cxcl 1) (f) or osteopontin (OPN) (g) in BMDMs or PEMs after incubation with 0 μg/mL oxLDL (macrophage, Mø) or 25 μg/mL oxLDL (foam cells, Fc) for 24 hours (n = 3 mice for BMDMs; n = 3 pools of mice for PEMs). *p < 0.5, **p < 0.01, as determined by 2-way ANOVA.
Figure 2
Figure 2. M1/M2 marker expression in BMDMs and PEMs.
(a–f) Flow cytometry of BMDMs and PEMs after incubation with 0 μg/mL oxLDL (macrophage, Mø) or 25 μg/mL oxLDL (foam cells, Fc) for 24 hours (n = 3 mice for BMDMs and 3 pools of 4–5 mice for PEMs). For both single positive (CD68F4/80+) and double positive (CD68+F4/80+) cells, the percentage of CD45+ cells (a,d), and MFI for CD206 (b,e) and CD11c (c,f) expression were detected. MFI: Mean Fluorescent Intensity. *p < 0.05, ***p < 0.001 as determined by 1-way ANOVA with Tukey’s post-test.
Figure 3
Figure 3. No clear M1/M2 gene expression profile in BMDMs and PEMs.
(a–c) mRNA levels (2−ΔCT) of M2 markers (a), M1 markers (b), or genes related to lipid metabolism (c) in PEMs depicted as a function of mRNA levels (2−ΔCT) in BMDMs (n = 3 mice for BMDMs and 3 pools of 4–5 mice for PEMs). Each grey circle represents expression of a given gene in macrophages (Mø, 0 μg/mL oxLDL 24 h), whereas each square represents expression of a given gene in foam cells (Fc, 25 μg/mL oxLDL 24 h) as measured by PCR array analyses. The full line indicate genes, with similar expression levels in both cell types, while data points placed above or below the dotted lines are more than 2 fold up- or down-regulated, respectively, in PEMs as compared to BMDMS. The specific genes of interest, their fold change, and statistics can be found in Table 1.
Figure 4
Figure 4. Macrophage polarisation in whole aortas and isolated lesion areas from ApoE−/− mice.
(a,b) Flow cytometry of whole aortas to detect CD206 (a) and CD11c (b) expression (MFI: mean fluorescent intensity) in CD68+F4/80 and CD68+F4/80+ cells after 10 or 17 weeks on WD (n = 4 mice/time point). *p < 0.05, ****p < 0.0001 as determined by 1-way ANOVA with Tukey’s post-test. See Suppl. Fig. 3 for representative MFI histograms. (c,d) mRNA expression levels (2−ΔCT) of M2 (c) or M1 markers (d) in aortic lesion areas isolated after 12 or 16 weeks of WD (n = 7 mice/group). Each point represents expression level (2−ΔCT) of a given gene. The full line indicates genes, where the expression level is the same, while data points placed above or below the dotted lines are more than 2 fold up- or down-regulated, respectively, after 16 compared to 12 weeks of WD. The specific genes of interest, their fold change and statistics can be found in Suppl. Table 2.

References

    1. Rayner K. J. et al. Antagonism of miR-33 in mice promotes reverse cholesterol transport and regression of atherosclerosis. The Journal of clinical investigation 121, 2921–2931, doi: 10.1172/JCI57275 (2011). - DOI - PMC - PubMed
    1. Cuchel M. & Rader D. J. Macrophage reverse cholesterol transport: key to the regression of atherosclerosis? Circulation 113, 2548–2555, doi: 10.1161/CIRCULATIONAHA.104.475715 (2006). - DOI - PubMed
    1. Pillai M. M., Hayes B. & Torok-Storb B. Inducible transgenes under the control of the hCD68 promoter identifies mouse macrophages with a distribution that differs from the F4/80 - and CSF-1R-expressing populations. Exp Hematol 37, 1387–1392, doi: 10.1016/j.exphem.2009.09.003 (2009). - DOI - PMC - PubMed
    1. Gordon S. & Mantovani A. Diversity and plasticity of mononuclear phagocytes. Eur J Immunol 41, 2470–2472, doi: 10.1002/eji.201141988 (2011). - DOI - PubMed
    1. Balbo P., Silvestri M., Rossi G. A., Crimi E. & Burastero S. E. Differential role of CD80 and CD86 on alveolar macrophages in the presentation of allergen to T lymphocytes in asthma. Clin Exp Allergy 31, 625–636 (2001). - PubMed

Publication types

Substances