. 2016 Oct 13;7(10):e2419.
doi: 10.1038/cddis.2016.268.

Increased survival and cell cycle progression pathways are required for EWS/FLI1-induced malignant transformation

Affiliations

Increased survival and cell cycle progression pathways are required for EWS/FLI1-induced malignant transformation

Tahereh Javaheri et al. Cell Death Dis. .

Erratum in

Retraction in

Abstract

Ewing sarcoma (ES) is the second most frequent childhood bone cancer driven by the EWS/FLI1 (EF) fusion protein. Genetically defined ES models are needed to understand how EF expression changes bone precursor cell differentiation, how ES arises and through which mechanisms of inhibition it can be targeted. We used mesenchymal Prx1-directed conditional EF expression in mice to study bone development and to establish a reliable sarcoma model. EF expression arrested early chondrocyte and osteoblast differentiation due to changed signaling pathways such as hedgehog, WNT or growth factor signaling. Mesenchymal stem cells (MSCs) expressing EF showed high self-renewal capacity and maintained an undifferentiated state despite high apoptosis. Blocking apoptosis through enforced BCL2 family member expression in MSCs promoted efficient and rapid sarcoma formation when transplanted to immunocompromised mice. Mechanistically, high BCL2 family member and CDK4, but low P53 and INK4A protein expression synergized in Ewing-like sarcoma development. Functionally, knockdown of Mcl1 or Cdk4 or their combined pharmacologic inhibition resulted in growth arrest and apoptosis in both established human ES cell lines and EF-transformed mouse MSCs. Combinatorial targeting of survival and cell cycle progression pathways could counteract this aggressive childhood cancer.


Figures

Figure 1
Figure 1
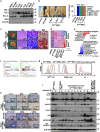
EF expression blocks bone differentiation causing skeletal defects in EFPrx1 mice. (a) Scheme of the ROSA26-lox-STOP-lox-HA-hEWS/FLI1 transgenic mouse. (b) Representative picture of wt and EFPrx1 E16.5 embryo displays malformed limbs as indicated by black dashed circle. Skeletal preparations and analysis with Alcian Blue/Alizarin Red staining of E16.5 wt and EFPrx1. sc, scapula; hu, humerus; ra, radius; ul, ulna; ti, tibia; fi, fibula; fe, femur. (c) The list summarizes number of embryos (total, wt, EFPrx1) at different gestation days, and cumulative percentages/normal Mendelian ratio with indicated embryo numbers. (d) Histology analysis of E13.5 limbs stained by H&E or Van Kossa/Alcian Blue, which stains cartilage in blue and bone elements in red, indicated that there was no significant hypertrophic region present in EFPrx1 embryos in contrast to wt limbs. RNA in situ hybridization of E13.5 limbs confirmed an arrest in chondrocyte and osteoblast differentiation. For all embryos consecutive sections were performed. At least three different independent embryos for every single staining and for each time point were analyzed. Black circles indicate the magnified region showing in the lower row. (e) Detection of EF expression at the protein level at E16.5 using HA-tag antibody displayed significant transgenic protein product in limbs from EF mice. HSC-70 was used as a loading control. Fibro GFP or CRE: fibroblasts isolated from EF mice lentiviral-transduced with a construct containing GFP or the CRE recombinase was used as controls. Numbers of analyzed embryo/mice are indicated to corresponding images
Figure 2
Figure 2
Blocked bone signaling pathways upon EF expression. (a and b) Dimethylmethylene blue (DMMB) as a chondrocyte marker showed marked reduction of Glycosaminoglycan in mutant embryos. IHC staining analysis on consecutive embryo sections of E14.5 and postnatal day P1 mice showed that EF expression in limb mesenchyme promotes downregulation of TGF-β signaling pathway. Black circles indicating the magnified region showing in the next column. (b) Quantification of IHC signals from (a). At least three different independent embryos for every single staining and for each time point were carried out. Quantitation was done by (ANOVA) one-way analysis of variance. *P<0.5, **P<0.05 and ***P<0.005
Figure 3
Figure 3
EF expression induces apoptosis and leads to diminished cell cycle progression. (a) HA-tag staining was performed to detect the EF translocation product. The rate of proliferation was comparable to wt based on Ki67 proliferation marker staining. TUNEL staining displayed highly elevated apoptosis at P1. (b) P21 (CDKN1A) protein level was upregulated. Prominent nuclear staining of P21 at E14.5, decreased at E16.5 and P1. cyclin D1 expression was decreased during development till P1. Black circles indicating the magnified region showing in the next column. (c) Quantification of IHC from part A and B. At least three different independent embryos of wt or mutant for every single staining and for each time point were analyzed. Experimental staining results were evaluated using (ANOVA) one-way analysis of variance. Insets in separate panel highlight cellular details. *P<0.5, **P<0.05 and ***P<0.005
Figure 4
Figure 4
EFPrx1 mesenchymal stem cells like cells (EFPrx1MSCL) are immortal, but display high apoptosis and fail to differentiate. (a) MSCL were isolated from P1 mouse long bone cartilaginous elements of wt or EFPrx1 newborns (left). A representative primary cell line from low passage 3–4 in case of wtMSCL or passage 8–10 in case of EFPrx1MSCL line is shown. WtMSCL were able to differentiate along mesenchymal lineages, whereas EFPrx1MSCL failed to differentiate. Differentiation was induced as detailed in Materials and Methods to obtain osteocytes (stained with Alizarin red), chondrocytes (Van Kossa staining) and adipocytes (Oil red O staining). An example from three independent differentiation experiments is shown (right). (b) Western blot analysis (n=2, each) of HA-tag and qRT-PCR (n=6, each) proved significant EF transgene expression. The EFPrx1MSCL displayed high surface expression of CD90 (Thy-1.1; n=3, each), a MSC marker, compared with wtMSCL. (c) EFPrx1MSCL has blunted TGF-β signaling as measured by reduced expression levels of TgfbrI, TgfbrII and Dlx5. Similarly, osteogenic markers like Osx, Sox9 and Osc were expressed to lower levels, but enhanced hedgehog signaling was found as evident by higher Ihh, Smo and Gli1 expression using qRT-PCR. Error bars represent S.E.M. of six individual measurements. All qRT-PCR results were normalized to Gapdh. For wt or mutant embryos at least three different independent experiments were carried out. (d) Representative cell cycle analysis of six wtMSCL (passage 3) or 12 EFPrx1MSCL at early (passage 8) or late (passage 55) culture time as measured by propidium iodide (PI) staining. Caspase-3 expression was induced in EFPrx1MSCL as measured by qRT-PCR compared with wtMSCL levels causing high apoptosis. *P<0.5, **P<0.05 and ***P<0.005
Figure 5
Figure 5
EFPrx1MSCL give rise to sarcomas upon enhanced expression of anti-apoptotic BCL2 family members. (a) ES cell lines SK-N-MC, TC71, TC252 and A673 expressed prominent level of MCL1, BCL2 and BCL-xL. Colorectal carcinoma cell lines HT29, HCT116, SW620 and LS174T were used as positive control. CDK4 expression was higher than in the control human prostate epithelial cell line RWPE-1. (b) Four different EFPrx1MSCL and four different wtMSCL were transduced by retrovirus with either GFP-vector, Bcl2-IRES-eGFP, Bcl-xL-IRES-eGFP or Mcl1-IRES-eGFP. A total of 12 primary cell transductions for each cell line were xenografted (n=12, each). All Bcl2, Bcl-xL and Mcl1-expressing EFPrx1MSCL lines formed reproducibly sarcomas with full penetration as quantified in the right graph. None of the controls like the wtMSCL with or without BCL2 family member transduction or GFP-transduced EFPrx1MSCL formed any sarcoma up to 6 months post transplant. (c) Xenografted sarcomas were positive for periodic acid schiff (PAS) and neuronal-specific enolase (NSE) staining. SK-N-MC xenograft served as positive control. (d) RNA-seq analysis (from left to right) of wtMSCL, EFPrx1MSCL, two sarcoma samples from EFPrx1MSCL+Bcl2 and EFPrx1MSCL+Mcl1 revealed that samples become more similar to the ES gene expression signature (Kauer data set). (e) Clustering analysis showed the best matching of EFPrx1MSCL+Mcl1 tumor genes to human ES signatures. (f) Gene enrichment analysis (GSEA) exhibited a noticeable upregulation of cell cycle and a downregulation of p53 pathway in mouse EFPrx1MSCL+Mcl1 tumors versus wtMSCL. (g) EFPrx1MSCL at passage 30 served as controls. Two representative sarcoma lines EFPrx1MSCL+Mcl1 were established each that displayed an increase of GFP expression and a decrease in TUNEL+ cells after sarcomas formed, whereas PI staining displayed more proliferation in EFPrx1MSCL+Mcl1 and EFPrx1MSCL+Mcl1 tumor-derived cells. (h) Proliferative sarcoma cells were also positive for nuclear β-catenin, cyclin D1, CDK6 and CDK4, whereas cleaved caspase-3 (CC-3) was downregulated. All shown staining images are a representative of independent IHC analyses of n=12 isolated tumors per group. (i) Western blot of two EFPrx1MSCL, two EFPrx1MSCL+Mcl1, eight EFPrx1MSCL+Mcl1 sarcomas and two EFPrx1MSCL+Mcl1 tumor-derived cells showed an overall reduced level of caspase-3 (Pro CC-3), CC-3, P16Ink4A, P19ARF, P53 and higher amount of pS780-RB protein level upon enforced MCL1 expression in EFPrx1MSCL and associated tumor samples. Representative blots of three independent analyses are shown
Figure 6
Figure 6
Knockdown of Mcl1 or Cdk4 induced cell cycle arrest and inhibited ES cell proliferation. (a) Mcl1 and Cdk4 siRNA analysis and expression check in murine and human ES cell lines resulted in upregulation of total RB and lower amount of pS780-RB. (b) Colony-forming assay in matrigel displayed reduced clonogenic potency of EF-dependent cell lines after knockdown of Mcl1 or Cdk4 by siRNA treatment. (c) Cell cycle analysis of Mcl1 or Cdk4 siRNA treatment displayed enhanced G1 arrest. (d) In vitro growth inhibition of mouse and human EF-dependent cell lines by Palbociclib as well as the combinatorial treatment of Palbociclib and Obatoclax in triplicate. Cells were treated with inhibitors at the indicated concentration for 24 h. (e) CDK4/6 inhibition by Palbociclib displayed similar results as seen in the CDK4 siRNA assay

References

    1. Minas TZ, Han J, Javaheri T, Hong SH, Schlederer M, Saygideger-Kont Y et al. YK-4-279 effectively antagonizes EWS-FLI1 induced leukemia in a transgenic mouse model. Oncotarget 2015; 6: 37678–37694. - PMC - PubMed
    1. Hong SH, Youbi SE, Hong SP, Kallakury B, Monroe P, Erkizan HV et al. Pharmacokinetic modeling optimizes inhibition of the 'undruggable' EWS-FLI1 transcription factor in Ewing Sarcoma. Oncotarget 2014; 5: 338–350. - PMC - PubMed
    1. Erkizan HV, Kong Y, Merchant M, Schlottmann S, Barber-Rotenberg JS, Yuan L et al. A small molecule blocking oncogenic protein EWS-FLI1 interaction with RNA helicase A inhibits growth of Ewing's sarcoma. Nat Med 2009; 15: 750–756. - PMC - PubMed
    1. Pencik J, Pham HT, Schmoellerl J, Javaheri T, Schlederer M, Culig Z et al. JAK-STAT signaling in cancer: from cytokines to non-coding genome. Cytokine 2016; S1043-4666: 30145–4. - PMC - PubMed
    1. Riggi N, Suva ML, Suva D, Cironi L, Provero P, Tercier S et al. EWS-FLI-1 expression triggers a Ewing's sarcoma initiation program in primary human mesenchymal stem cells. Cancer Res 2008; 68: 2176–2185. - PubMed

Publication types

MeSH terms

Substances