. 2016 Nov 1;9(11):1357-1366.
doi: 10.1242/dmm.026070. Epub 2016 Sep 30.

Photoperiod induced obesity in the Brandt's vole (Lasiopodomys brandtii): a model of 'healthy obesity'?

Affiliations

Photoperiod induced obesity in the Brandt's vole (Lasiopodomys brandtii): a model of 'healthy obesity'?

Xin-Yu Liu et al. Dis Model Mech. .

Abstract

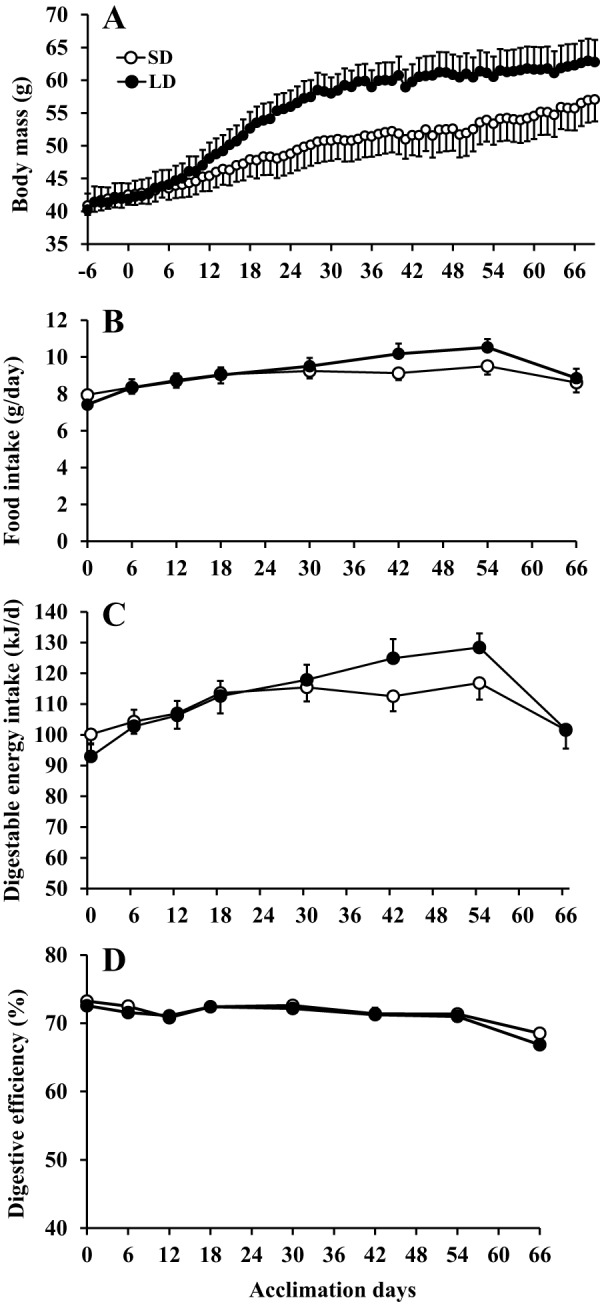
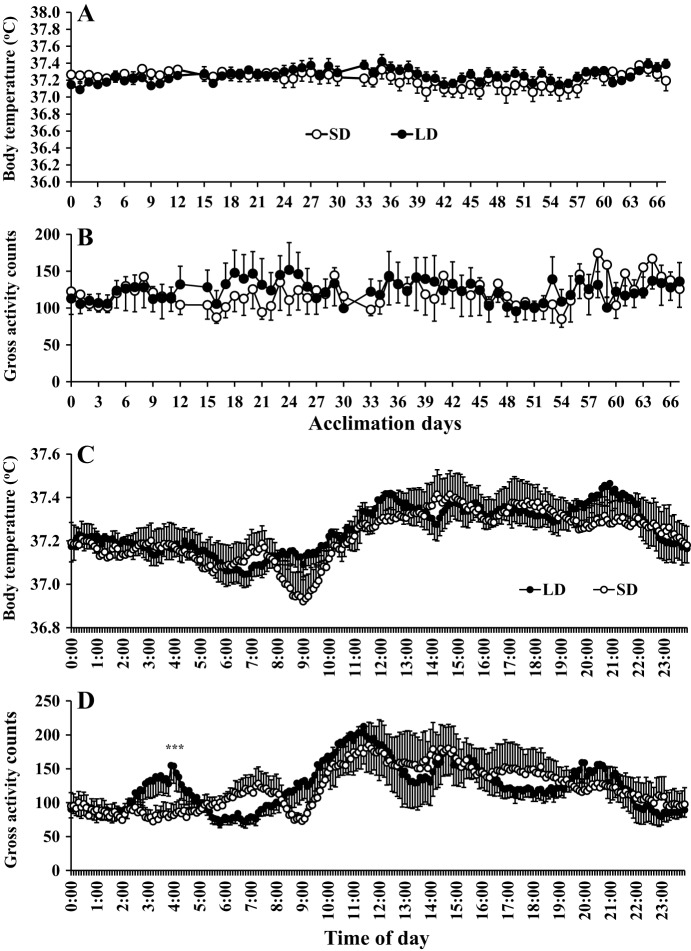
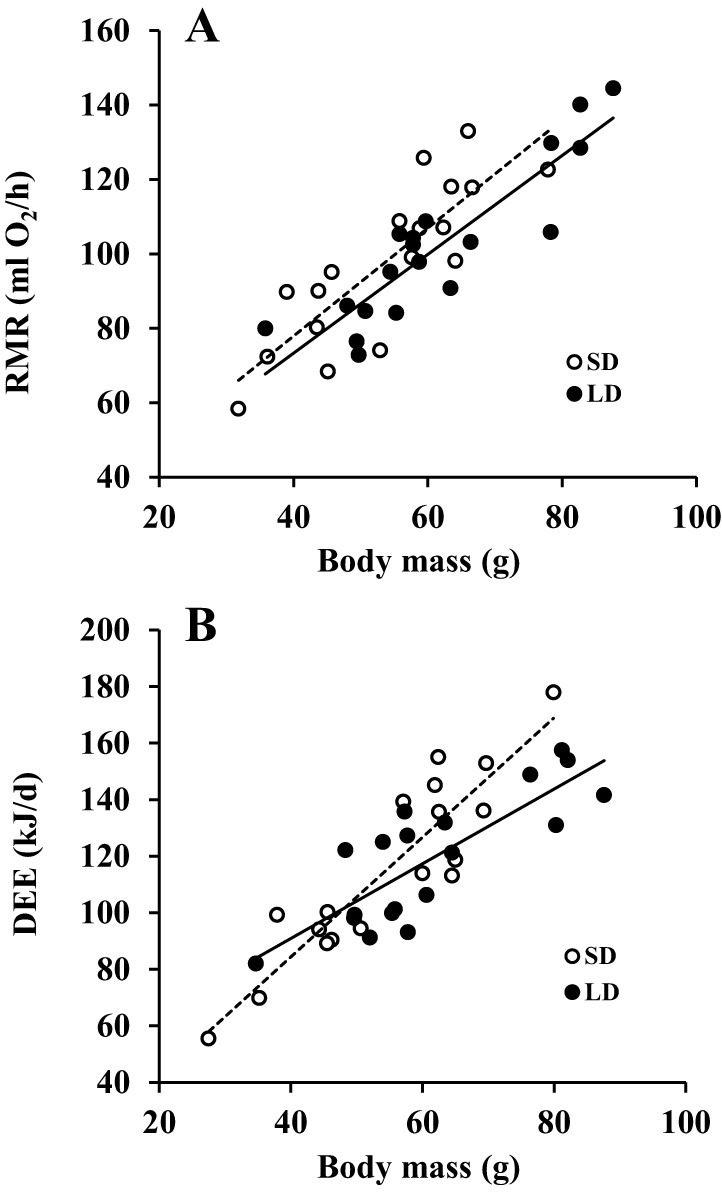
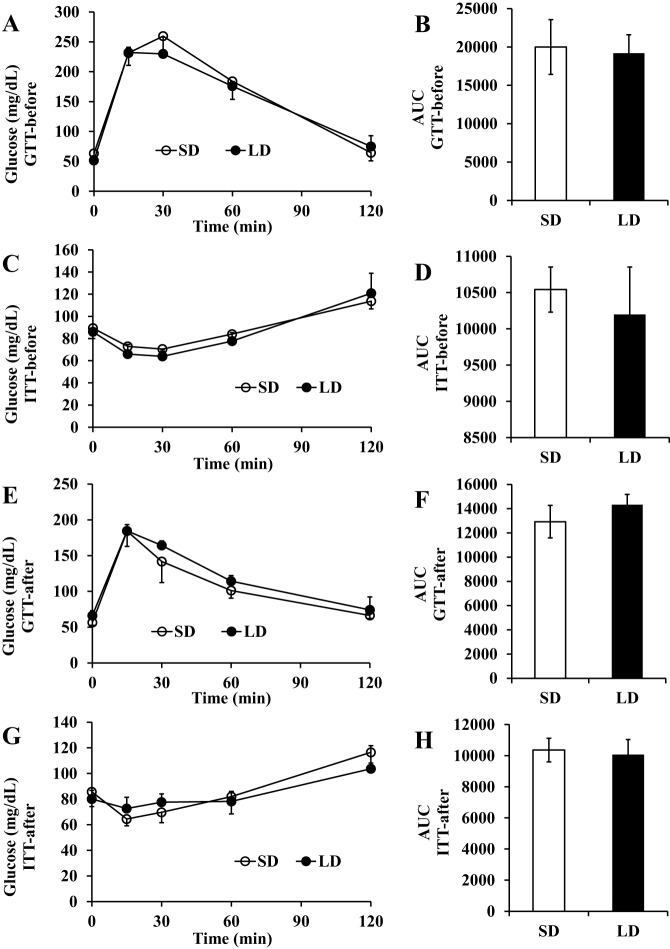
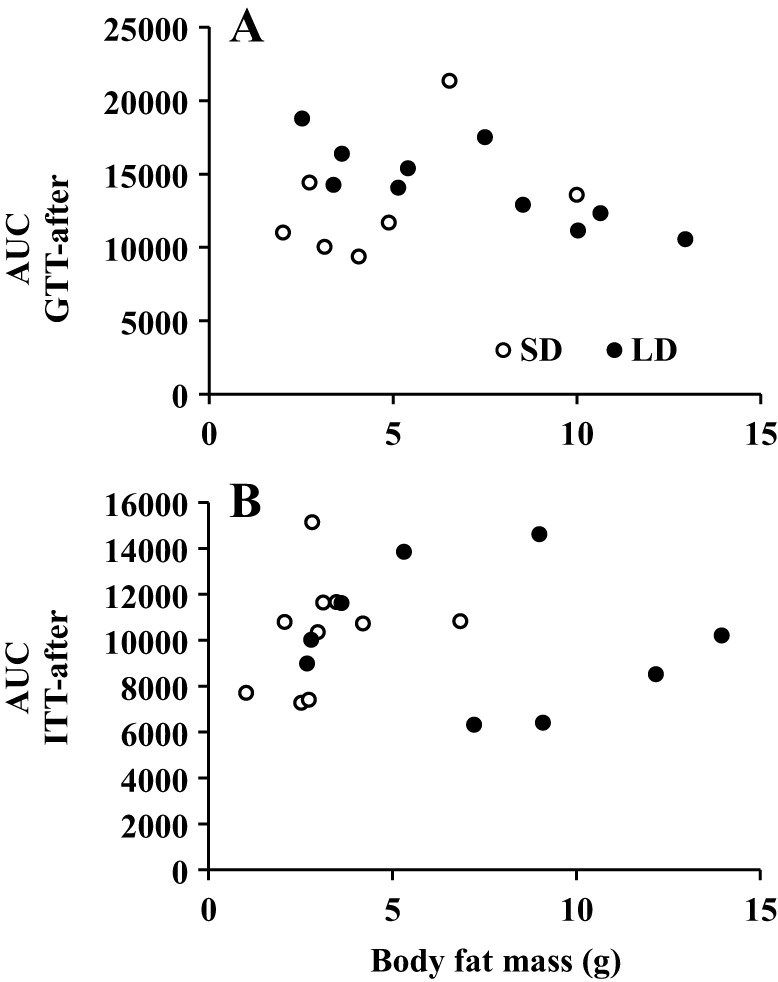
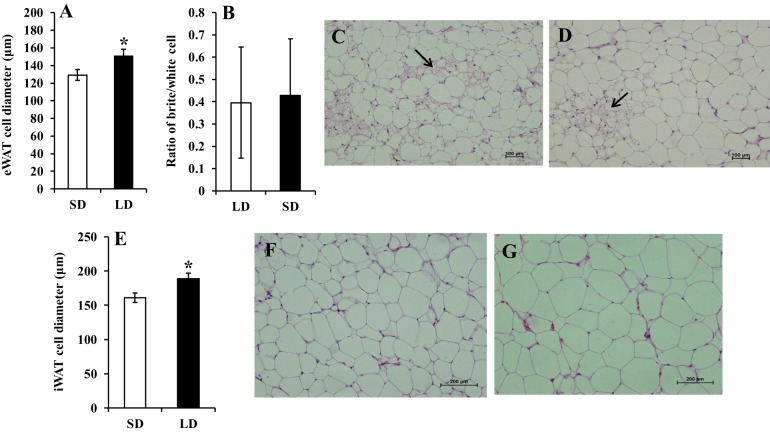
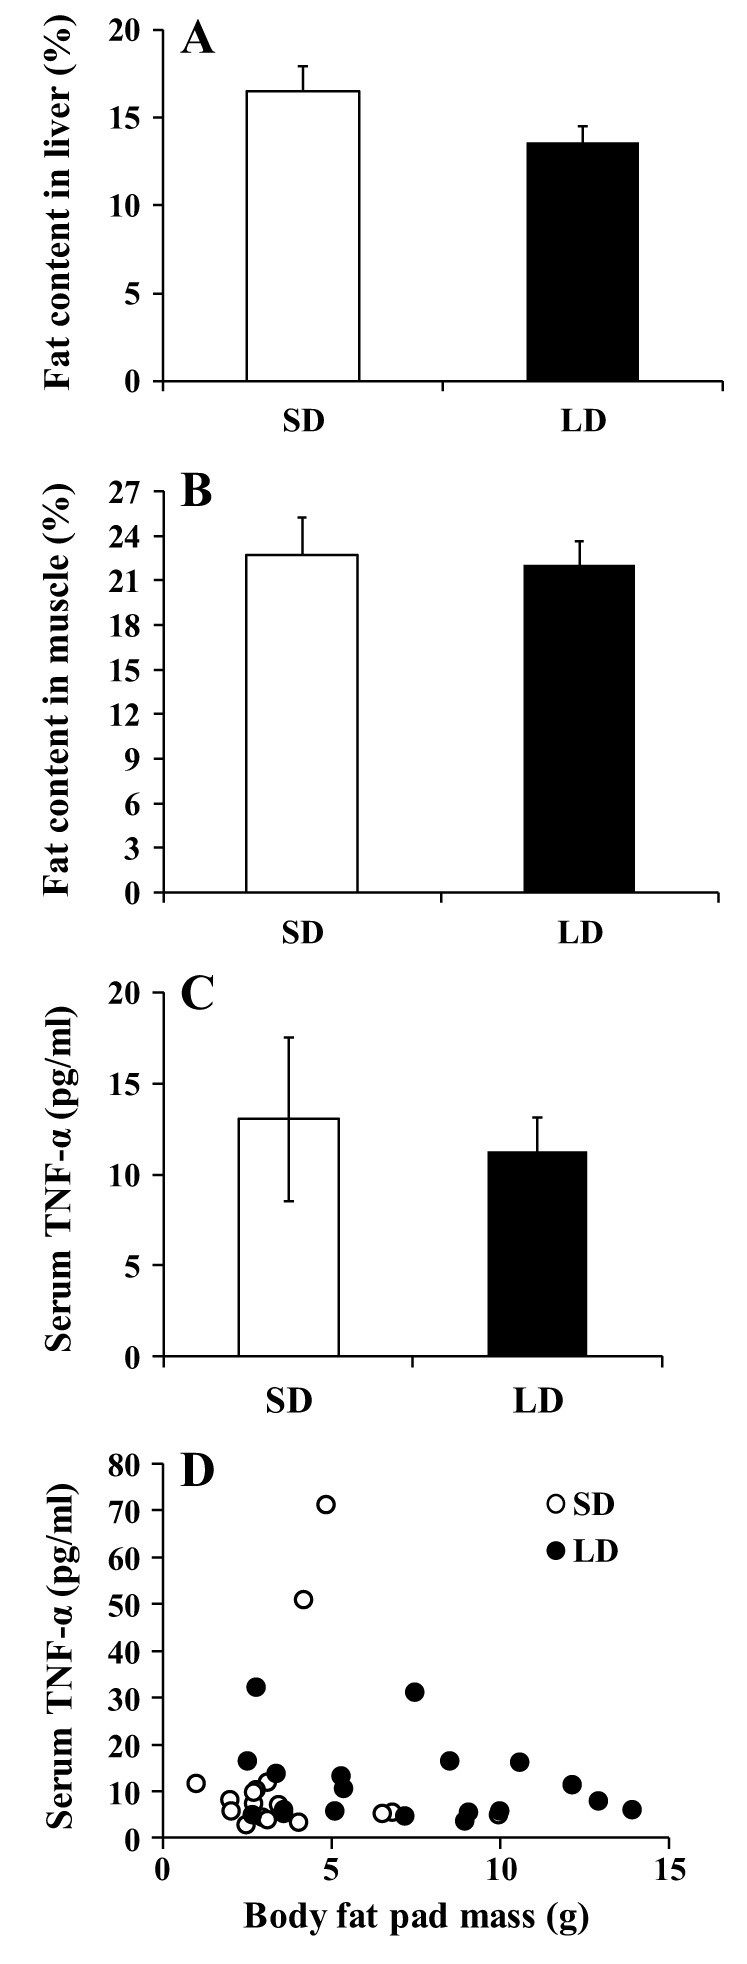
Brandt's voles have an annual cycle of body weight and adiposity. These changes can be induced in the laboratory by manipulation of photoperiod. In the present study, male captive-bred Brandt's voles aged 35 days were acclimated to a short day (SD) photoperiod (8L:16D) for 70 days. A subgroup of individuals (n=16) were implanted with transmitters to monitor physical activity and body temperature. They were then randomly allocated into long day (LD=16L:8D) (n=19, 8 with transmitters) and SD (n=18, 8 with transmitters) groups for an additional 70 days. We monitored aspects of energy balance, glucose and insulin tolerance (GTT and ITT), body composition and organ fat content after exposure to the different photoperiods. LD voles increased in weight for 35 days and then re-established stability at a higher level. At the end of the experiment LD-exposed voles had greater white adipose tissue mass than SD voles (P=0.003). During weight gain they did not differ in their food intake or digestive efficiency; however, daily energy expenditure was significantly reduced in the LD compared with SD animals (ANCOVA, P<0.05) and there was a trend to reduced resting metabolic rate RMR (P=0.075). Physical activity levels were unchanged. Despite different levels of fat storage, the GTT and ITT responses of SD and LD voles were not significantly different, and these traits were not correlated to body fatness. Hence, the photoperiod-induced obesity was independent on disruptions to glucose homeostasis, indicating a potential adaptive decoupling of these states in evolutionary time. Fat content in both the liver and muscle showed no significant difference between LD and SD animals. How voles overcome the common negative aspects of fat storage might make them a useful model for understanding the phenomenon of 'healthy obesity'.

Keywords: Adipose tissue expandability; Brandt's vole; Glucose tolerance; Healthy obesity; Insulin sensitivity; Lipotoxicity; Photoperiod.


Conflict of interest statement

The authors declare no competing or financial interests.

Figures

Fig. 1.
Fig. 1.
Effects of photoperiod exposure on body mass and food intake of Brandt's voles. Thirty-seven voles were exposed to short photoperiod and then 19 of them were switched to a long photoperiod (LD: black points) on day 0, while the remainder (n=18) remained on short days (SD: white points). Graphs show (A) body mass, (B) gross food intake, (C) digestible energy intake calculated as the energy in the food minus energy excreted in faeces, and (D) digestive efficiency – the percent of ingested food that is absorbed. Values are means±s.e.m. LD voles gained body weight after the photoperiod switch but this was not associated with elevated food intake, digestible energy intake or altered digestive efficiency.
Fig. 2.
Fig. 2.
Effects of photoperiod on aspects of energy expenditure in Brant's voles. Sixteen voles implanted with transmitters that measure body temperature and physical activity and were exposed to a short photoperiod and then eight of them were switched to a long photoperiod (LD: black points) on day 0, while the remainder (n=8) remained on short days (SD: white points). Graphs show (A) daily average body temperature and (B) gross daily physical activity over the 68 days of photoperiod manipulation. (C,D) Twenty-four-hour cycle of body temperature and physical activity of both groups. Voles did not differ in either body temperature or physical activity levels except for a short period as lights came on for the LD animals. ***P<0.05 by repeated-measures ANOVA comparison of LD with SD groups, which was significant on three sequential occasions.
Fig. 3.
Fig. 3.
Effects of photoperiod treatment on energy expenditure of Brandt's voles. (A) Resting metabolic rate (RMR: oxygen consumption/h) measured by indirect calorimetry. (B) Daily energy expenditure (DEE: kJ/day) measured by doubly-labelled water. White dots are short day exposed animals (n=18) and black dots are long day exposed animals (n=19). The dashed lines are the fitted regression lines for SD voles and the solid lines are the fitted regression lines for LD exposed voles. There was a trend for resting metabolic rates to be lower in LD animals (P=0.075) and a significant reduction in DEE (P=0.023).
Fig. 4.
Fig. 4.
Effects of photoperiod on glucose tolerance and insulin sensitivity in Brant's voles. Thirty-seven voles were exposed to short photoperiods. Animals were allocated to experimental groups (SD and LD) and measurements of glucose tolerance (GTT) and insulin sensitivity (ITT) were made on 8-10 animals from each group prior to the voles being exposed to a photoperiod treatment. Following initial measurement the LD voles were exposed to long day photoperiod for 68 days and the SD voles stayed on the short photoperiod. (A-D) Measurements after initial short photoperiod treatment. (A) Time course of glucose in the blood following glucose injection. (B) Area under the curve in A. (C) Time course of glucose in the blood following insulin injection. (D) Area under the curve in C. White dots and bars are short day (SD)- and black dots and bars are long day (LD)-exposed animals. As expected prior to treatment, there were no differences between the groups. (E-H) After 50 days of exposure to treatment the voles were remeasured. (E,G) Time courses of blood glucose following glucose and insulin injection, respectively. (F,H) Areas under the curves in E,G. Given the large fat accumulation in the LD voles it was unexpected that after 50 days there was also no significant effect of photoperiod on either glucose tolerance or insulin sensitivity.
Fig. 5.
Fig. 5.
Effects of body fat content on glucose homeostasis of Brandt's voles following photoperiod manipulation. Relationships are plotted between individual area under the curve measures from (A) the glucose tolerance test (GTT) and (B) the insulin sensitivity test, for voles exposed to short days (SD: white dots) or long days (LD: black dots) for 60 days. Body fatness and photoperiod had no significant impact on either measurement.
Fig. 6.
Fig. 6.
Effects of photoperiod treatment on WAT cell size of the voles. (A) Cell diameter of epididymal white adipocyte (eWAT). (B) Ratio of brite/white cells in eWAT. (C) Morphology of eWAT in SD. (D) Morphology of eWAT in LD. (E) Cell diameter of inguinal white adipocyte (iWAT). (F) Morphology of iWAT in SD. (G) Morphology of iWAT in LD. Values are means±s.e.m. (SD, n=17; LD, n=19). Arrows in C,D point to putative ‘brite’ cells in WAT. *P<0.05 by independent sample t-test.
Fig. 7.
Fig. 7.
Effects of photoperiod treatment on liver and muscle fat content and inflammation status of Brandt's voles. Thirty-seven voles were maintained on short photoperiod, after which 19 of them were exposed to long days and the remaining 18 stayed on short days. (A,B) After 68 days of photoperiod treatment voles were euthanised and measures made of (A) the fat content of the liver and (B) the fat content of skeletal muscle. In both cases there was no significant difference. (C,D) Circulating TNF-α levels were also measured in the serum (C) and these were plotted against the total dissected fat mass (D). There was no significant photoperiod effect or body fatness effect on TNF-α levels. Values in A-C are means±s.e.m.

References

    1. Barroso I., Gurnell M., Crowley V. E. F., Agostini M., Schwabe J. W., Soos M. A., Maslen G. L., Williams T. D., Lewis H., Schafer A. J. et al. (1999). Dominant negative mutations in human PPARγ associated with severe insulin resistance, diabetes mellitus and hypertension. Nature 402, 880-883. - PubMed
    1. Bartness T. J., Demas G. E. and Song C. K. (2002). Seasonal changes in adiposity: the roles of the photoperiod, melatonin and other hormones, and sympathetic nervous system. Exp. Biol. Med. 227, 363-376. - PubMed
    1. Blüher M. (2010). The distinction of metabolically ‘healthy’ from ‘unhealthy’ obese individuals. Curr. Opin. Lipidol. 21, 38-43. 10.1097/MOL.0b013e3283346ccc - DOI - PubMed
    1. Butler P. J., Green J. A., Boyd I. L. and Speakman J. R. (2004). Measuring metabolic rate in the field: the pros and cons of the doubly-labelled water and heart rate methods. Funct. Ecol. 18, 168-183. 10.1111/j.0269-8463.2004.00821.x - DOI
    1. Carey H. V., Andrews M. T. and Martin S. L. (2003). Mammalian hibernation: cellular and molecular responses to depressed metabolism and low temperature. Physiol. Rev. 83, 1153-1181. 10.1152/physrev.00008.2003 - DOI - PubMed

Publication types