Review
. 2016 Oct 1;9(10):1089-1095.
doi: 10.1242/dmm.026021.

Exploring human disease using the Rat Genome Database

Affiliations
Review

Exploring human disease using the Rat Genome Database

Mary Shimoyama et al. Dis Model Mech. .

Abstract

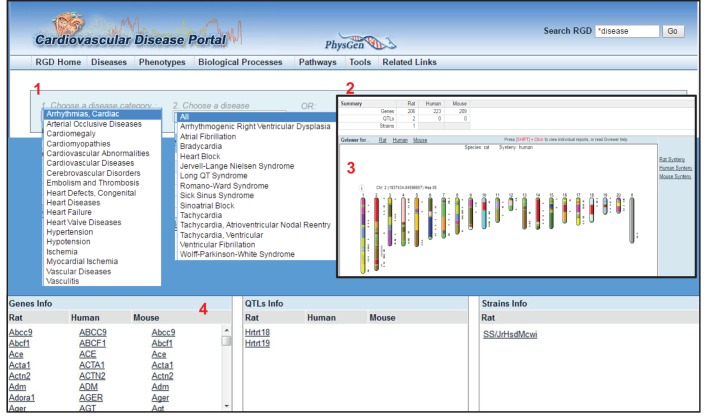
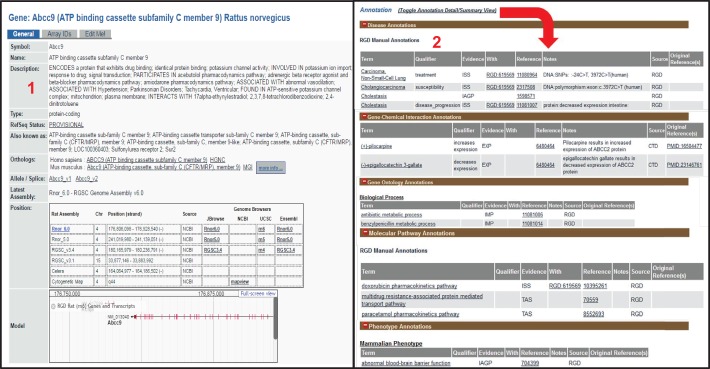
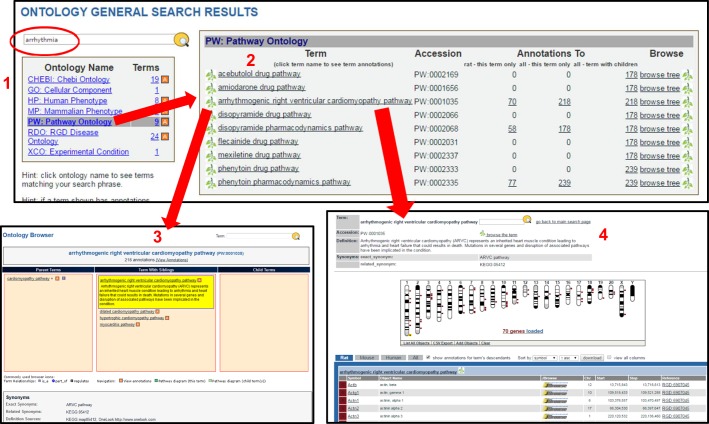
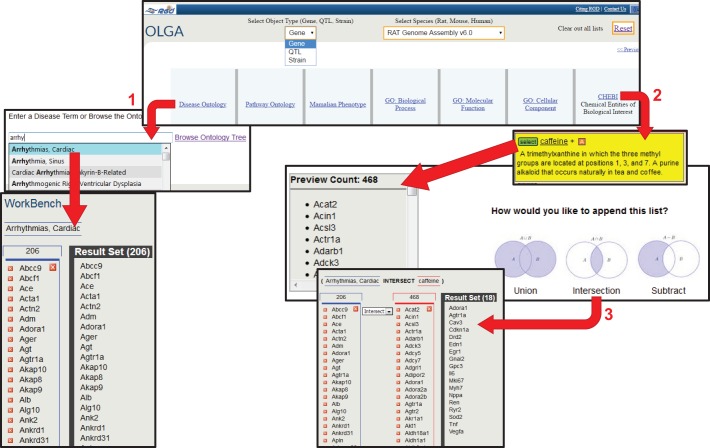
Rattus norvegicus, the laboratory rat, has been a crucial model for studies of the environmental and genetic factors associated with human diseases for over 150 years. It is the primary model organism for toxicology and pharmacology studies, and has features that make it the model of choice in many complex-disease studies. Since 1999, the Rat Genome Database (RGD; http://rgd.mcw.edu) has been the premier resource for genomic, genetic, phenotype and strain data for the laboratory rat. The primary role of RGD is to curate rat data and validate orthologous relationships with human and mouse genes, and make these data available for incorporation into other major databases such as NCBI, Ensembl and UniProt. RGD also provides official nomenclature for rat genes, quantitative trait loci, strains and genetic markers, as well as unique identifiers. The RGD team adds enormous value to these basic data elements through functional and disease annotations, the analysis and visual presentation of pathways, and the integration of phenotype measurement data for strains used as disease models. Because much of the rat research community focuses on understanding human diseases, RGD provides a number of datasets and software tools that allow users to easily explore and make disease-related connections among these datasets. RGD also provides comprehensive human and mouse data for comparative purposes, illustrating the value of the rat in translational research. This article introduces RGD and its suite of tools and datasets to researchers - within and beyond the rat community - who are particularly interested in leveraging rat-based insights to understand human diseases.

Keywords: Data analysis; Disease; Genomics; Online resource; Rat Genome Database.


Conflict of interest statement

The authors declare no competing or financial interests.

Figures

Fig. 1.
Fig. 1.
The Cardiovascular Disease Portal home page. Selecting ‘Arrhythmias, Cardiac’ in the first disease category dropdown menu (1) results in a summary view of rat, human and mouse gene, QTL and rat strain objects annotated to the selected term (2). Below that is a Genome Viewer (GViewer) display, showing the genomic positions of objects (genes, QTLs and strains) annotated to the term (3). These are presented in lists beneath the GViewer, with links to report pages dedicated to individual genes (4). Accessed 15 April, 2016.
Fig. 2.
Fig. 2.
A rat gene report page. Each rat gene report page provides an annotation-based description, nomenclature, orthologs and mapping information for a specific gene, as well as other information (1). This is followed by expandable sections, which can be toggled to a more detailed display (red arrow), of different annotation categories for the gene – disease, gene–chemical interactions, GO, pathway and phenotype, with links to more detailed information about each annotation (2). Accessed 15 April, 2016.
Fig. 3.
Fig. 3.
Searching ontologies. When searching for a term (circled), an initial report indicates which ontologies have terms containing the searched word (1). Clicking an ontology category provides a list of those terms (2). Clicking the branch icon next to a term places it highlighted in yellow in the Ontology Browser (3), with parent terms to the left, sibling terms below and any child terms to the right. Synonyms are provided at the bottom. Clicking on the term itself in the list (2) brings up the term ontology report page (4), which displays a Genome Viewer (GViewer) genome-wide view of objects annotated to the term. Below that is a list of rat, human and mouse genes annotated to the term, with links to the genome browser JBrowse to allow additional analysis. Accessed 15 April, 2016.
Fig. 4.
Fig. 4.
The Object List Generator and Analyzer (OLGA) tool facilitates construction of complex queries for rat, mouse or human genes or QTLs, or rat strains. In the example displayed, two queries are made for rat genes based on their functional annotations. In the first step (1), the Disease Ontology is searched. As the user types, an autocomplete list of disease terms is shown and the term “Arrhythmias, Cardiac” was selected. The resulting list, shown in the ‘WorkBench’ section of the page with the term used for the search, contains 206 genes. In the second step (2), the CHEBI ontology was browsed to locate the term “caffeine”. Selecting this term returns a preview list of 468 genes. Three options are given for appending the second list onto the first: ‘Union’, which combines the lists to produce the total non-redundant set of genes found in either list; ‘Intersection’, which returns the list of genes in common between the two; and ‘Subtract’, which returns only the genes from the first list that do not appear in the second. ‘Intersection’ was selected in this example (3) to produce a set of 18 genes that are associated with cardiac arrhythmias and interact with caffeine, with annotations. Accessed 15 April, 2016.
Fig. 5.
Fig. 5.
The Gene Annotator (GA) tool displays detailed information about a list of genes and their functions, allowing commonalities in functional annotations between different genes to be explored. The 18 rat genes (1) resulting from the OLGA query in Fig. 4 can be analyzed (2) in four different ways. From right to left, the list of genes can be downloaded as an Excel spreadsheet; viewed in the context of the entire rat genome using the Genome Viewer (GViewer) tool; used to search for strain-specific variants using the Variant Visualizer tool; or, as demonstrated here, explored using the Gene Annotator (GA) tool. Selecting the GA option (3) automatically populates the GA tool's search box with that list of genes. Alternatively, a user can access the tool from the ‘Genome Tools’ page of RGD and manually enter their gene list for analysis. The tool returns an individual report for each gene entered. The report displays the gene description, shows the orthologues of the gene, includes links to gene information hosted at other databases and lists the full set of ontology annotations for the gene and its orthologs. The Annotation Distribution function lists terms from seven functional categories and the percentage of input genes that share those annotations (not shown). The Comparison Heat Map function (4) allows users to view the number of genes at the intersection of two ontologies on multiple levels. Here, the user is comparing ‘GO Biological Process’ annotations with ‘Pathway’ annotations. By selecting terms along the horizontal and vertical axes, the user browses down the two ontologies to find the six genes that have annotations to the terms “cardiovascular system homeostasis pathway” and “cellular metabolic process” or to any more specific child terms in their respective vocabularies. Note that the colour intensity of the squares depends on the number of genes represented by each square, i.e. the more genes, the darker the colour. Clicking the dark brown square circled in red (5) opens a popup window showing the list of six genes at the intersection of these two ontological categories. Each gene symbol links to the RGD report page for more complete information about the gene. Because the original queries were for cardiac arrhythmias and caffeine, we know that these six genes have annotations for all four terms (and/or any more specific child terms under them): “Arrhythmias, Cardiac”, “caffeine”, “cardiovascular system homeostasis pathway” and “cellular metabolic process”. Accessed 15 April, 2016.

References

    1. Aitman T. J., Critser J. K., Cuppen E., Dominiczak A., Fernandez-Suarez X. M., Flint J., Gauguier D., Geurts A. M., Gould M., Harris P. C. et al. (2008). Progress and prospects in rat genetics: a community view. Nat. Genet. 40, 516-522. 10.1038/ng.147 - DOI - PubMed
    1. Becker K. G., Barnes K. C., Bright T. J. and Wang S. A. (2004). The genetic association database. Nat. Genet. 36, 431-432. 10.1038/ng0504-431 - DOI - PubMed
    1. Bult C. J., Eppig J. T., Blake J. A., Kadin J. A. and Richardson J. E. (2016). Mouse genome database 2016. Nucleic Acids Res. 44, D840-D847. 10.1093/nar/gkv1211 - DOI - PMC - PubMed
    1. Davis A. P., Grondin C. J., Lennon-Hopkins K., Saraceni-Richards C., Sciaky D., King B. L., Wiegers T. C. and Mattingly C. J. (2015). The comparative toxicogenomics database's 10th year anniversary: update 2015. Nucleic Acids Res. 43, D914-D920. 10.1093/nar/gku935 - DOI - PMC - PubMed
    1. Flister M. J., Prokop J. W., Lazar J., Shimoyama M., Dwinell M. and Geurts A. (2015). 2015 guidelines for establishing genetically modified rat models for cardiovascular research. J. Cardiovasc. Transl. Res. 8, 269-277. 10.1007/s12265-015-9626-4 - DOI - PMC - PubMed

Publication types

LinkOut - more resources