

Demographical history and palaeodistribution modelling show range shift towards Amazon Basin for a Neotropical tree species in the LGM
- PMID: 27737632
- PMCID: PMC5062830
- DOI: 10.1186/s12862-016-0779-9
Demographical history and palaeodistribution modelling show range shift towards Amazon Basin for a Neotropical tree species in the LGM
Abstract
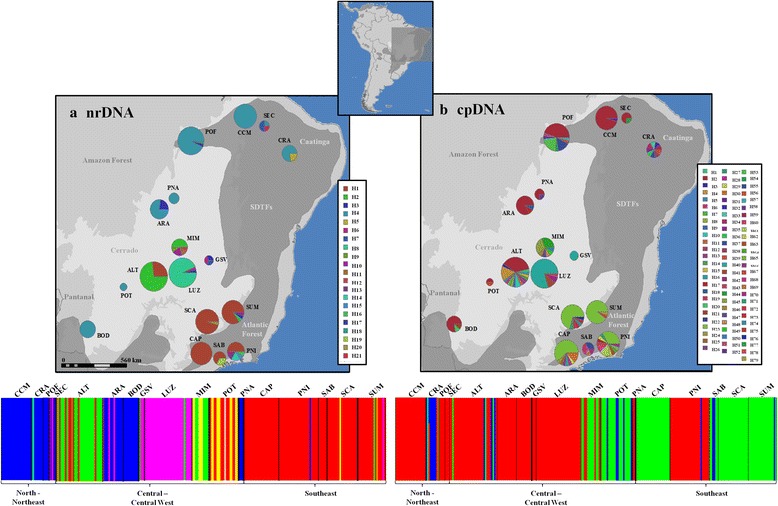
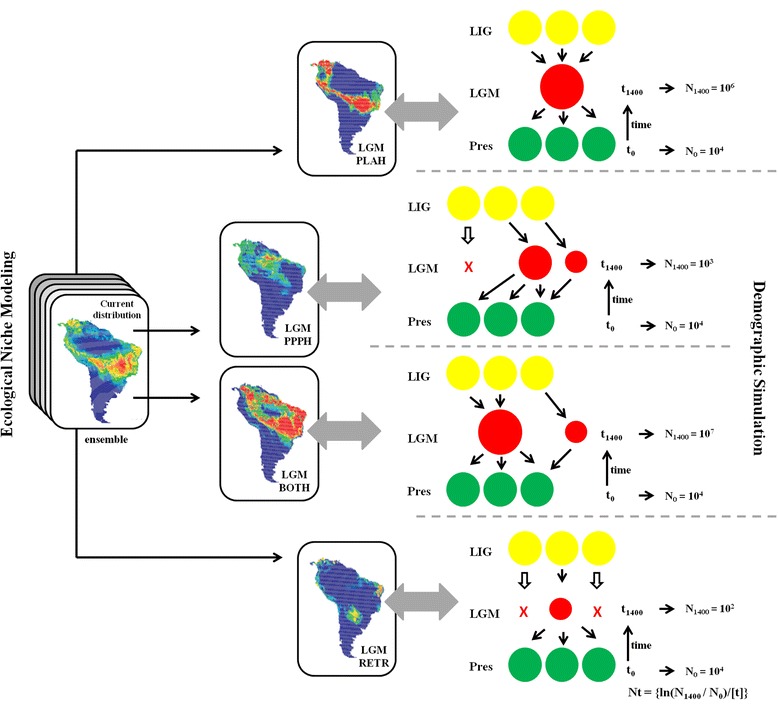
Background: We studied the phylogeography and demographical history of Tabebuia serratifolia (Bignoniaceae) to understand the disjunct geographical distribution of South American seasonally dry tropical forests (SDTFs). We specifically tested if the multiple and isolated patches of SDTFs are current climatic relicts of a widespread and continuously distributed dry forest during the last glacial maximum (LGM), the so called South American dry forest refugia hypothesis, using ecological niche modelling (ENM) and statistical phylogeography. We sampled 235 individuals of T. serratifolia in 17 populations in Brazil and analysed the polymorphisms at three intergenic chloroplast regions and ITS nuclear ribosomal DNA.
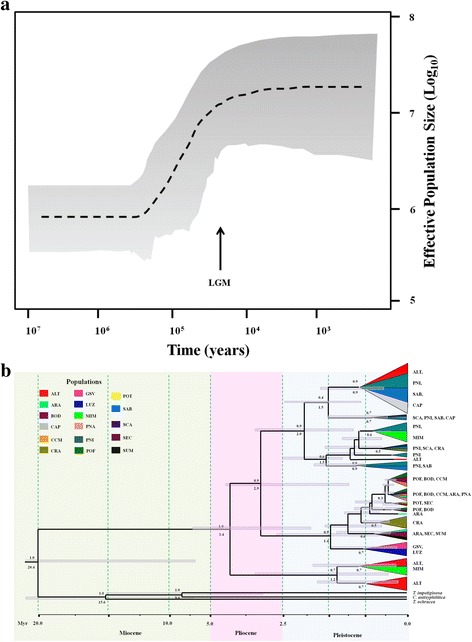
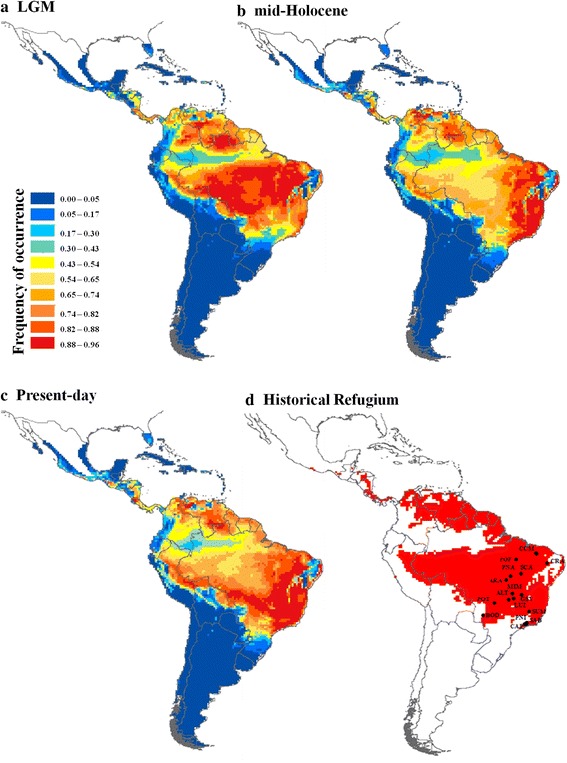
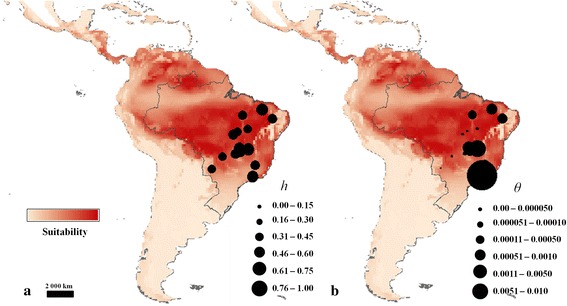
Results: Coalescent analyses showed a demographical expansion at the last c. 130 ka (thousand years before present). Simulations and ENM also showed that the current spatial pattern of genetic diversity is most likely due to a scenario of range expansion and range shift towards the Amazon Basin during the colder and arid climatic conditions associated with the LGM, matching the expected for the South American dry forest refugia hypothesis, although contrasting to the Pleistocene Arc hypothesis. Populations in more stable areas or with higher suitability through time showed higher genetic diversity. Postglacial range shift towards the Southeast and Atlantic coast may have led to spatial genome assortment due to leading edge colonization as the species tracks suitable environments, leading to lower genetic diversity in populations at higher distance from the distribution centroid at 21 ka.
Conclusion: Haplotype sharing or common ancestry among populations from Caatinga in Northeast Brazil, Atlantic Forest in Southeast and Cerrado biome and ENM evince the past connection among these biomes.
Keywords: Bignoniaceae; Dry forest refugia; Ecological niche modelling; Phylogeography; Pleistocene arc hypothesis; Quaternary climatic changes.
Figures
References
-
- Caetano S, Prado D, Pennington RT, Beck S, Oliveira-Filho A, Spichiger R, Naciri Y. The history of seasonally dry tropical forests in eastern South America: inferences from the genetic structure of the tree Astronium urundeuva (Anacardiaceae) Mol Ecol. 2008;17:3147–59. doi: 10.1111/j.1365-294X.2008.03817.x. - DOI - PubMed
-
- Collevatti RG, Terribile LC, Lima-Ribeiro MS, Nabout JC, Oliveira G, Rabelo SG, et al. A coupled phylogeographical and species distribution modelling approach recovers the demographical history of a Neotropical seasonally dry forest tree species. Mol Ecol. 2012;21:5845–63. doi: 10.1111/mec.12071. - DOI - PubMed
-
- Prado DE, Gibbs PE. Patterns of species distributions in the dry seasonal forests of South America. Ann Miss Bot Gard. 1993;80:902–27. doi: 10.2307/2399937. - DOI
-
- Pennington RT, Prado DE, Pendry CA. Neotropical seasonally dry forests and quaternary vegetation changes. J Biogeogr. 2000;27:261–73. doi: 10.1046/j.1365-2699.2000.00397.x. - DOI
MeSH terms
LinkOut - more resources
Full Text Sources
Other Literature Sources
Miscellaneous
