. 2016 Nov;4(11):968-982.
doi: 10.1158/2326-6066.CIR-16-0188. Epub 2016 Oct 13.

CXCR2-Dependent Accumulation of Tumor-Associated Neutrophils Regulates T-cell Immunity in Pancreatic Ductal Adenocarcinoma

Affiliations

CXCR2-Dependent Accumulation of Tumor-Associated Neutrophils Regulates T-cell Immunity in Pancreatic Ductal Adenocarcinoma

Timothy Chao et al. Cancer Immunol Res. 2016 Nov.

Abstract

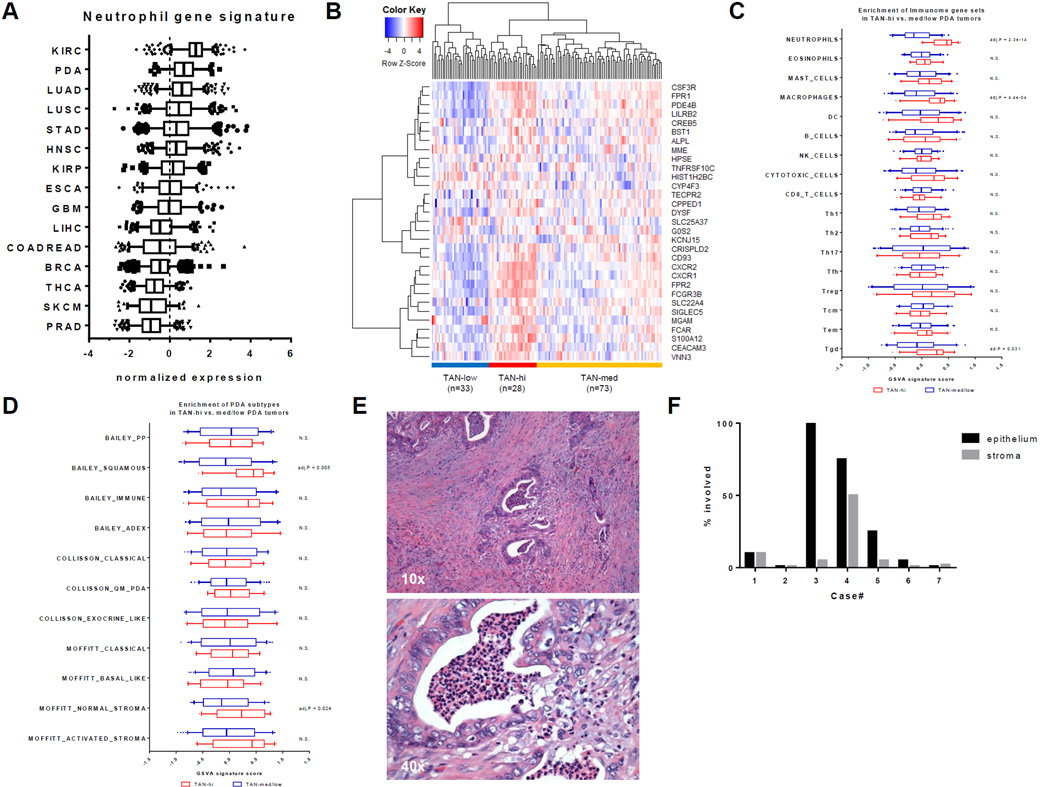
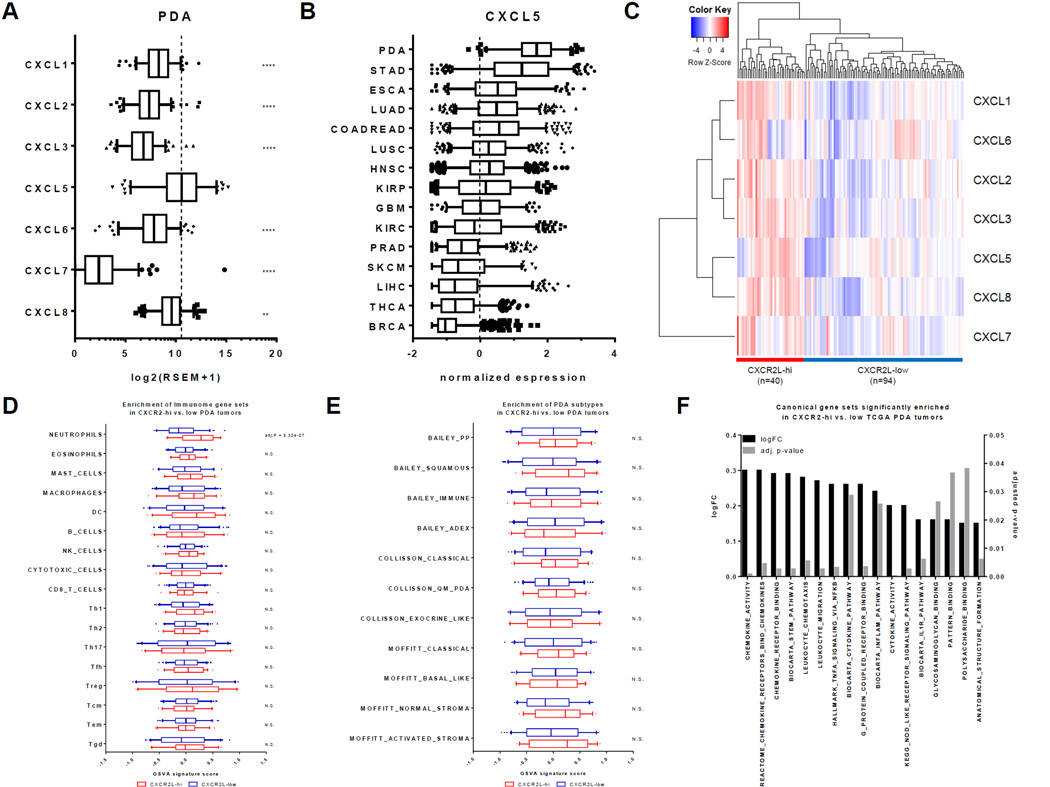
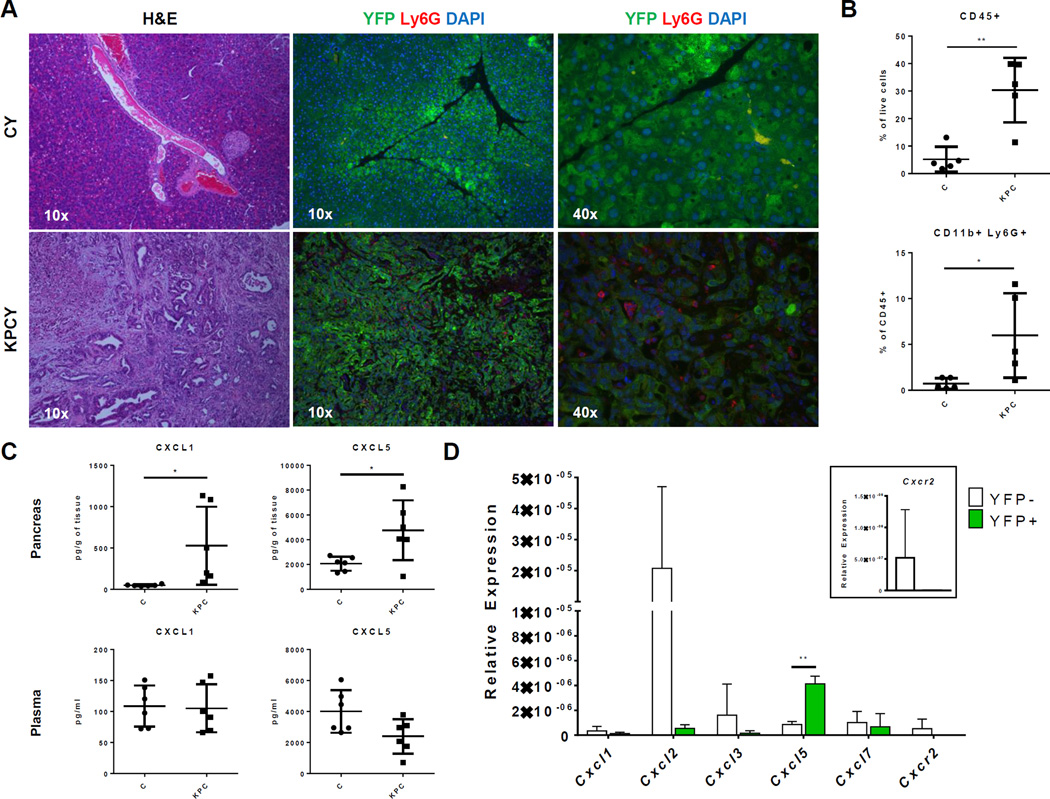
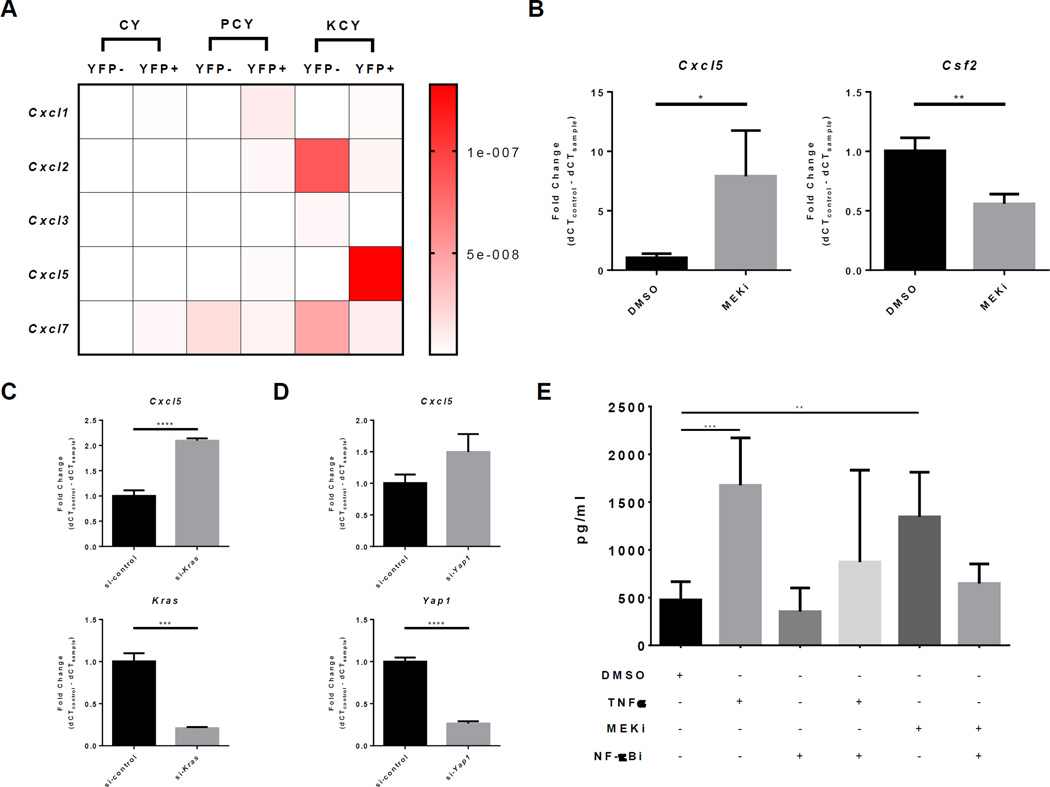
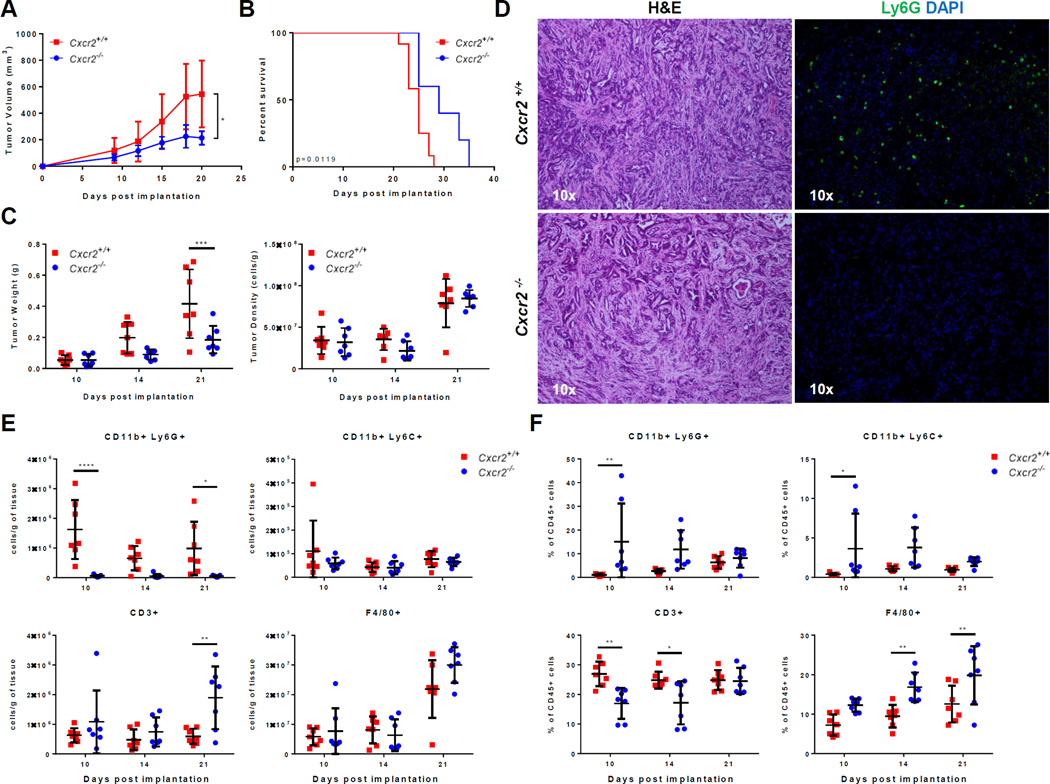
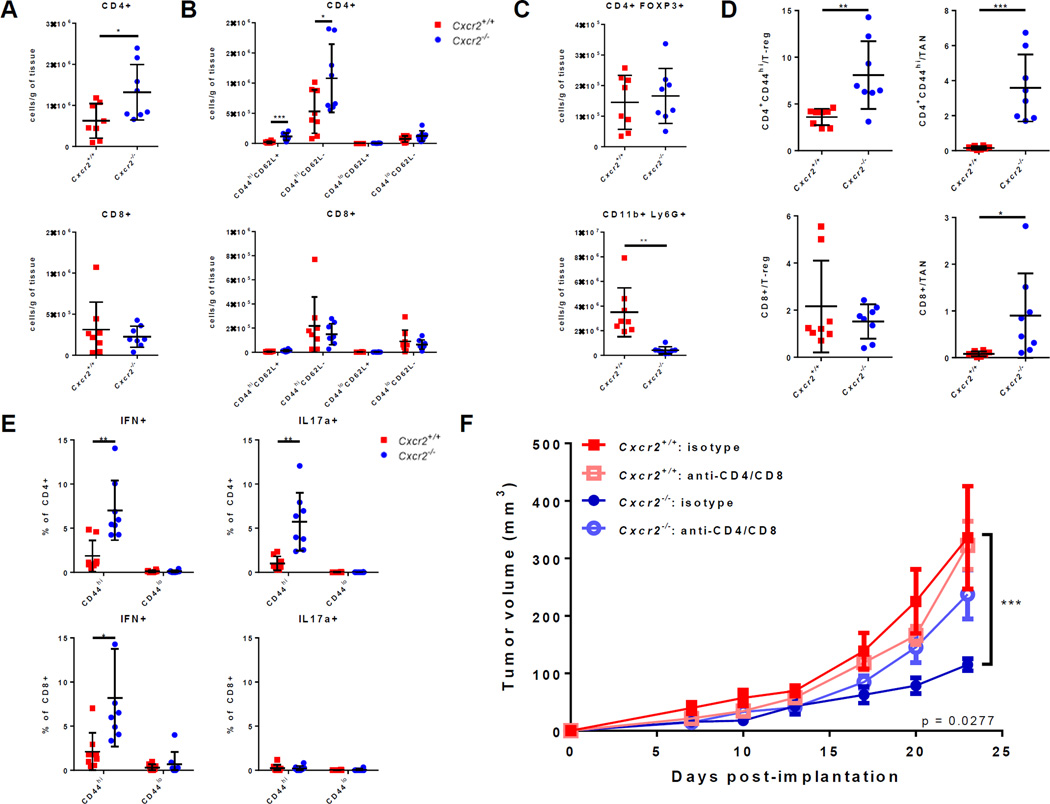
Tumor-associated neutrophils are increasingly recognized for their ability to promote tumor progression, mediate resistance to therapy, and regulate immunosuppression. Evidence from various murine models has shown that the chemokine receptor CXCR2 attracts neutrophil into tumors and, therefore, represents a tractable therapeutic target. Here, we report prominent expression of a neutrophil gene signature in a subset of human pancreatic adenocarcinoma (PDA). CXCL5 was the most prominently expressed CXCR2 ligand in human PDA, and its expression was higher in PDA than in any other common tumor represented in The Cancer Genome Atlas. Using a genetically engineered mouse model of PDA, we found that tumor and stromal cells differentially expressed CXCR2 ligands, with Cxcl5 high in tumor and Cxcl2 high in stroma. Cxcl5 expression was associated with mutant Kras expression and regulated by NF-κB activation. Host CXCR2 inhibition by genetic ablation prevented neutrophil accumulation in pancreatic tumors and led to a T cell-dependent suppression of tumor growth. In the absence of neutrophils, activated and functional T cells infiltrated pancreatic tumors otherwise devoid of effector T cells. Thus, the CXCR2-ligand axis helps establish an immunosuppressive microenvironment in PDA, highlighting the potential utility of targeting this axis as a novel therapy for this deadly disease. Cancer Immunol Res; 4(11); 968-82. ©2016 AACR.


Conflict of interest statement

The authors declare no potential financial conflicts of interest

Figures

Figure 1
Figure 1. A subset of human PDA have significant TAN involvement
(A) Normalized expression (z-scores) of the neutrophil gene signature in primary tumors across 15 TCGA cancer cohorts. Boxplot whiskers at 5–95th percentile. Dashed line represents the average expression value. (B) Clustering of 134 human TCGA PDA samples using the 31 genes in the neutrophil signature into TAN-high, TAN-med, and TAN-low groups. (C) Comparison of GSVA signature scores for 17 different immune cell types between TAN-high and TAN-med/low groups. Holm-Sidak multiple comparison test; N.S. = Not Significant. (D) Comparison of GSVA signature scores for PDA subtypes between TAN-high and TAN-med/low groups. Holm-Sidak multiple comparison test; N.S. = Not Significant. (E) H&E stain of a representative, resected human PDA sample (n = 12) showing TAN involvement in the cancer epithelium, stroma, and lumen. (F) Bar graph of the percentage of cancer epithelium or stroma involved in each of the 7 PDA cases with TAN infiltration.
Figure 2
Figure 2. CXCR2 ligand expression is strongly associated with neutrophil and NF-κB pathway gene sets in human PDA
(A) Distribution of RSEM expression for all CXCR2 ligands in 134 human TCGA PDA tumors. Boxplot whiskers at 5–95th percentile. Dashed line represents the average expression value of CXCL5. **, P ≤ 0.01; ****, P ≤ 0.001 (1-way ANOVA, Dunnett’s multiple comparison test against CXCL5). (B) Normalized expression (z-scores) of CXCL5 in primary tumors across 15 TCGA cancer cohorts. Boxplot whiskers at 5–95th percentile. Dashed line represents the average expression value. (C) Clustering of 134 human TCGA PDA samples using CXCR2L expressions into CXCR2L-high and CXCR2L-low groups. (D) Comparison of GSVA signature scores for 17 different immune cell types between CXCR2L-high and CXCR2L-low groups. Holm-Sidak multiple comparison test; N.S. = Not Significant. (E) Comparison of GSVA signature scores for PDA subtypes between CXCR2L-high and CXCR2L-low groups. Holm-Sidak multiple comparison test; N.S. = Not Significant. (F) Log fold-change of GSVA signature scores and the adjusted p-values of canonical gene sets that are significantly elevated in CXCR2L-high compared to CXCR2L-low groups.
Figure 3
Figure 3. KPC tumors have elevated neutrophils infiltration and Cxcl5 expression
A–D, An independent cohort of 4–6 months old, tumor-bearing KPC/KPCY and matched controls was used for each of the following figures. Each of these experiments was done only once. (A) Representative H&E (10×) and YFP-Ly6G-DAPI (10× and 40×) stains of slides from the pancreas of 4–6 months old tumor-bearing KPCY mice and their age-matched CY controls (n = 4 per group). (B) Flow cytometric analysis of CD45+ immune cells and CD11b+Ly6G+ neutrophils in the pancreas of tumor-bearing KPC mice (n = 5) compared to age-matched controls (n = 5). Graphs show mean ± s.d. of one experiment. *, P value ≤ 0.05; **, P value ≤ 0.01 (unpaired t-test). (C) Protein quantification of CXCL1 and CXCL5 in the pancreas and plasma of KPC (n = 6) compared to controls (n = 6) mice. Graphs show mean ± s.d. of one experiment. *, P value ≤ 0.05; (unpaired t-test). (D) CXCR2 ligand expression in YFP+ cancer cells compared to YFP stromal cells in KPCY pancreatic tumors (n = 3). Inset shows Cxcr2 expression on a different scale. Gene expressions were normalized to 18S. Graphs show mean ± s.d. of one experiment. *, P value ≤ 0.05; **, P value ≤ 0.01 (unpaired t-test).
Figure 4
Figure 4. TNFα and KRAS/MEK inhibition induce CXCL5 expression in a NF-κB dependent manner
(A) Heatmap of relative CXCR2 ligand expression by YFP+ pancreatic and YFP stromal cells in 4–6 months old CY, PCY, and KCY mice (n = 3 per group). (B) Fold change of Cxcl5 and Csf2 (GM-CSF) expression in 4662 PDA cells treated with 10µM U0126 (MEK inhibitor) compared to DMSO. Graphs show mean ± s.d. of 3 independent experiments. *, P ≤ 0.05; **, P ≤ 0.01 (unpaired t-test). (C) Fold change of Cxcl5 and Kras expression in Kras siRNA–treated compared to control siRNA–treated 4662 PDA cells. Graph shows mean ± s.d. of 3 independent experiments. ***, P ≤ 0.001; ****, P ≤ 0.0001 (unpaired t-test). (D) Fold change of Cxcl5 and Yap1 expression in si-Yap1 treated compared to si-control treated 4662 PDA cells. Graph shows mean ± s.d. of 3 independent experiments. ****, P ≤ 0.0001 (unpaired t-test). (E) CXCL5 protein level in the supernatant of 4662 PDA cells treated with the indicated combinations of DMSO control, 10ng/mL TNFα, 10µM U0126 (MEK inhibitor), or 20µM Wedeloactone (NF-κB inhibitor). Graph shows mean ± s.d. of 3 independent experiments. *, P ≤ 0.05; **, P ≤ 0.01 (1-way ANOVA, Holm-Sidak’s multiple comparison test).
Figure 5
Figure 5. CXCR2 ablation specifically prevents TAN accumulation and inhibits tumor growth
A–F, An independent cohort of Cxcr2−/− and Cxcr2+/+ mice was used for Figures A, C, and E–F, another cohort for Figure B, and another cohort for Figure D. Each of these experiments was done once unless otherwise indicated. (A) 4662 PDA tumor growth in Cxcr2−/− compared to Cxcr2+/+ littermates after subcutaneous implantation (n = 7 per group). Graph shows mean ± s.d. of one experiment. *, P ≤ 0.05 on Day 21 (2-way ANOVA, Dunnett’s multiple comparison test). The observed difference in tumor growth until Day 21 was observed in a second, independent experiment. (B) Kaplan-Meier survival analysis of Cxcr2−/− (n = 6) compared to Cxcr2+/+ (n = 10) littermates subcutaneously implanted with 4662 PDA tumors. (P value = 0.0119, log rank test). This result is representative of two independent experiments. (C) Comparison of tumor weights and cell-density in Cxcr2−/− compared to Cxcr2+/+ hosts on Day 10, 14, and 21 (n = 7 per group/day). Graph shows mean ± s.d. of one experiment. ***, P ≤ 0.001 (2-way ANOVA, Sidak’s multiple comparison test). (D) Representative H&E (10×) and Ly6G-DAPI (10×) stain in Cxcr2−/− compared to Cxcr2+/+ controls (n = 8 per group). (E) Flow cytometric measurement of the density of CD11b+Ly6G+ TANs, CD11b+Ly6C+ monocytes, CD3+ T cells, and F4/80+ macrophages in the tumors of Cxcr2−/− and Cxcr2+/+ littermates on Day 10, 14, and 21 (n = 7/day/group). Graph shows mean ± s.d. of one experiment. *, P ≤ 0.05; **, P ≤ 0.01; ***, P<0.001 (2-way ANOVA, Sidak’s multiple comparison test). The observed differences of TANs, monocytes, T cells, and macrophages on Day 21 were repeated in another independent experiment. (F) The percentage of CD11b+Ly6G+ TANs, CD11b+Ly6C+ monocytes, CD3+ T cells, and F4/80+ macrophages in the spleens of Cxcr2−/− and Cxcr2+/+ littermates on Day 10, 14, and 21 (n = 7/day/group). Graph shows mean ± s.d. of one experiment. *, P ≤ 0.05; **, P ≤ 0.01 (2-way ANOVA, Sidak’s multiple comparison test).
Figure 6
Figure 6. Absence of TANs leads to increased infiltration and function of activated T cells
A–E, Cxcr2−/− and Cxcr2+/+ mice were subcutaneously implanted with the 4662 cell line and sacrificed at 4 weeks (n = 8 per group). Graphs show mean ± s.d. of one experiment, which was done only once. *P < 0.05, ** P < 0.01, *** P < 0.001 (unpaired t-test). (A) Densities of tumor-infiltration CD4+ and CD8+ T cells. (B) Densities of CD44hiCD62L+ memory, CD44hiCD62L effector, and CD44loCD62L+ or CD44loCD62L naïve CD4+ or CD8+ T cells. (C) Densities of CD4+FOXP3+ Tregs CD11b+Ly6G+ tumor-associated neutrophils. (D) Ratios of the densities of CD4+CD44hi or CD8+ effector T cells to the densities of CD4+FOXP3+ Tregs or CD11b+Ly6G+ TANs. (E) The percentage of CD44hi activated or CD44lo naïve CD4+ or CD8+ T cells that expresses IFNγ or IL17 after ex vivo stimulation with PMA/ionomycin for 5 hours at 37°C. (F) 4662 PDA tumor growth in Cxcr2−/− and Cxcr2+/+ mice treated with 200mg anti-CD4/anti-CD8 depleting antibodies or 200mg isotype every three days intraperitoneally (n ≥ 7 per group). Graph shows mean ± s.e.m. of one experiment. *** P ≤ 0.001 on Day 23 between isotype-treated Cxcr2−/− and Cxcr2+/+ mice (2-way ANOVA with column factor P value = 0.0277, Dunnett’s multiple comparison test). Results are representative of two independent experiments.

References

    1. Conroy T, Desseigne F, Ychou M, Bouche O, Guimbaud R, Becouarn Y, et al. FOLFIRINOX versus Gemcitabine for Metastatic Pancreatic Cancer. New England Journal of Medicine. 2011;364:1817–1825. - PubMed
    1. Hoff Von DD, Ervin T, Arena FP, Chiorean EG, Infante J, Moore M, et al. Increased survival in pancreatic cancer with nab-paclitaxel plus gemcitabine. New England Journal of Medicine. 2013;369:1691–1703. - PMC - PubMed
    1. Siegel RL, Miller KD, Jemal A. Cancer statistics, 2016. CA: A Cancer Journal for Clinicians. 2016;66:7–30. - PubMed
    1. Rahib L, Smith BD, Aizenberg R, Rosenzweig AB, Fleshman JM, Matrisian LM. Projecting cancer incidence and deaths to 2030: the unexpected burden of thyroid, liver, and pancreas cancers in the United States. Cancer Research. 2014;74:2913–2921. - PubMed
    1. Hanahan D, Weinberg R. Hallmarks of cancer: the next generation. Cell. 2011;144:646–674. - PubMed

Publication types

MeSH terms