. 2017 Jan;66(1):193-205.
doi: 10.2337/db16-0915. Epub 2016 Oct 13.

Metformin Suppresses Diabetes-Accelerated Atherosclerosis via the Inhibition of Drp1-Mediated Mitochondrial Fission

Affiliations

Metformin Suppresses Diabetes-Accelerated Atherosclerosis via the Inhibition of Drp1-Mediated Mitochondrial Fission

Qilong Wang et al. Diabetes. 2017 Jan.

Abstract

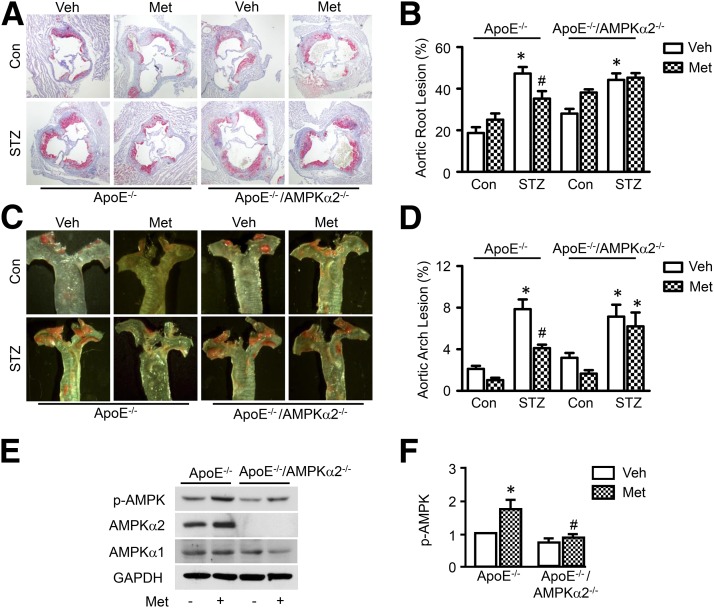
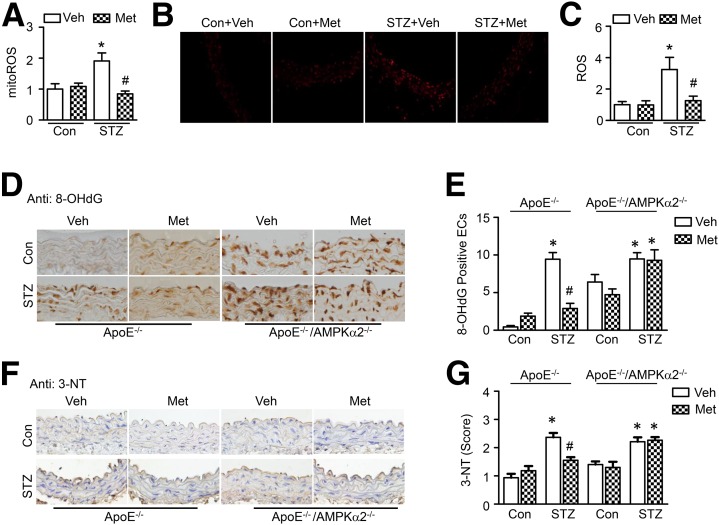
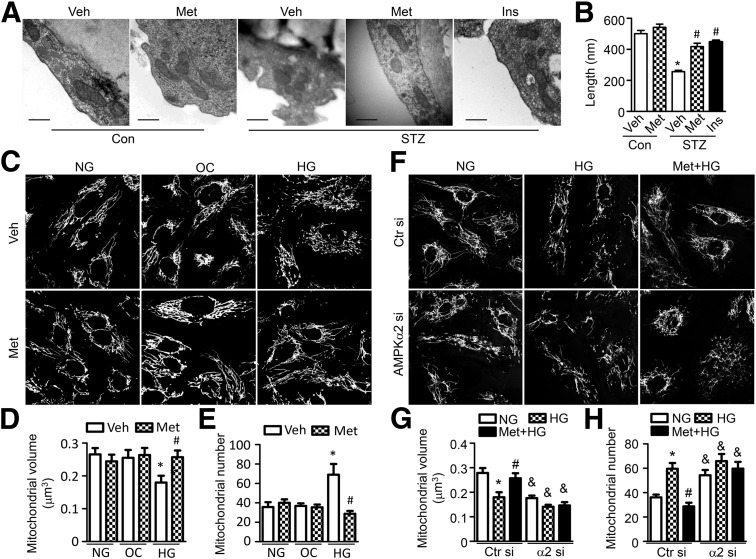
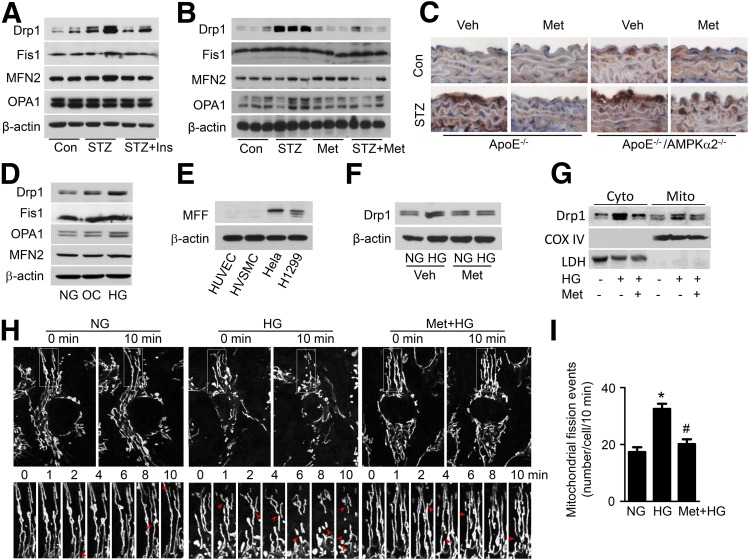
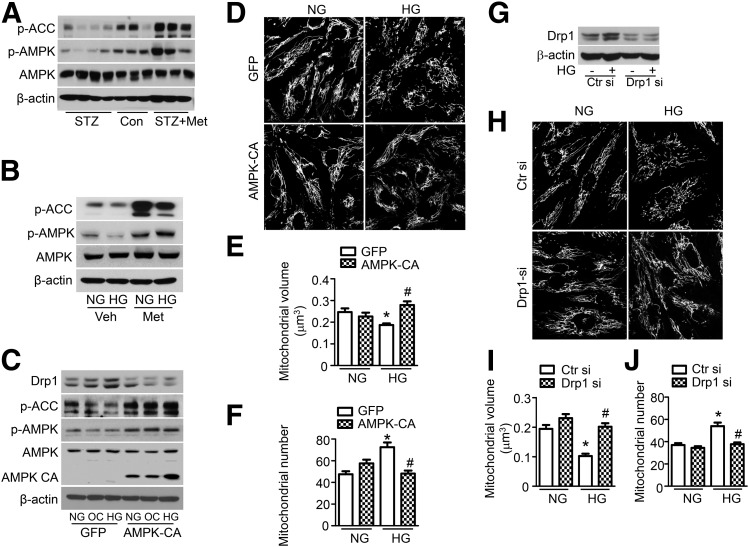
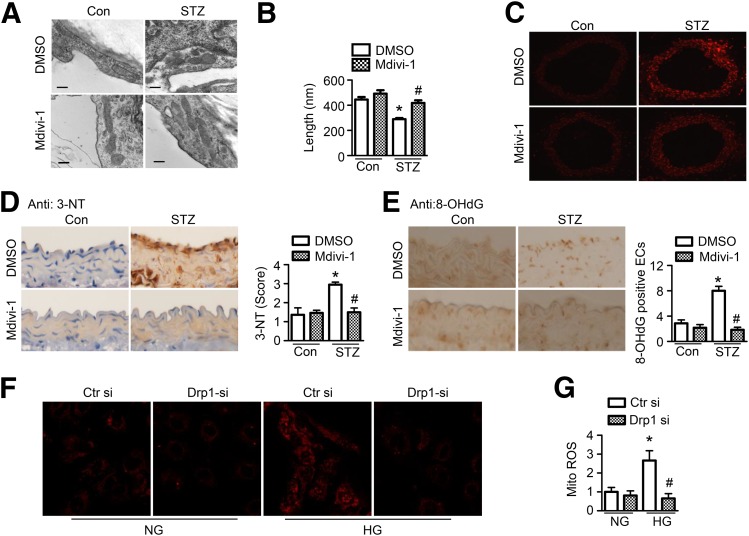
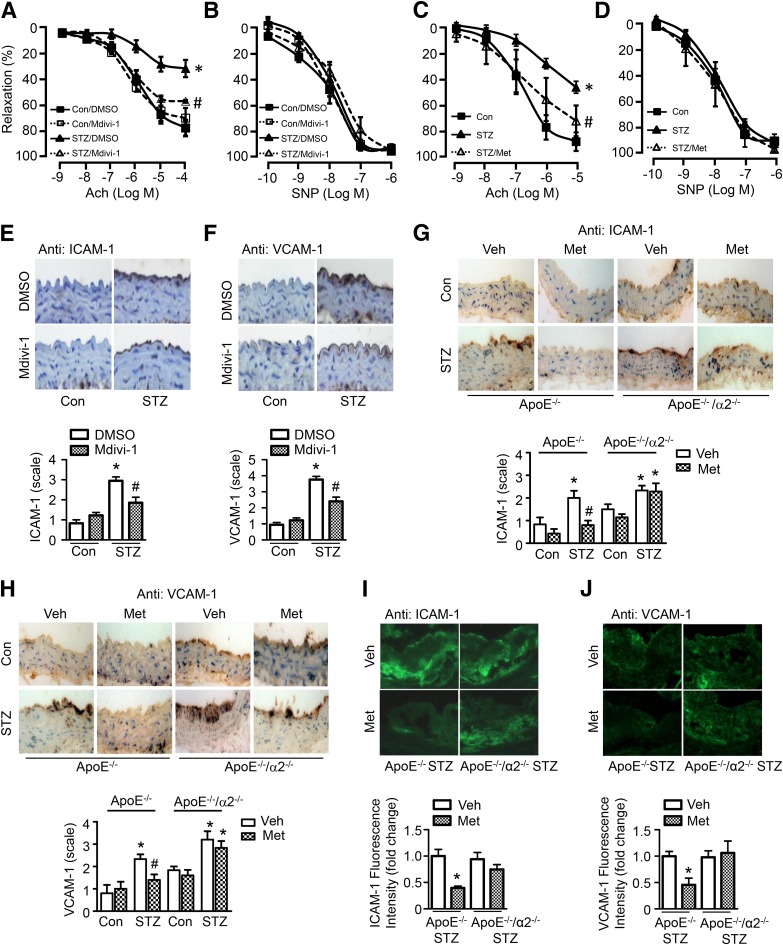
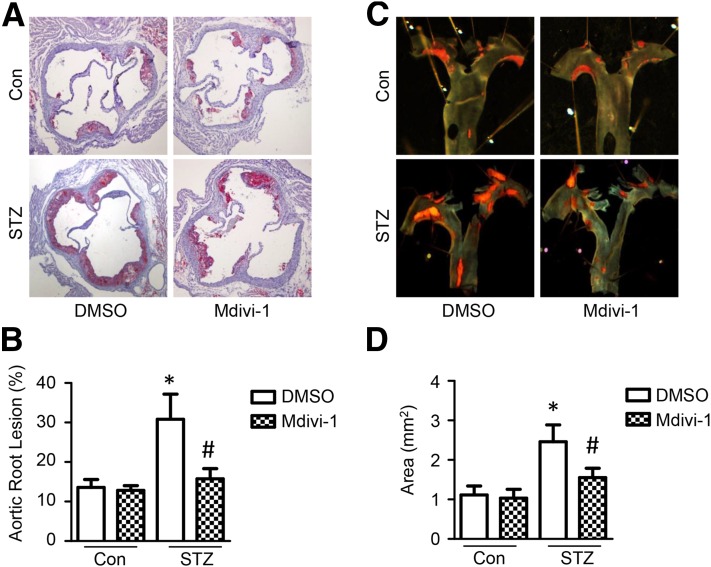
Metformin is a widely used antidiabetic drug that exerts cardiovascular protective effects in patients with diabetes. How metformin protects against diabetes-related cardiovascular diseases remains poorly understood. Here, we show that metformin abated the progression of diabetes-accelerated atherosclerosis by inhibiting mitochondrial fission in endothelial cells. Metformin treatments markedly reduced mitochondrial fragmentation, mitigated mitochondrial-derived superoxide release, improved endothelial-dependent vasodilation, inhibited vascular inflammation, and suppressed atherosclerotic lesions in streptozotocin (STZ)-induced diabetic ApoE-/- mice. In high glucose-exposed endothelial cells, metformin treatment and adenoviral overexpression of constitutively active AMPK downregulated mitochondrial superoxide, lowered levels of dynamin-related protein (Drp1) and its translocation into mitochondria, and prevented mitochondrial fragmentation. In contrast, AMPK-α2 deficiency abolished the effects of metformin on Drp1 expression, oxidative stress, and atherosclerosis in diabetic ApoE-/-/AMPK-α2-/- mice, indicating that metformin exerts an antiatherosclerotic action in vivo via the AMPK-mediated blockage of Drp1-mediated mitochondrial fission. Consistently, mitochondrial division inhibitor 1, a potent and selective Drp1 inhibitor, reduced mitochondrial fragmentation, attenuated oxidative stress, ameliorated endothelial dysfunction, inhibited inflammation, and suppressed atherosclerosis in diabetic mice. These findings show that metformin attenuated the development of atherosclerosis by reducing Drp1-mediated mitochondrial fission in an AMPK-dependent manner. Suppression of mitochondrial fission may be a therapeutic approach for treating macrovascular complications in patients with diabetes.


Figures

Figure 1
Figure 1
Metformin reduces atherosclerotic lesions in diabetic ApoE−/− mice, but not in diabetic ApoE/AMPK-α2−/− mice. ApoE−/− and ApoE−/−/AMPK-α2−/− mice were induced with diabetes by STZ injection and treated with metformin (Met; 300 mg/kg/d) or vehicle (Veh) for 12 weeks (n = 8–10 per group). A: Representative images of Oil Red O staining of atherosclerotic lesions at the aortic sinus. B: Quantitative analysis of atherosclerotic lesion size in the aortic root. C: Representative images of Sudan IV staining of atherosclerotic lesions at the aortic arch. D: Quantitative analysis of the en face atherosclerotic lesion area in the aortic arch. *P < 0.05 vs. control mice (Con); #P < 0.05 vs. Veh. Phosphorylation of AMPK at Thr-172 (p-AMPK) (E) and expression of total AMPK-α1 and AMPK-α2 in the aorta (F) were was determined by Western blotting. n = 4; *P < 0.05 vs. Veh; #P < 0.05 vs. WT.
Figure 2
Figure 2
Metformin inhibits mitochondrial ROS (mitoROS) production and oxidative stress. AC: STZ-induced diabetic C57BL/6J WT mice were treated with metformin (Met; 300 mg/kg/d) or vehicle (Veh) in drinking water for 4 weeks. A: Thoracic aortas were incubated in Krebs buffer with 2 μmol/L MitoSOX Red for 30 min. Mitochondrial superoxide was measured by high-performance liquid chromatography (n = 4). B: Frozen thoracic aortic sections were incubated with 5 μmol/L DHE for 30 min and analyzed using fluorescence microscopy. C: Quantification of fluorescence intensity for ROS levels in the aorta (original magnification ×40). n = 4. *P < 0.05 vs. control (Con); #P < 0.05 vs. Veh. DG: STZ-induced diabetic ApoE−/− and ApoE−/−/AMPK-α2−/− mice were treated with metformin or vehicle for 12 weeks. D: Representative images of the immunohistochemical staining of 8-OHdG on thoracic aortic sections (original magnification ×40). E: Quantification of 8-OHdG–positive endothelial cells (ECs). n = 6. *P < 0.05 vs. Con; #P < 0.05 vs. Veh. F: Representative images of the immunohistochemical staining of 3-NT (original magnification ×40). G: Quantification of positive staining for 3-NT in thoracic aortic sections. n = 5. *P < 0.05 vs. Con; #P < 0.05 vs. Veh.
Figure 3
Figure 3
Metformin diminishes hyperglycemia-induced mitochondrial fragmentation in endothelial cells. A and B: STZ-induced diabetic WT mice were administrated with metformin (Met; 300 mg/kg/d) or vehicle (Veh) for 4 weeks or intraperitoneally injected with insulin (STZ+Ins, 0.5 units/kg, twice per day) for 14 days. A: Representative electron microscopic images of mitochondria in the aortic endothelium (original magnification ×25,000; scale bar = 500 nm). B: Quantification of mitochondrial length. n = 6 mice, at least 50 mitochondria per mice were analyzed. *P < 0.05 vs. control (Con); #P < 0.05 vs. Veh. C–E: HUVECs were pretreated with 2 mmol/L metformin for 2 h and cultured in EBM containing normal glucose (NG), 30 mmol/L d-glucose (high glucose [HG]), or 25 mmol/L mannitol plus 5 mmol/L d-glucose (osmotic control [OC]) for 24 h. FH: HUVECs were transfected with control siRNA (Ctr si) or AMPK-α2 siRNA (α2 si) for 48 h, then pretreated with 2 mmol/L metformin for 2 h and cultured with high-glucose medium for 24 h. Mitochondria were labeled with MitoTracker Deep Red, and mitochondrial morphology was analyzed using fluorescence microscopy. Mitochondrial volume and number were quantified, as described in the research design and methods. n ≥ 100. *P < 0.05 vs. NG; #P < 0.05 vs Veh; &P < 0.05 vs. Ctr si.
Figure 4
Figure 4
Metformin downregulates Drp1 expression and mitochondrial fission. STZ-induced diabetic WT mice were intraperitoneally injected with 0.5 units/kg insulin (Ins) for 14 days (A) or administered metformin (Met; 300 mg/kg/d) in drinking water for 4 weeks (B). Mitochondrial dynamics-related proteins, including Drp1, mitochondrial Fis1 protein, MFN2, and OPA1, in the aorta were analyzed by Western blotting. C: Representative of immunohistochemical staining of Drp1 on thoracic aortic sections from diabetic ApoE−/− and ApoE−/−/AMPK-α2−/− mice treated with metformin. D: HUVECs were treated with normal glucose (NG), 30 mmol/L d-glucose (high glucose [HG]), or 25 mmol/L mannitol plus 5 mmol/L d-glucose (osmotic control [OC]) for 24 h. Mitochondrial Drp1 protein expression was determined by Western blotting. E: Protein levels of mitochondrial MFF in HUVECs, HVSMCs, HeLa cells, and H1299 cells. F–I: HUVECs were pretreated with 2 mmol/L metformin for 2 h, followed by stimulation with high glucose for 24 h. F: Drp1 protein level was measured by Western blotting. G: Western blot analysis of Drp1 protein levels in cytoplasmic (Cyto) and mitochondrial (Mito) fractions. Cyclooxygenase (COX) IV and lactate dehydrogenase (LDH) were used as mitochondrial and cytosolic markers, respectively. H: Mitochondrial morphology in live HUVECs stained with MitoTracker Deep Red FM was captured using time-lapse confocal microscopy. Images were collected at 1-min intervals for 10 min. I: Quantification of mitochondrial fission events in live HUVECs. n = 15. *P < 0.05 vs. NG; #P < 0.05 vs. HG. Veh, vehicle.
Figure 5
Figure 5
AMPK activation inhibits Drp1-mediated mitochondrial fission. A: STZ-induced diabetic WT mice were treated with metformin (Met; 300 mg/kg/d) for 4 weeks. Phosphorylation of AMPK (p-AMPK) at Thr-172 and phosphorylation of ACC (p-ACC) at Ser-79 in the aorta were measured by Western blotting. B: HUVECs were pretreated with 2 mmol/L metformin for 2 h and then treated with normal glucose (NG) or high glucose (HG) for 24 h. Phosphorylation of AMPK and ACC was measured by Western blotting. CF: HUVECs were transfected with adenovirus (Ad)-AMPK-CA or Ad-GFP for 24 h, after which they were treated with high glucose for 24 h. C: Drp1 expression, p-AMPK, and p-ACC were measured by Western blotting. D: Representative images of mitochondrial morphology were captured at original magnification ×40 . Mitochondrial volume (E) and number (F) were analyzed, as described in the research design and methods. n ≥ 100. *P < 0.05 vs. NG; #P < 0.05 vs. GFP. G–J: HUVECs were transfected with Drp1 siRNA (si) for 48 h and then stimulated with high glucose for 24 h. G: Drp1 expression was measured by Western blotting. H: Representative images of mitochondrial morphology were captured at original magnification ×40. Mitochondrial volume (I) and number (J) were analyzed as described in the research design and methods. n ≥ 100. *P < 0.05 vs. NG; #P < 0.05 vs. control siRNA. OC, osmotic control; Veh, vehicle.
Figure 6
Figure 6
Inhibition of mitochondrial fission attenuates oxidative stress in diabetic aorta. AF: STZ-induced diabetic mice were treated with mdivi-1 (1.2 mg/kg/d) or vehicle (DMSO) using an osmotic pump for 14 days. A: Representative transmission electron micrographs of mitochondria in the aortic endothelium. Scale bars = 300 nm. B: Quantification of average mitochondrial length. n = 6 mice, at least 50 mitochondria per mice were analyzed. *P < 0.05 vs. control mice; #P < 0.05 vs. DMSO. C: Frozen sections of aortas were incubated with 5 μmol/L DHE for 30 min. Images were obtained at 518 nm (excitation) and 605 nm (emission). n = 5. D: Representative images of immunohistochemical staining and quantification of positive staining for 3-NT in thoracic aortic sections. n = 5. *P < 0.05 vs. control; #P < 0.05 vs. vehicle. E: Representative images of immunohistochemical staining for 8-OHdG in aortas. Quantification of 8-OHdG–positive endothelial cells (ECs). n = 5 mice. *P < 0.05 vs. control mice; #P < 0.05 vs. DMSO. F and G: HUVECs were transfected with Drp1 siRNA (si) or control siRNA for 24 h, after which they were treated with high glucose (HG) for 24 h. Mitochondrial ROS production was measured by incubating HUVECs with 2 μmol/L MitoSOX for 30 min. F: Representative fluorescence images are shown. G: Quantification of fluorescence intensity for mitochondrial ROS levels in HUVECs. n = 6. *P < 0.05 vs. normal glucose (NG); #P < 0.05 vs. control siRNA.
Figure 7
Figure 7
Inhibition of mitochondrial fission attenuates endothelial dysfunction in diabetic mice. A and B: STZ-induced diabetic mice were treated with mdivi-1 (1.2 mg/kg/d) or vehicle (DMSO) for 14 days. C and D: STZ-induced diabetic mice were treated with metformin (Met; 300 mg/kg/d) for 4 weeks. Aortic rings were contracted with U46619 (30 nmol/L). Endothelium-dependent vasodilator responses were measured in the presence of Ach (10−9 to 10−5 mol/L). Endothelium-independent vasodilator responses were measured in the presence of SNP (10−10 to 10−6 mol/L). n = 6–8. *P < 0.05 vs. control; #P < 0.05 vs. STZ. Immunohistochemical staining for ICAM-1 (E) and VCAM-1 (F) in aortas from mdivi-1–treated diabetic mice. G and H: Immunohistochemical staining and quantification of positive staining for ICAM-1 and VCAM-1 in aortas from diabetic ApoE−/− and ApoE−/−/AMPK-α2−/− mice treated with metformin or vehicle (Veh). n = 5; *P < 0.05 vs. control, #P < 0.05 vs. Veh. I and J: Immunofluorescence staining for ICAM-1 and VCAM-1 in atherosclerotic lesions of diabetic ApoE−/− and ApoE−/−/AMPK-α2−/− mice treated with metformin or vehicle. n = 4. *P < 0.05 vs. Veh.
Figure 8
Figure 8
Inhibition of mitochondrial fission attenuates hyperglycemia-accelerated atherosclerosis. ApoE−/− mice were induced with diabetes by STZ injection and treated with mdivi-1 (10 mg/kg, twice per week) or vehicle (DMSO) for 8 weeks. A: Representative images of Oil Red O staining of atherosclerotic lesions at the aortic sinus. B: Quantitative analysis of atherosclerotic lesion size in the aortic root. C: Representative images of Sudan IV staining of atherosclerotic lesions at the aortic arch. D: Quantitative analysis of en face atherosclerotic lesion areas in the aortic arch. n = 10. *P < 0.05 vs. control; #P < 0.05 vs. DMSO.

References

    1. Prasad K, Dhar I. Oxidative stress as a mechanism of added sugar-induced cardiovascular disease. Int J Angiol 2014;23:217–226 - PMC - PubMed
    1. Song P, Zou MH. Redox regulation of endothelial cell fate. Cell Mol Life Sci 2014;71:3219–3239 - PMC - PubMed
    1. Brownlee M. Biochemistry and molecular cell biology of diabetic complications. Nature 2001;414:813–820 - PubMed
    1. Zhang H, Luo Y, Zhang W, et al. . Endothelial-specific expression of mitochondrial thioredoxin improves endothelial cell function and reduces atherosclerotic lesions. Am J Pathol 2007;170:1108–1120 - PMC - PubMed
    1. Mercer JR, Yu E, Figg N, et al. . The mitochondria-targeted antioxidant MitoQ decreases features of the metabolic syndrome in ATM+/-/ApoE-/- mice. Free Radic Biol Med 2012;52:841–849 - PubMed

MeSH terms